What Is Tule Fog? California's Densest Fog Explained
Tule fog is a thick radiation fog unique to California's Central Valley. Learn how it forms, why it spills into the Bay Area, and how it differs from coastal fog.
5min read →Learn The Layers
Explore explainers, local guides, and deeper weather stories in the same cleaner visual language as the homepage.
Category
How Bay Area fog works, where it forms, and why some neighborhoods get far more of it than others.
Tule fog is a thick radiation fog unique to California's Central Valley. Learn how it forms, why it spills into the Bay Area, and how it differs from coastal fog.
5min read →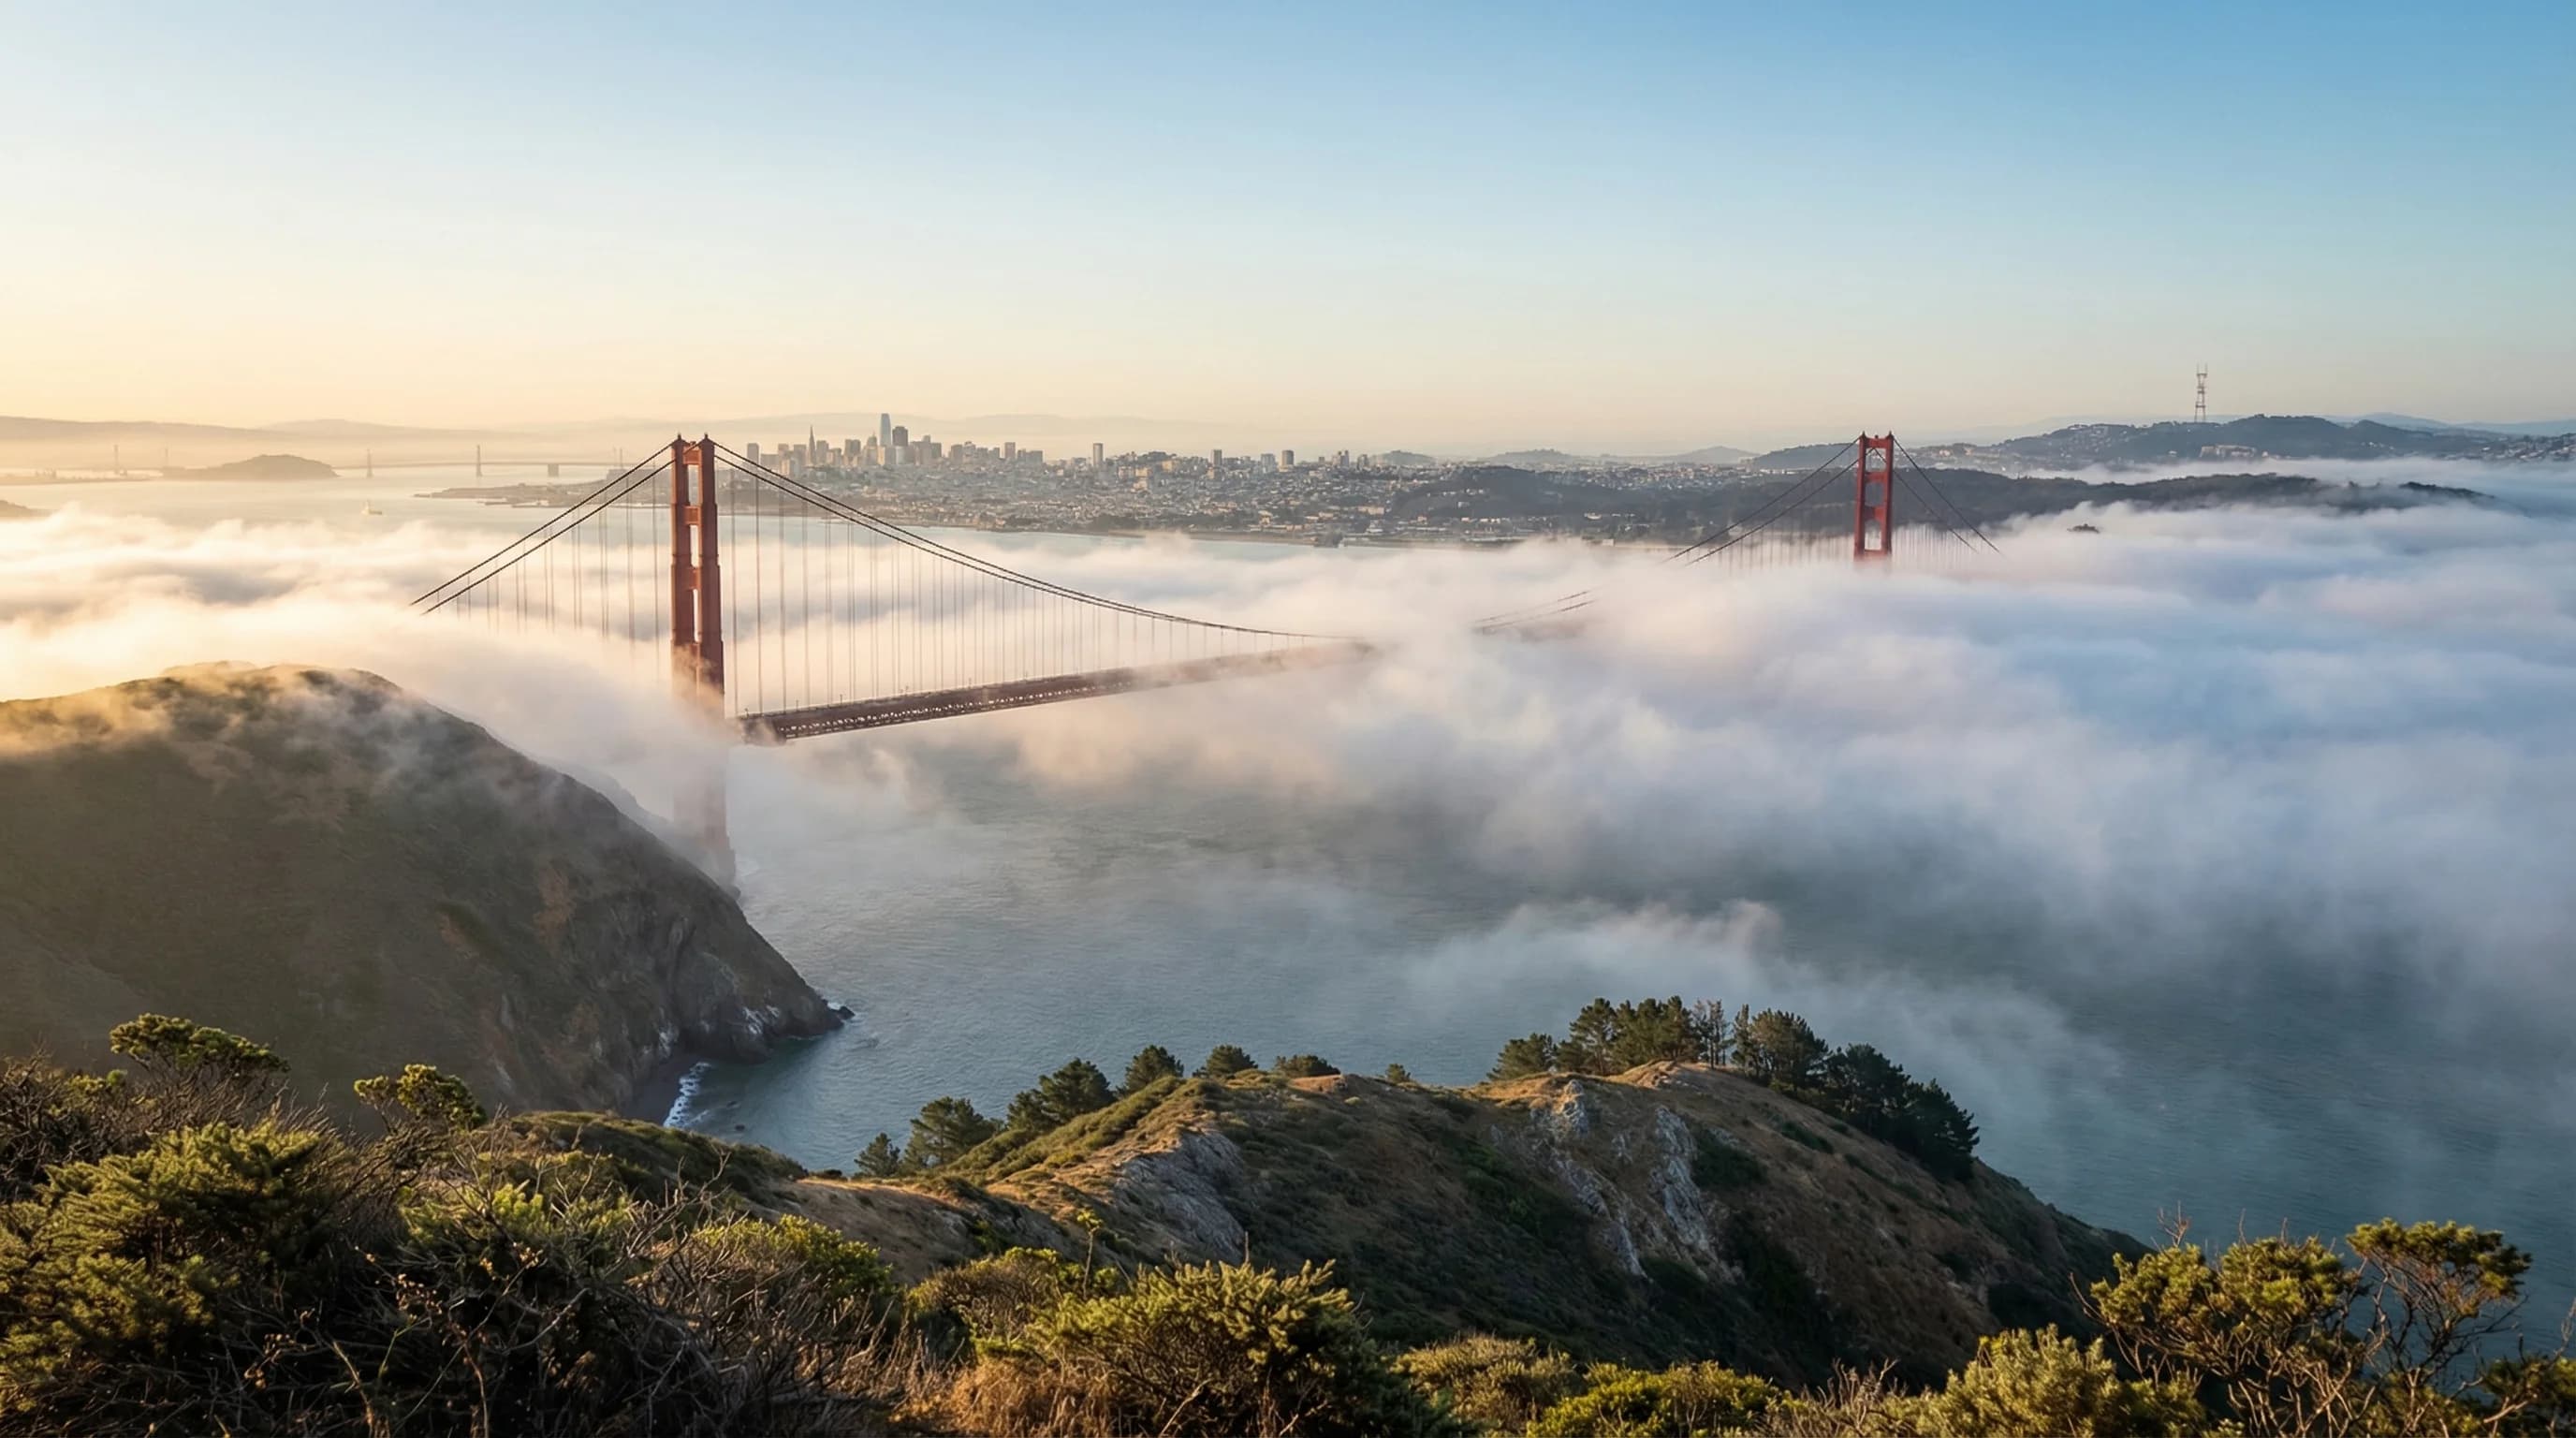
San Francisco's summer fog is driven by extreme inland heat pulling cold Pacific marine air. Discover why Karl the Fog is beloved by locals.
6min read →
Marine layer and tule fog look similar but form differently. One is a summer coastal phenomenon; the other is a winter inland hazard.
6min read →
Summer fog dominates the Bay Area because extreme inland heat creates a powerful pressure gradient that pulls cold ocean air. Winter brings clouds and rain but less intense fog.
6min read →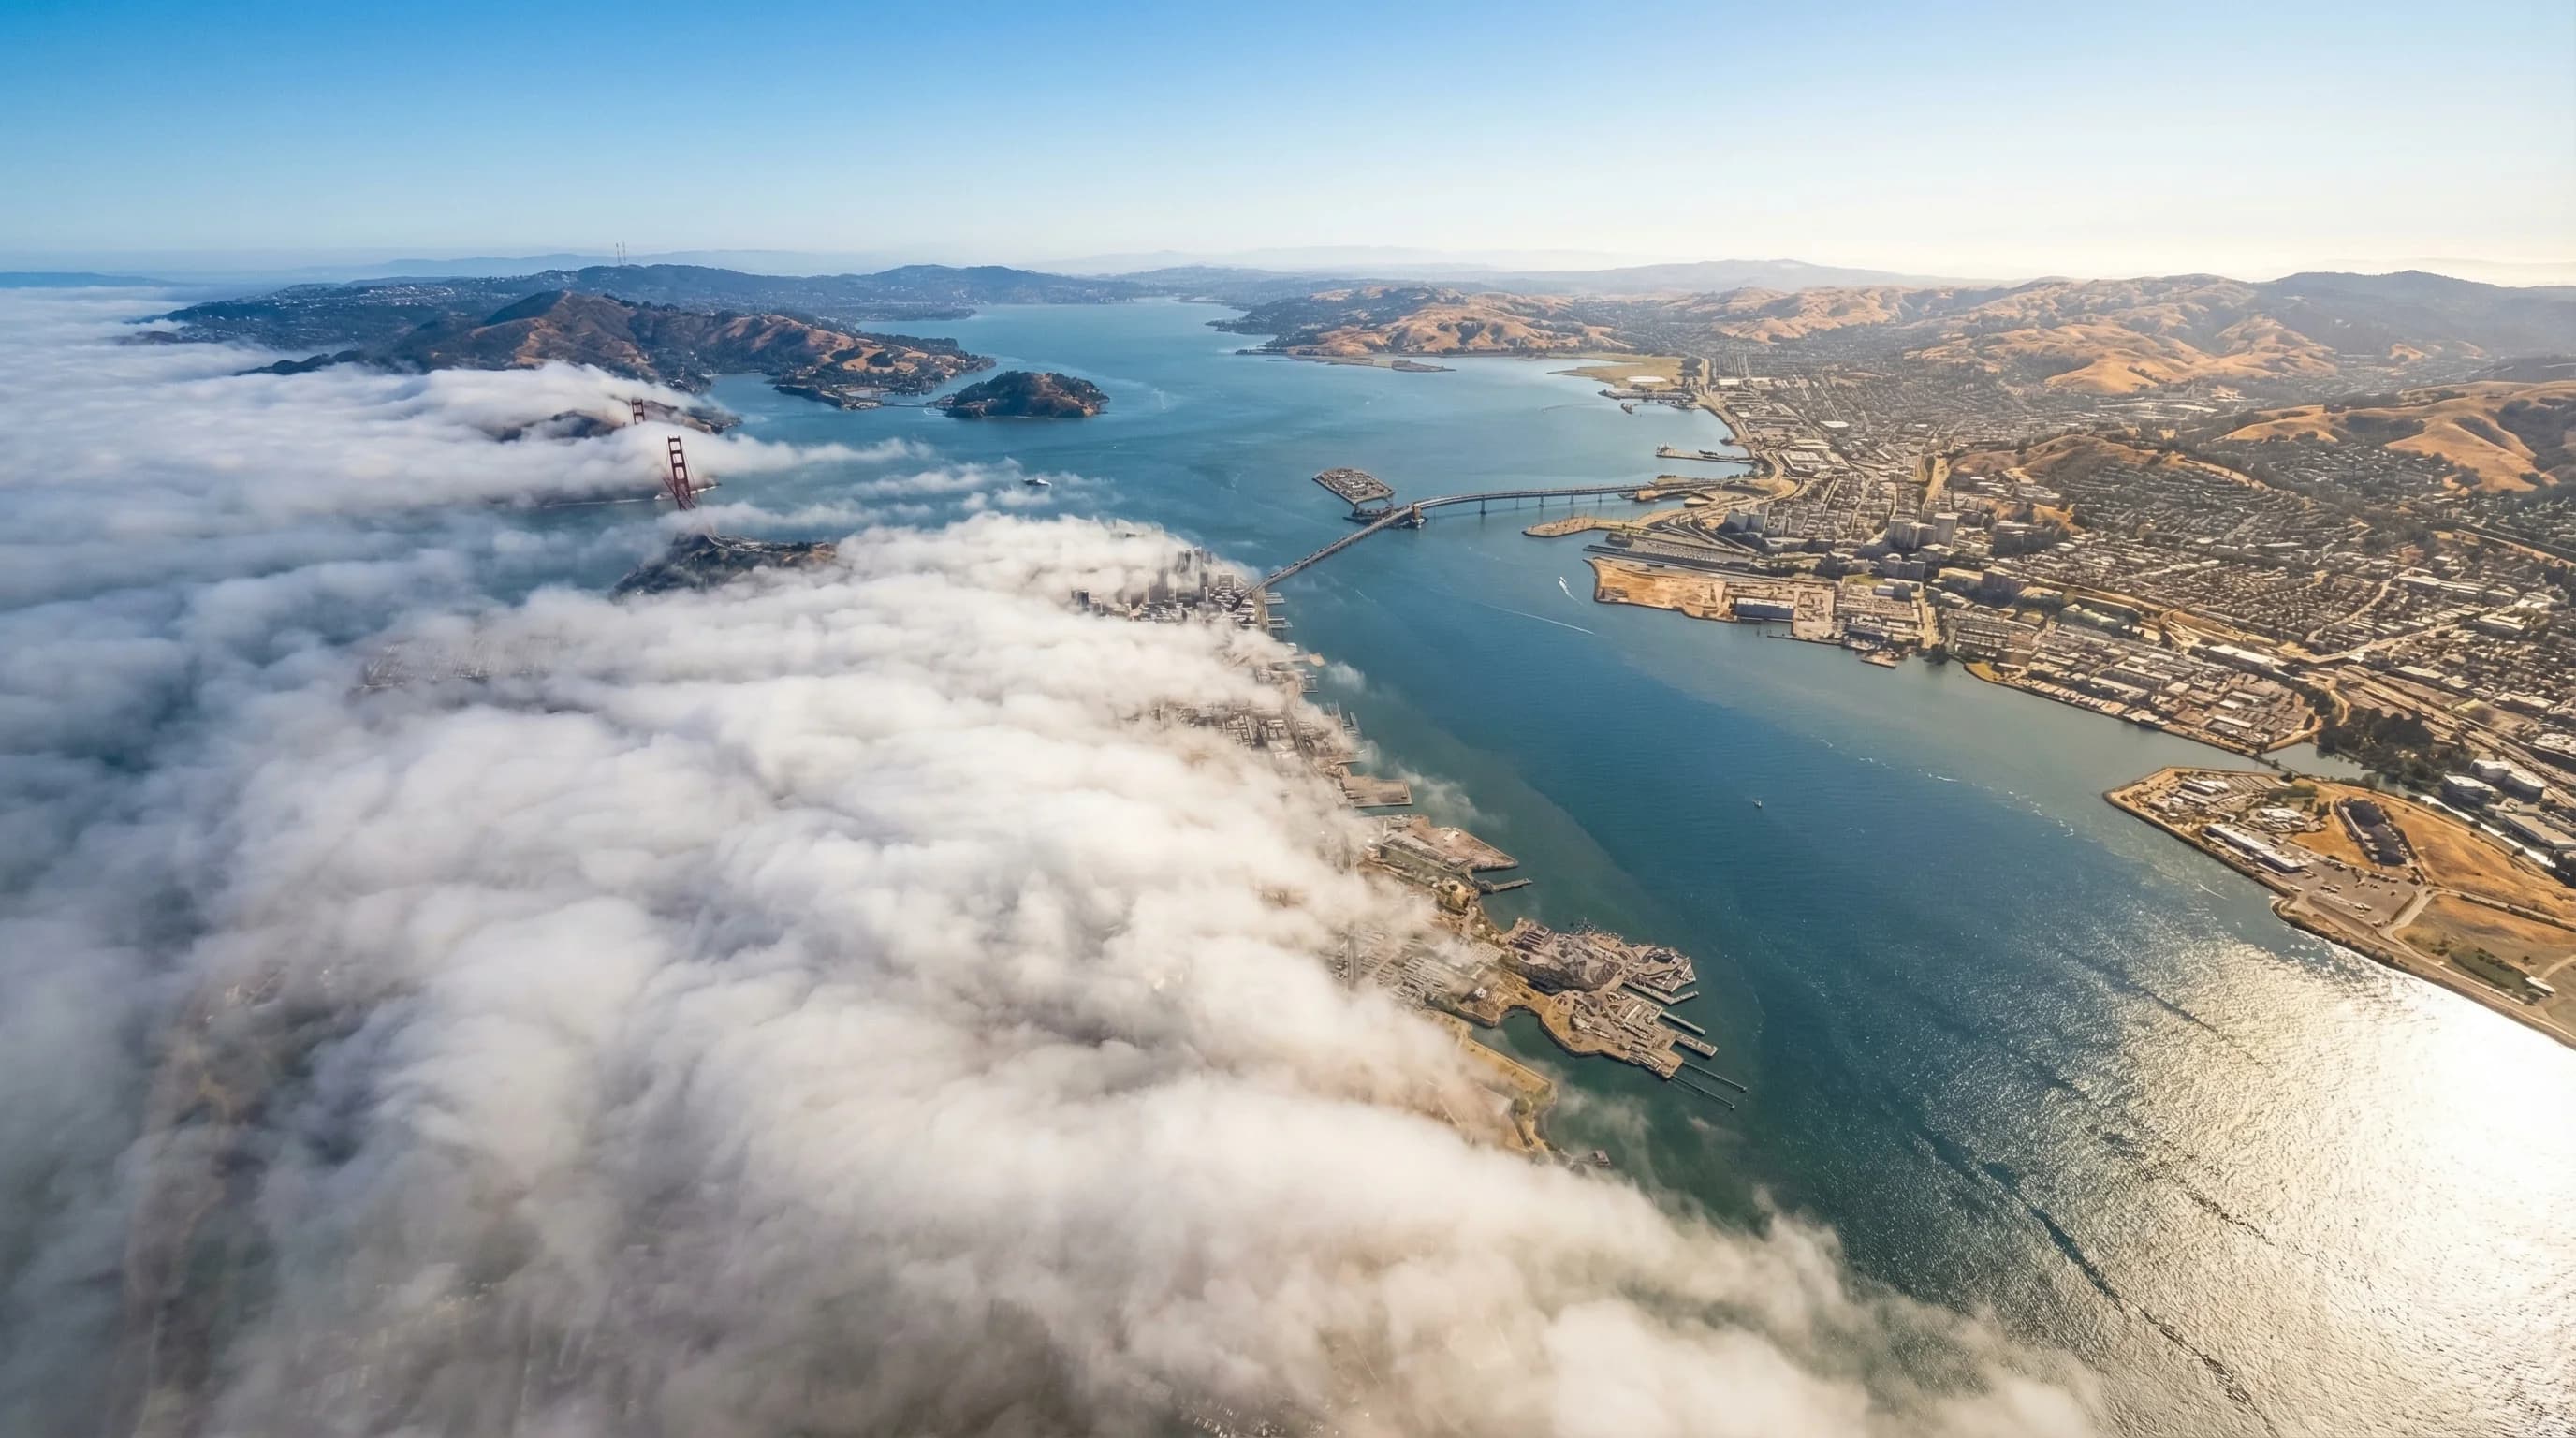
San Francisco's unique geography funnels cold ocean air directly into the city, while Oakland is shielded by the Berkeley Hills. Discover this dramatic 10-mile weather difference.
6min read →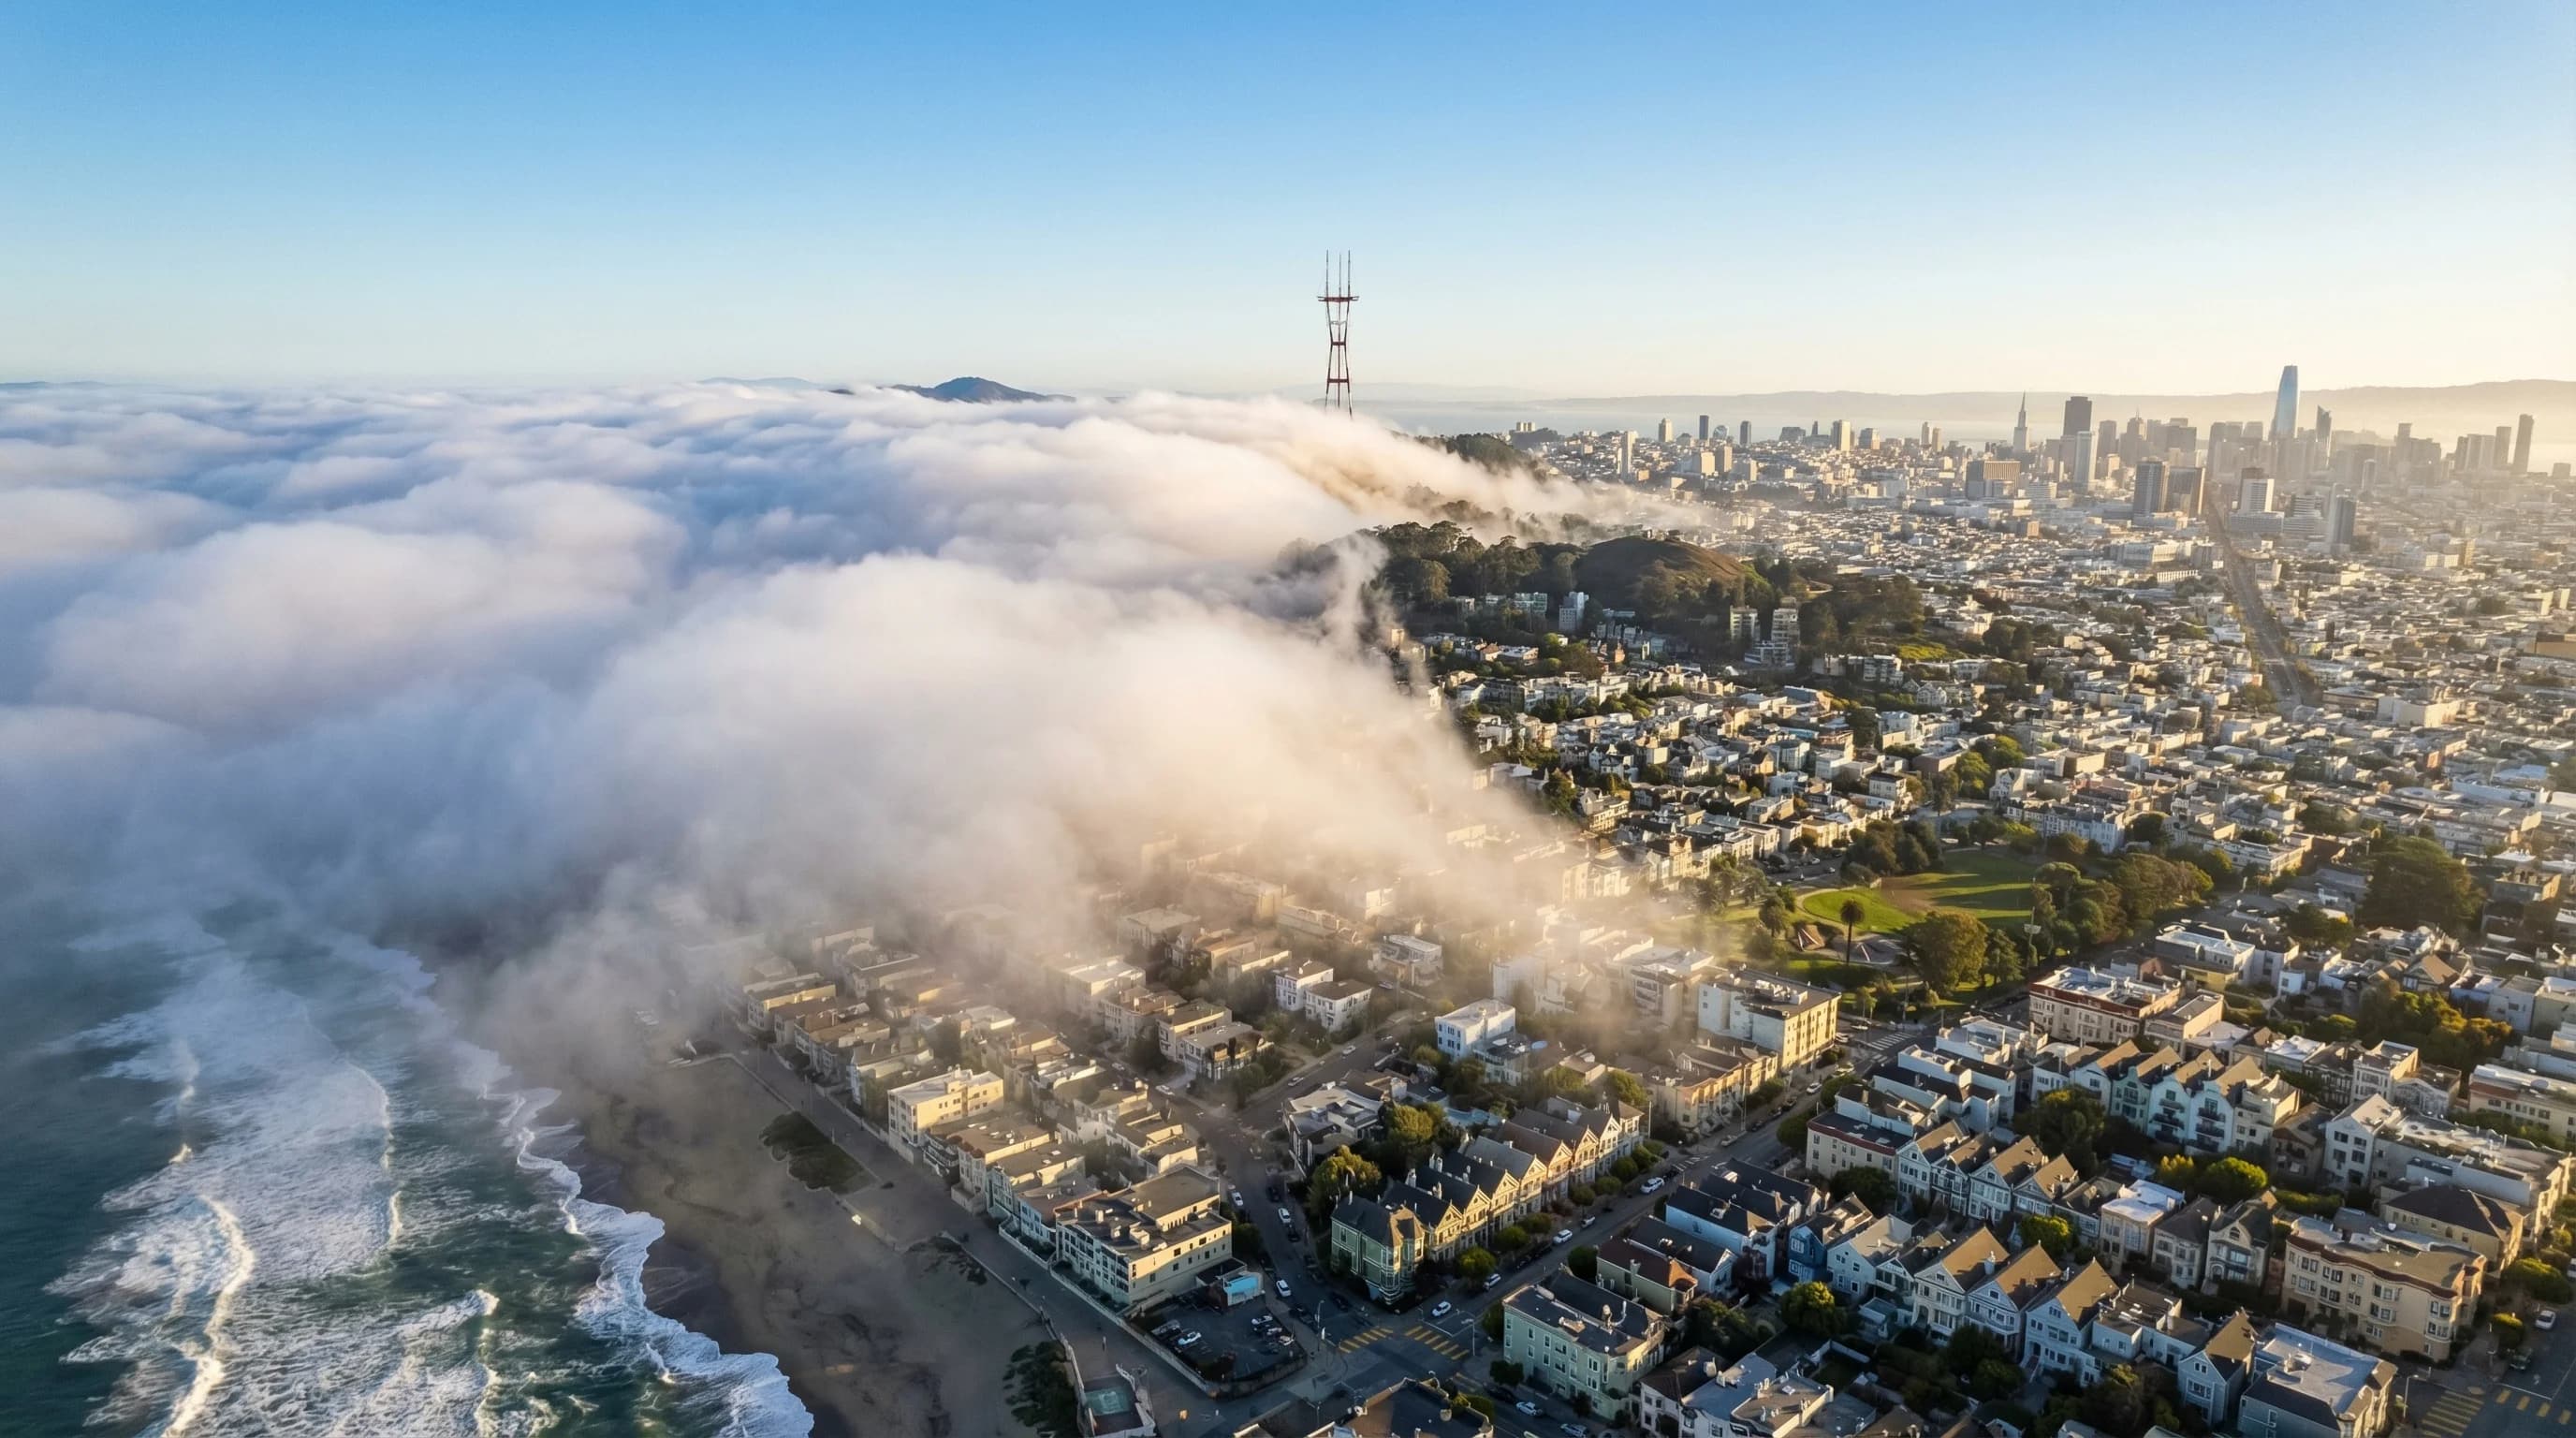
Elevation and ocean exposure determine neighborhood fog in SF. Twin Peaks sits above fog while the Sunset District is perpetually cold and gray.
6min read →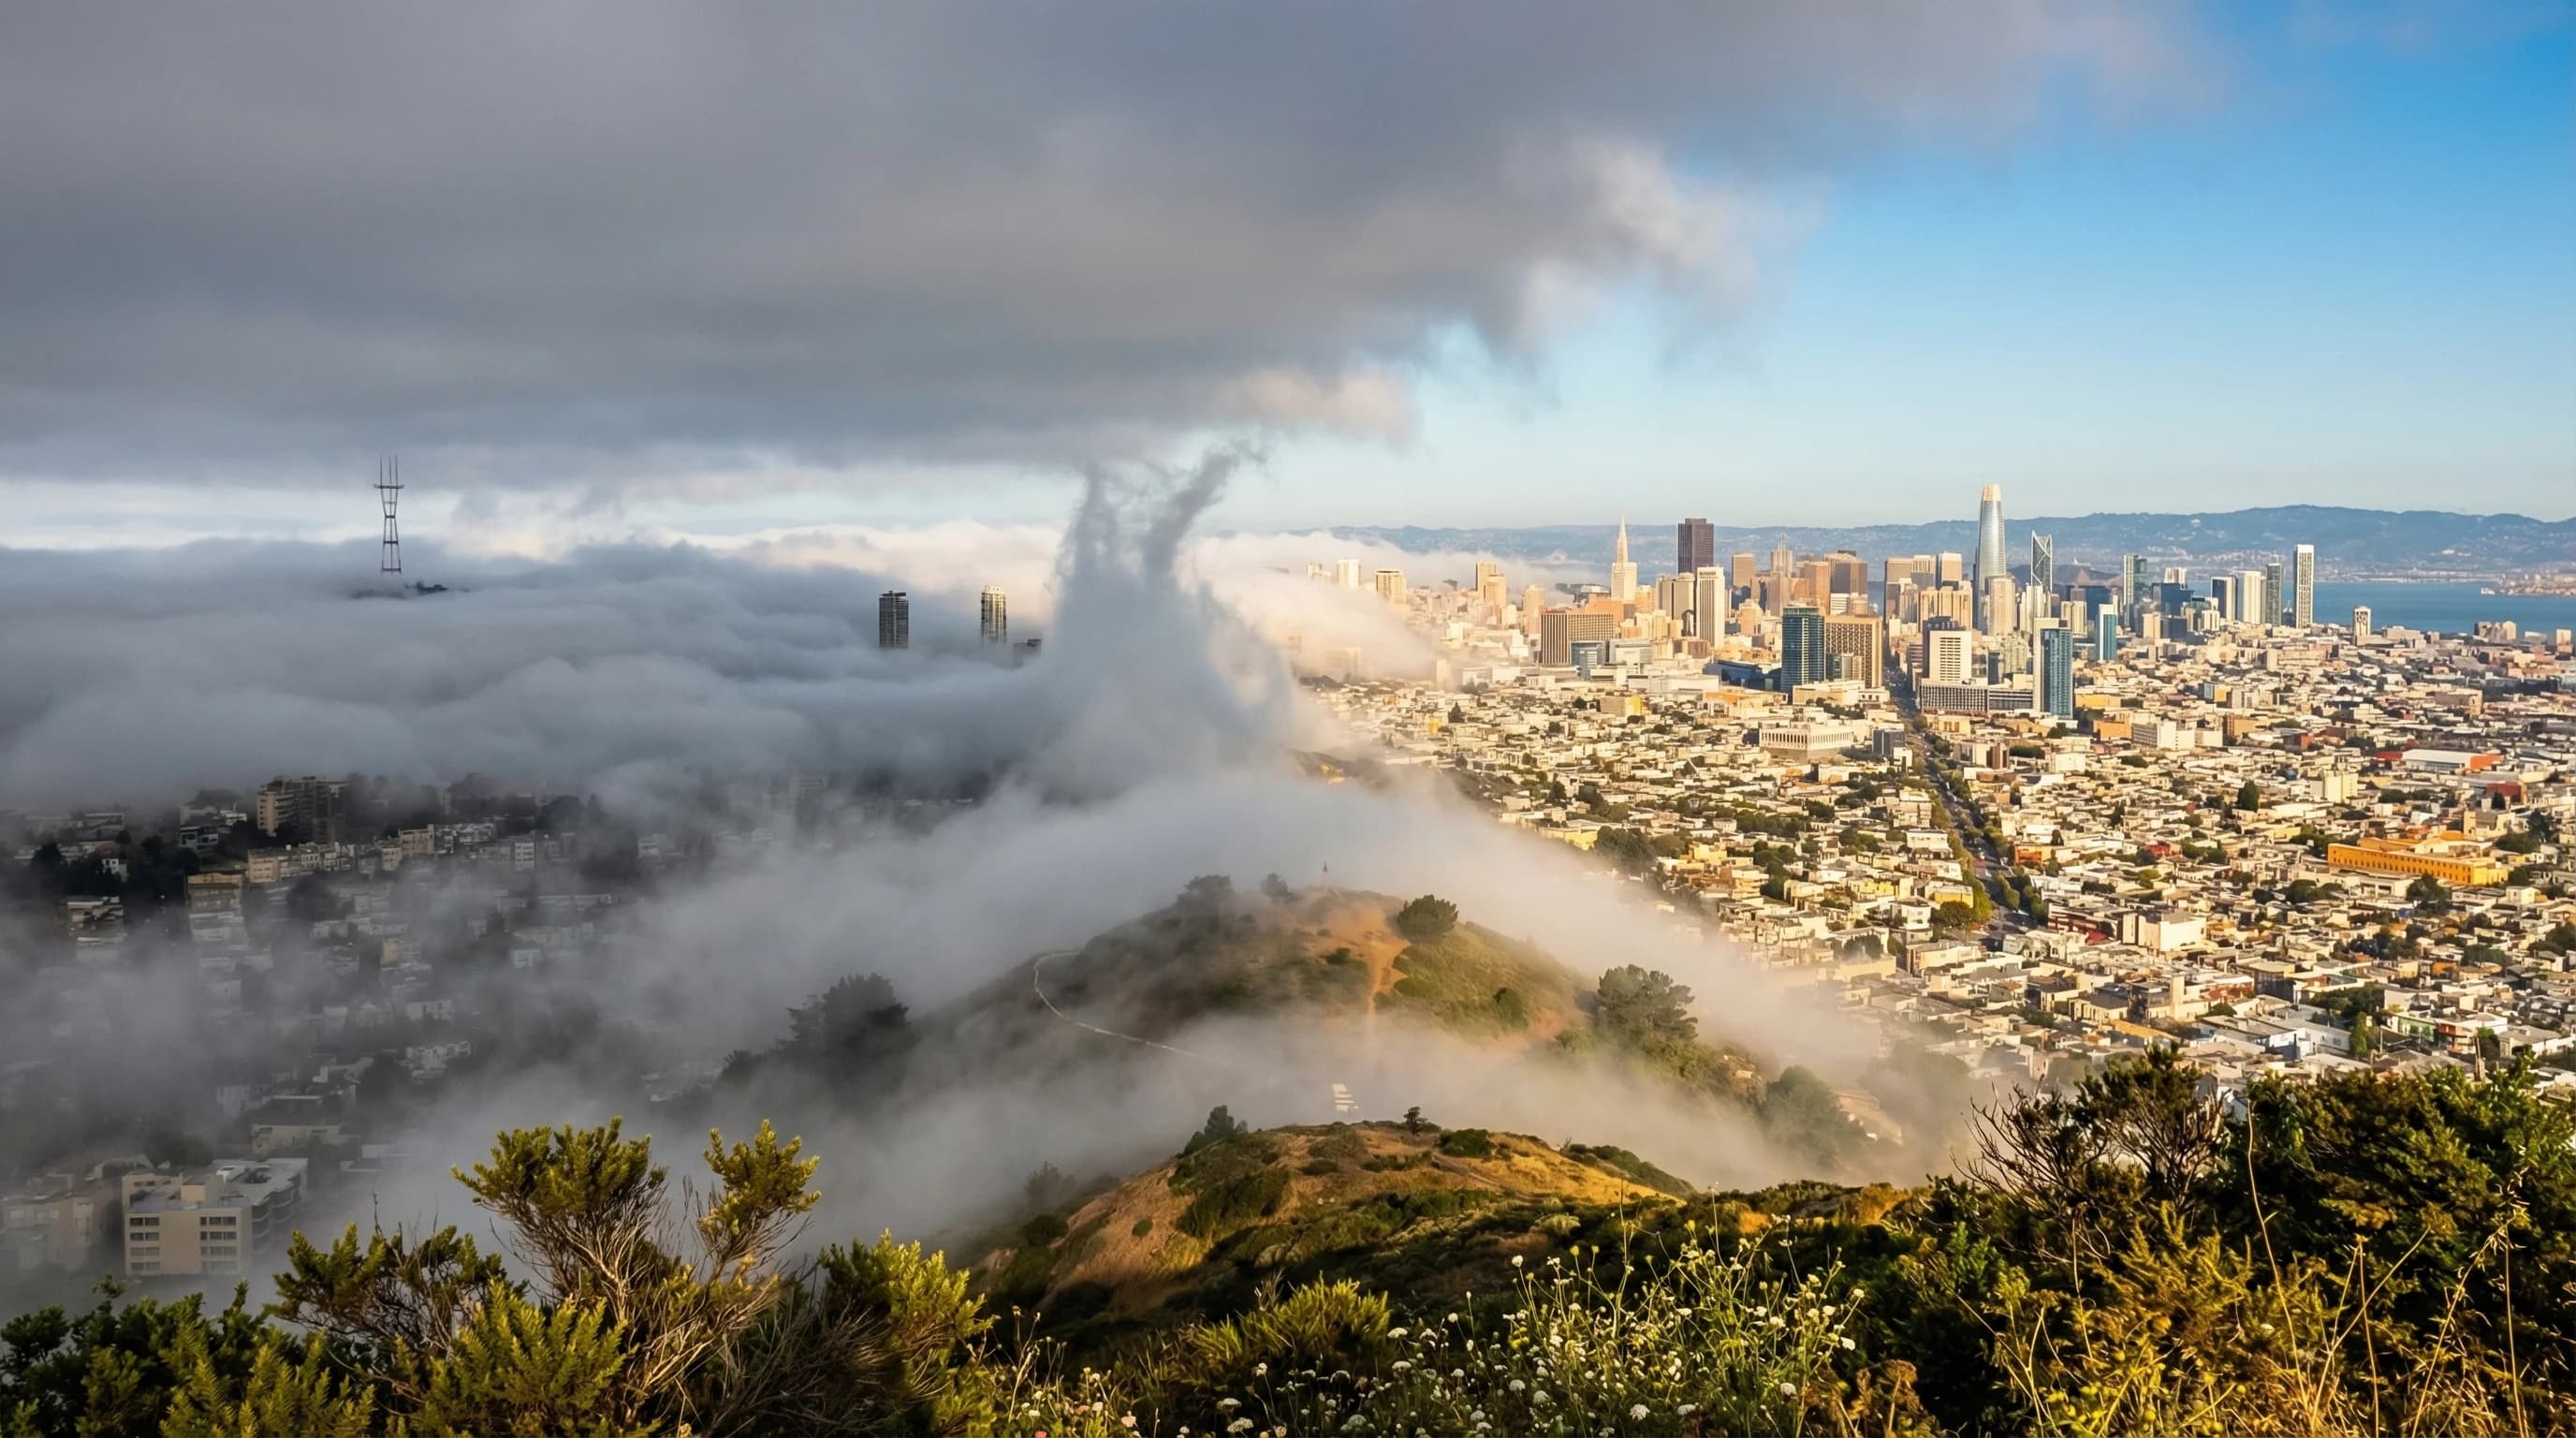
San Francisco's summer fog burns off by late morning in most neighborhoods, then returns by 4 p.m. as the Central Valley thermal low peaks. The pattern varies dramatically by neighborhood.
7min read →
The fog that blankets the Northern California coast every summer is driven by cold upwelling water, northwest winds, and inland heat. Here is how it all works.
6min read →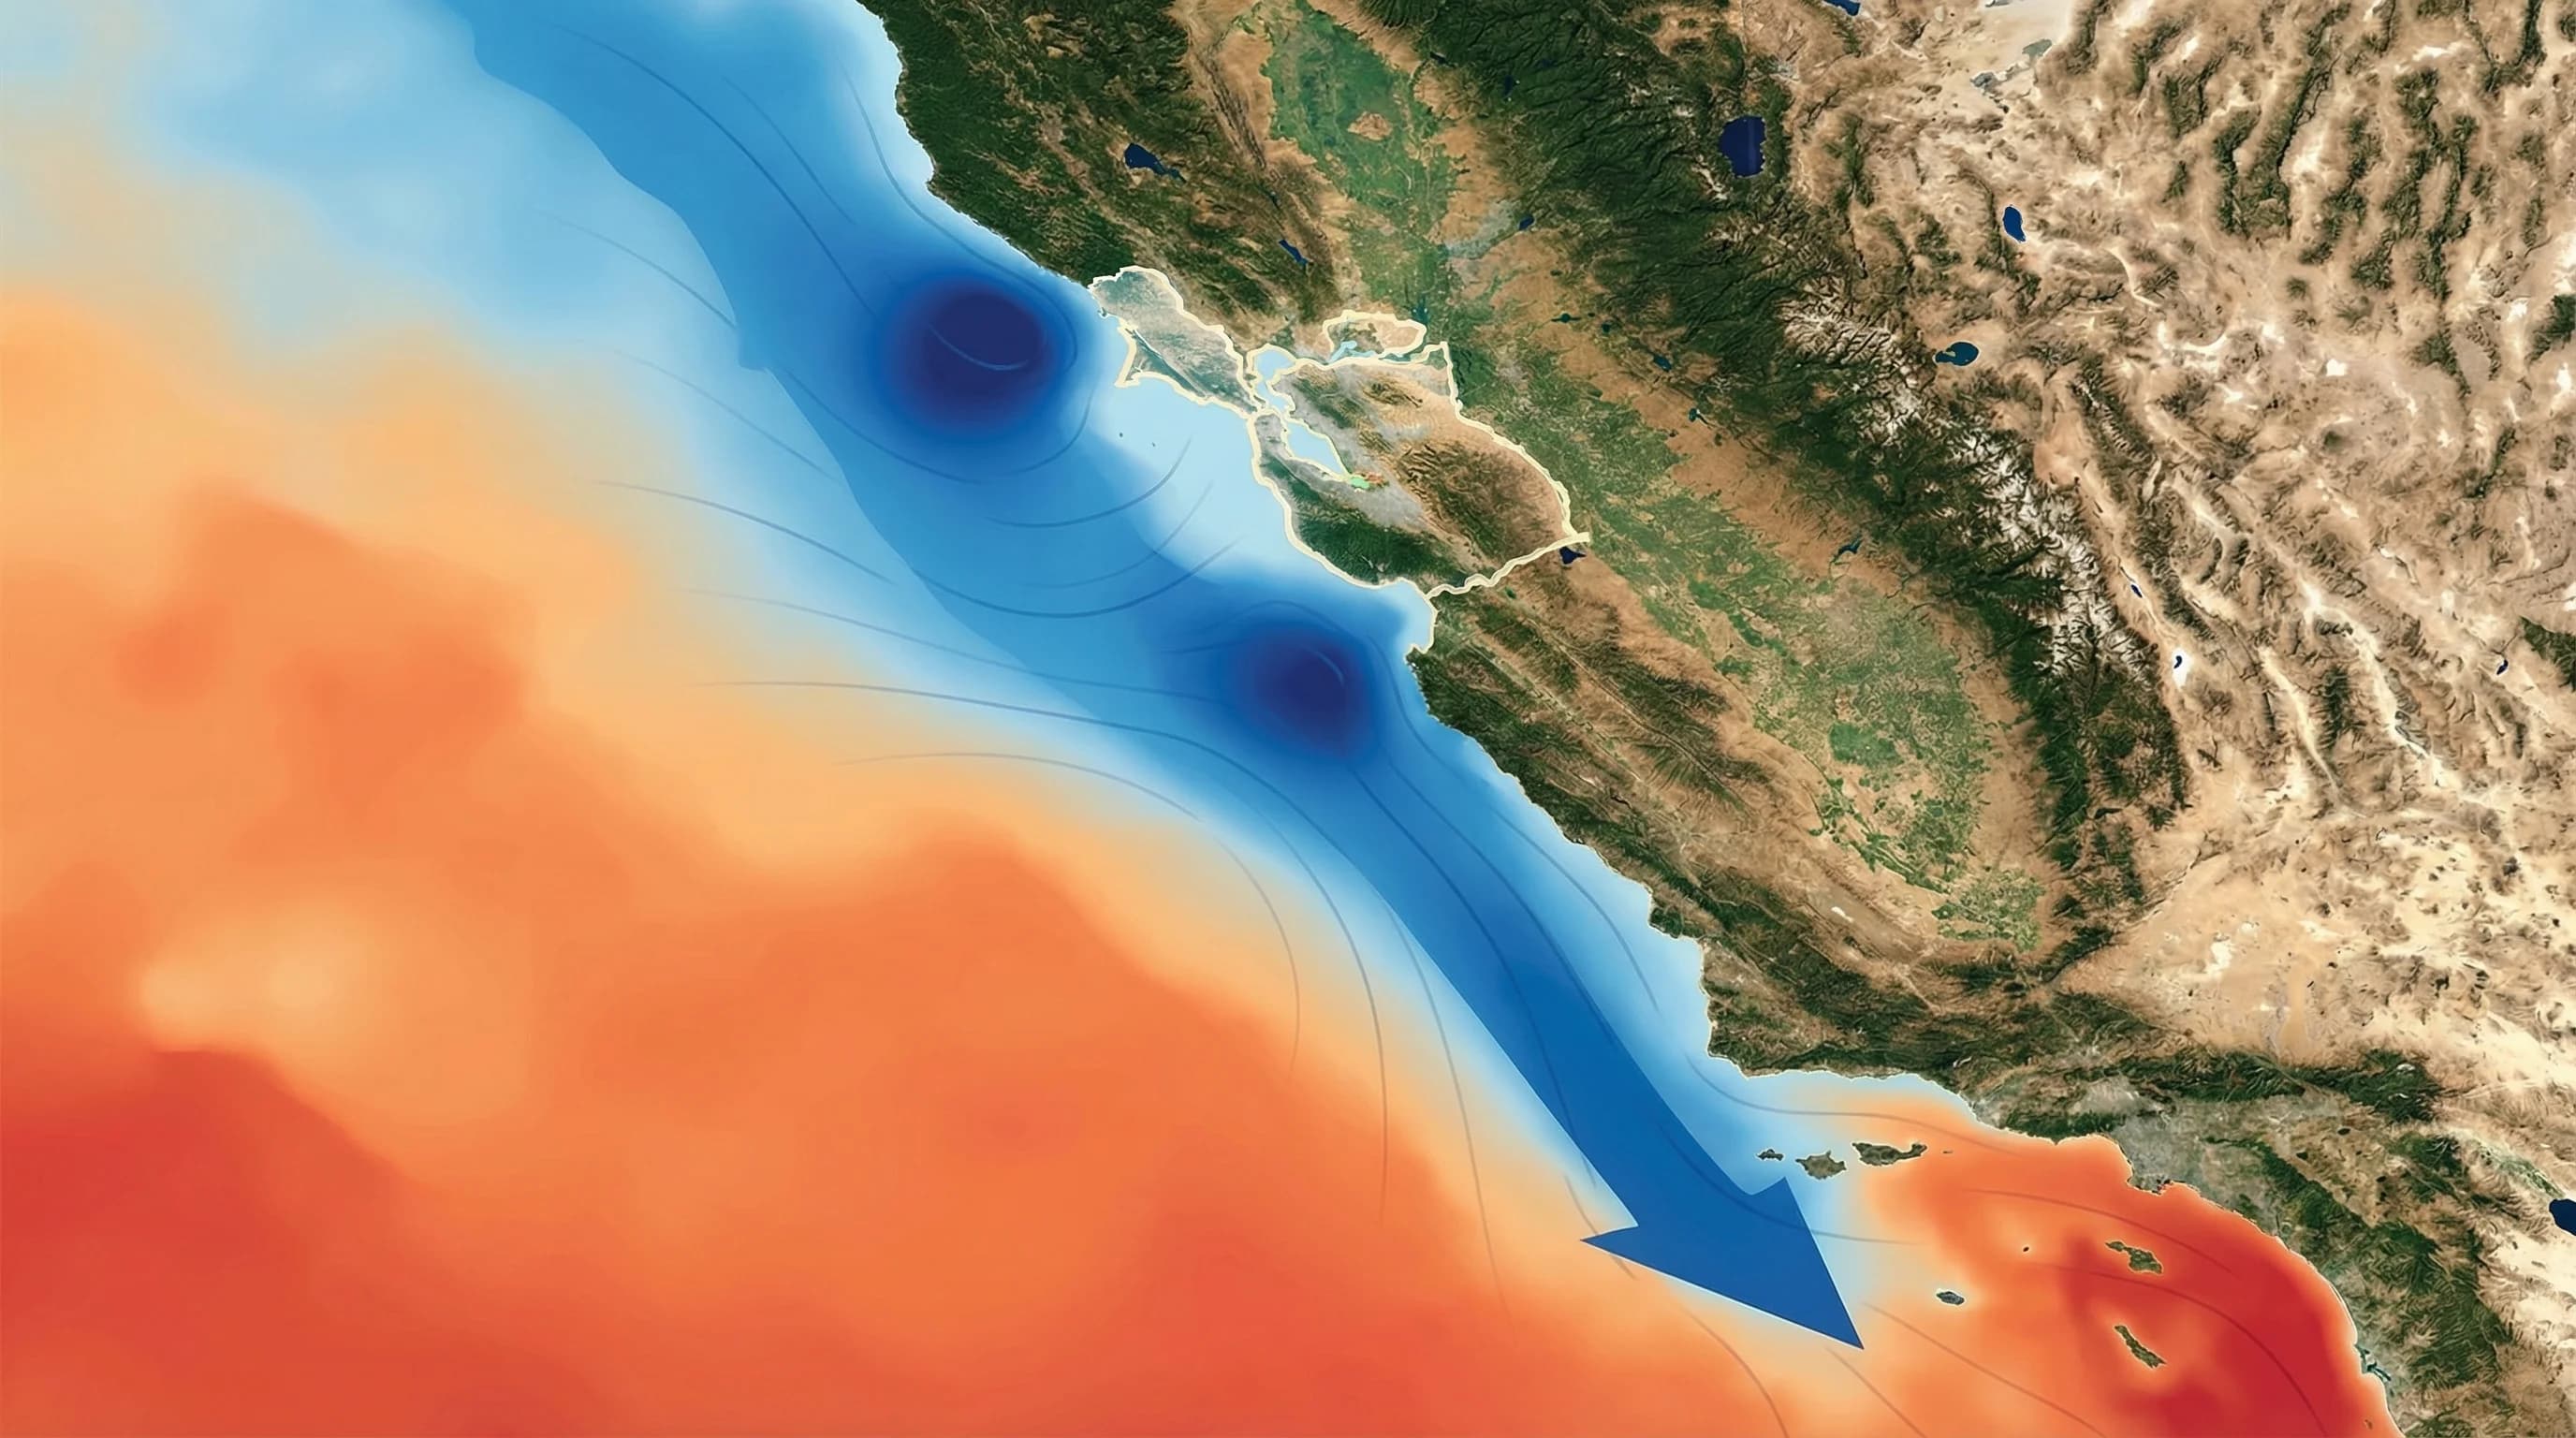
Bay Area summer fog starts with the California Current, a river of cold subarctic water that fuels coastal upwelling and chills the ocean to below 52 degrees. That cold water is the fog machine.
7min read →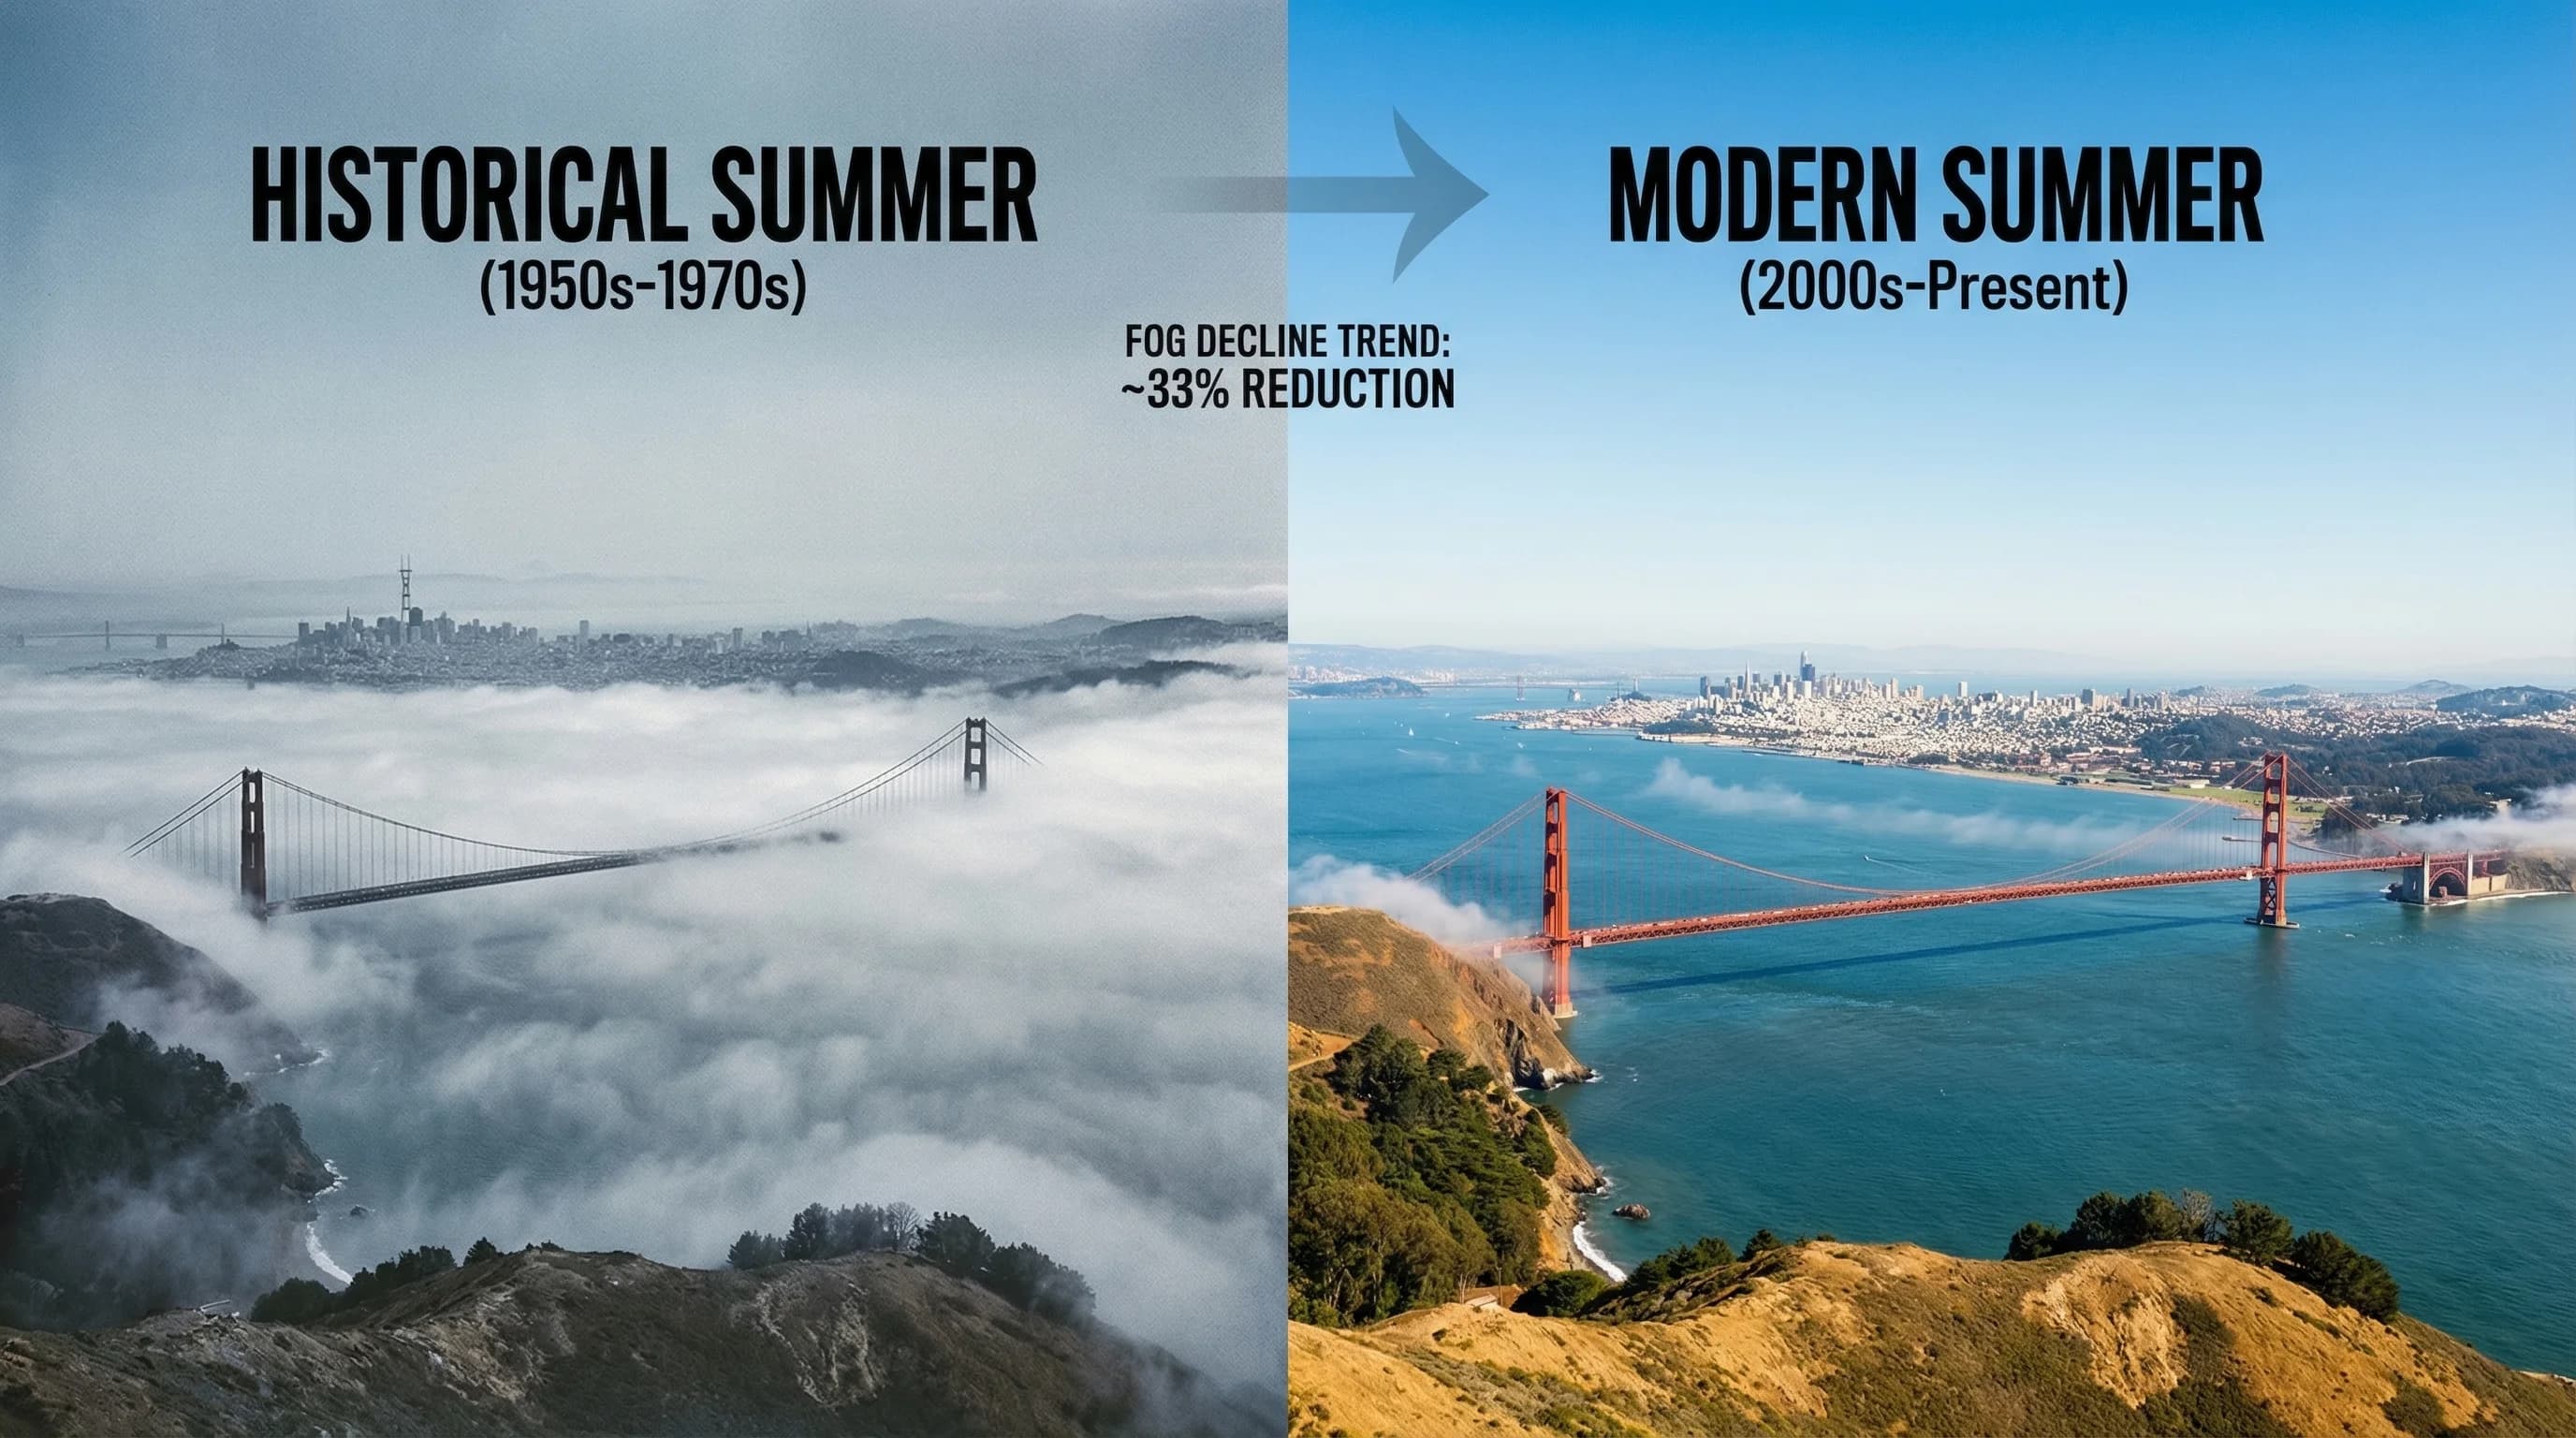
Bay Area summer fog has declined roughly 33 percent since the 1950s. The cause is not simple warming but a complex interplay of Pacific ocean temperatures, upwelling patterns, and inland heat.
8min read →
Radiation fog forms in place on clear, calm nights as the ground radiates heat into space and chills the air above it. It is the fog of Bay Area valleys, not the coast, and it burns off predictably by mid-morning.
6min read →
Advection fog forms over the cold Pacific Ocean and is carried inland by wind. It is the reason San Francisco summers are gray and cool while inland cities bake. Understanding it makes Bay Area fog patterns entirely predictable.
6min read →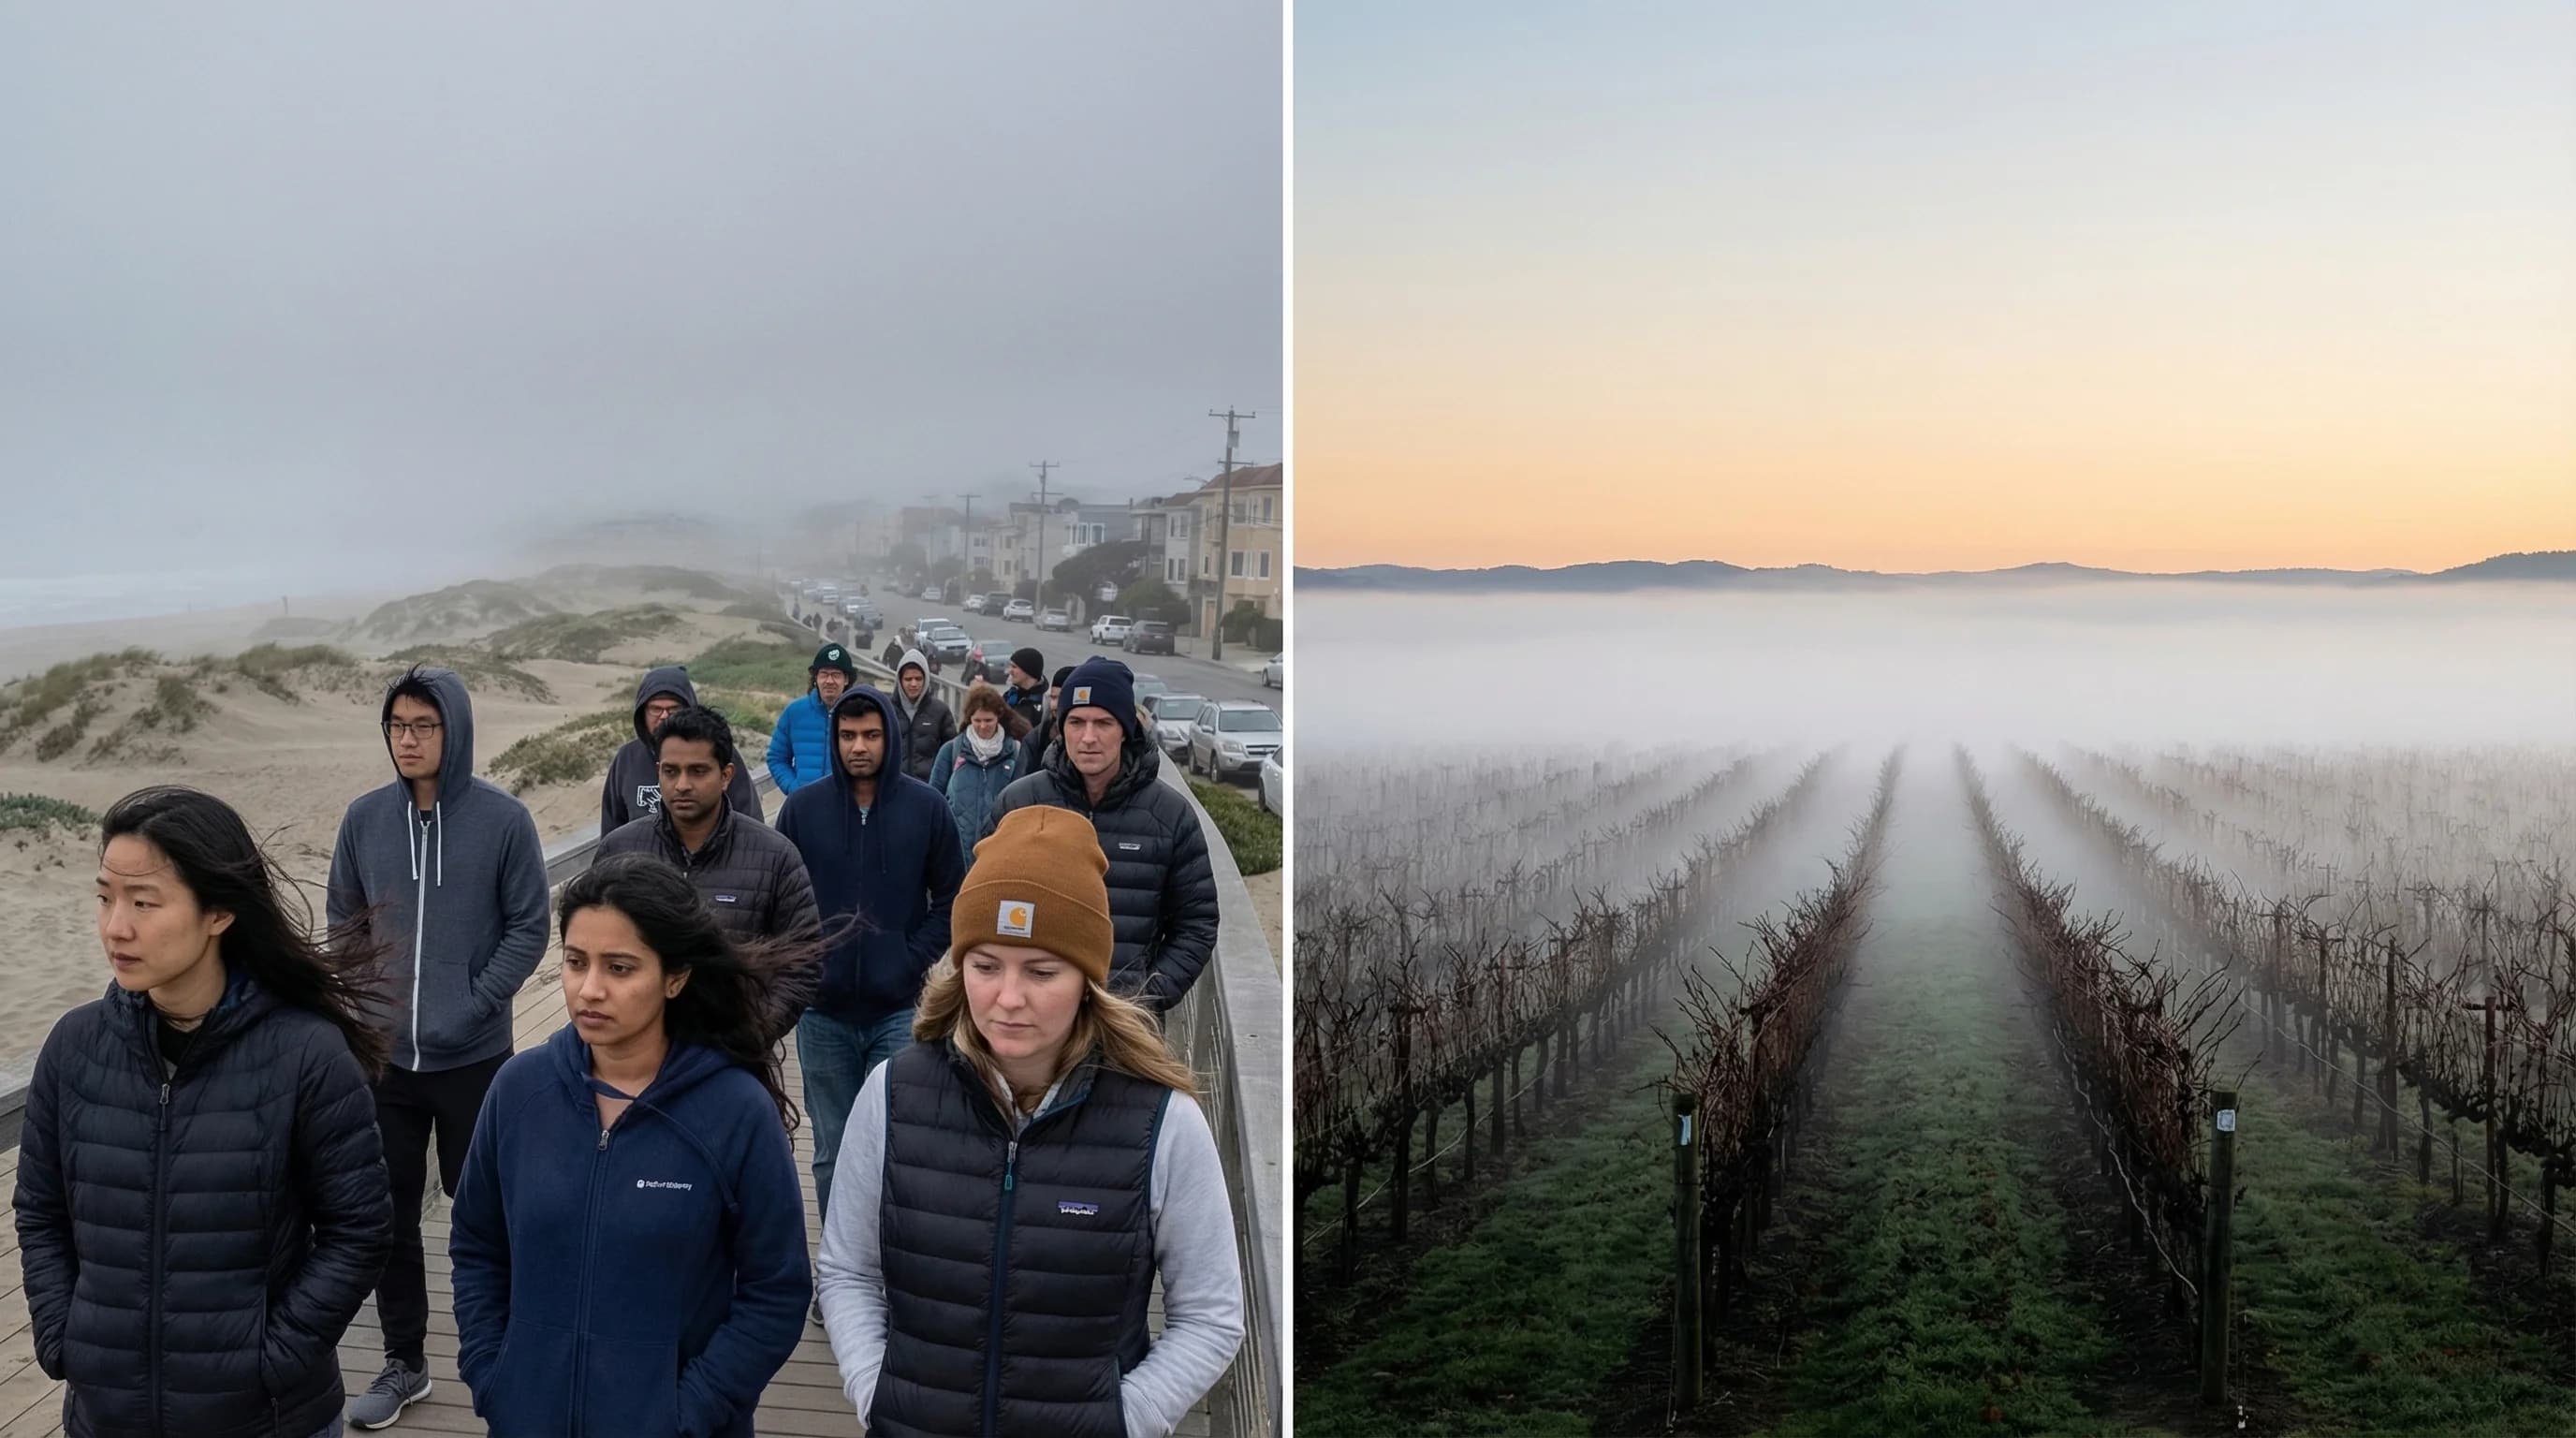
The Bay Area runs two fog systems simultaneously. Coastal fog rolls in from the Pacific on summer afternoons. Inland fog forms in valley floors on winter nights. They look similar but behave completely differently.
7min read →
Freezing fog coats surfaces in rime ice when fog and below-freezing temperatures combine. It is rare in the mild Bay Area, but it does occur at high elevations and in the coldest inland valleys, and it creates invisible road hazards.
5min read →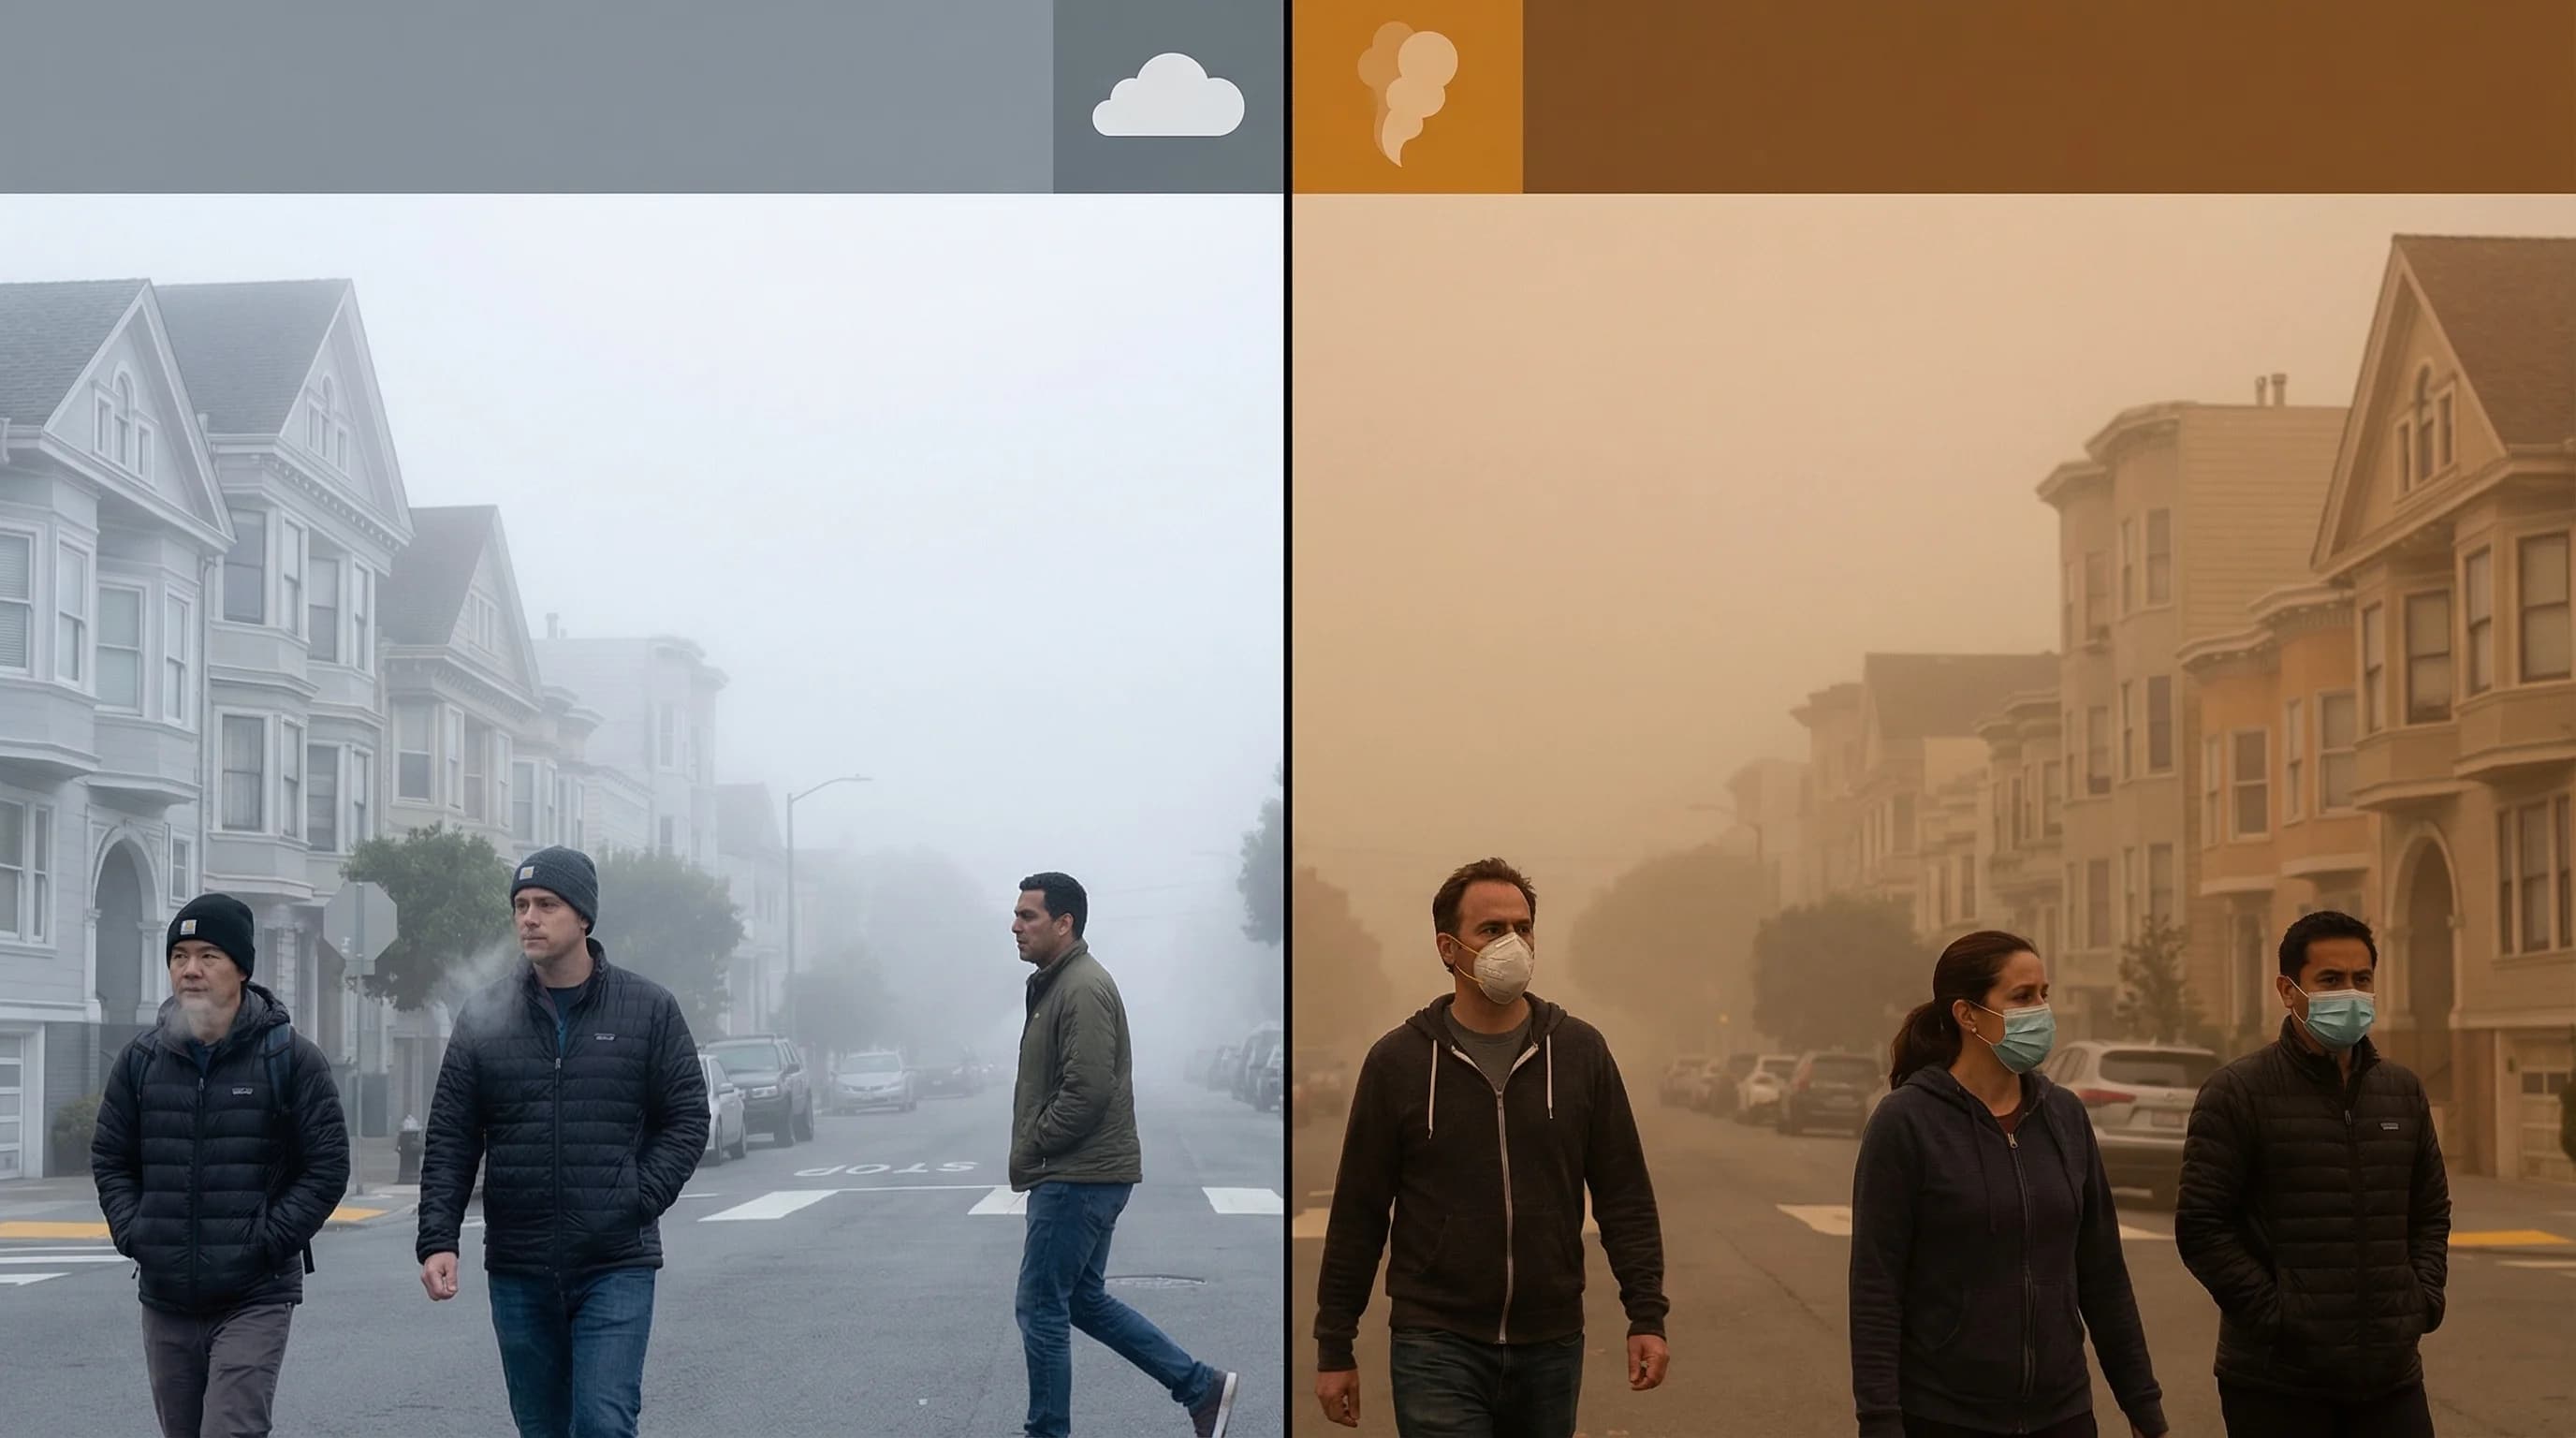
Fog is water droplets at ground level, completely harmless to breathe. Haze is smoke, dust, or pollution particles, which can be a serious health hazard. Both reduce visibility and make the sky look gray, but the right response is very different.
6min read →
Morning fog in the Bay Area is either the tail of the summer marine layer or overnight radiation fog in the inland valleys. The type determines when it clears, and they behave very differently.
6min read →
Steam fog rises off the Bay and inland reservoirs when cold winter air flows over warmer water. The "steaming" effect is caused by rapid evaporation and immediate condensation, the opposite mechanism from the marine layer.
5min read →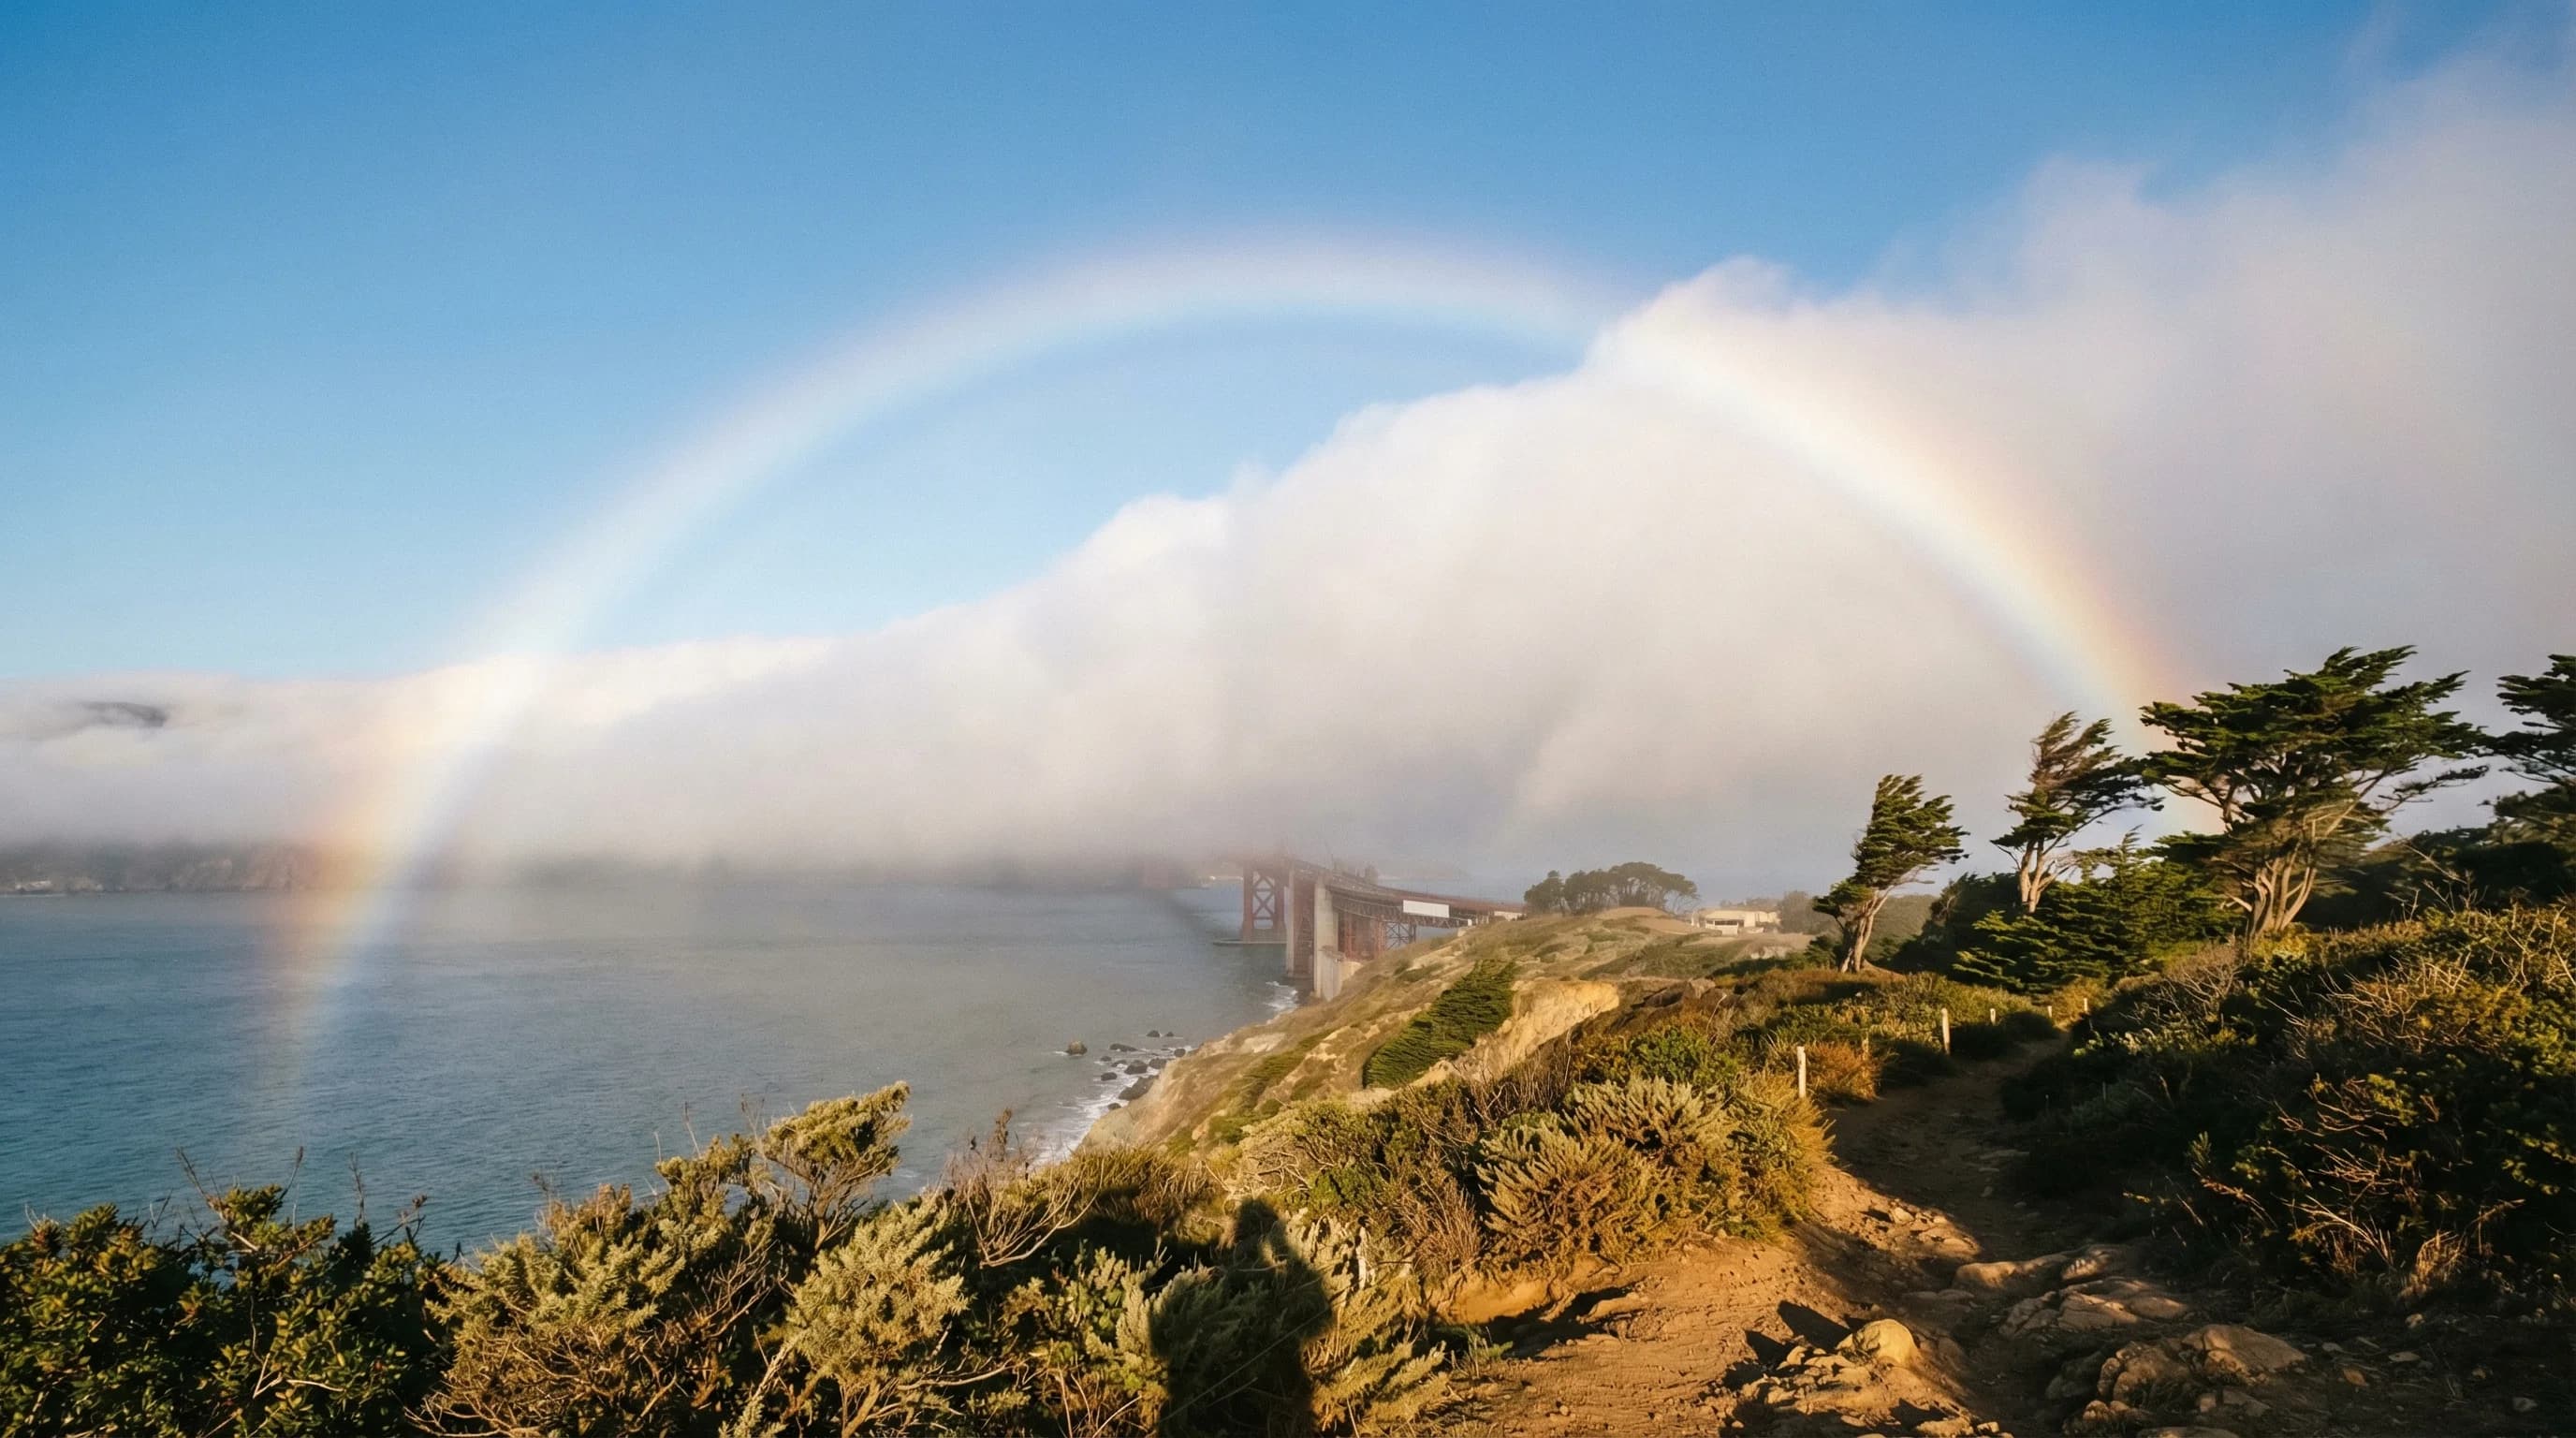
A fogbow is a rainbow made in fog instead of rain. Fog droplets are too small to produce vivid colors, so the arc appears white or ghostly pale. The Bay Area's marine layer creates some of the best fogbow conditions in North America.
7min read →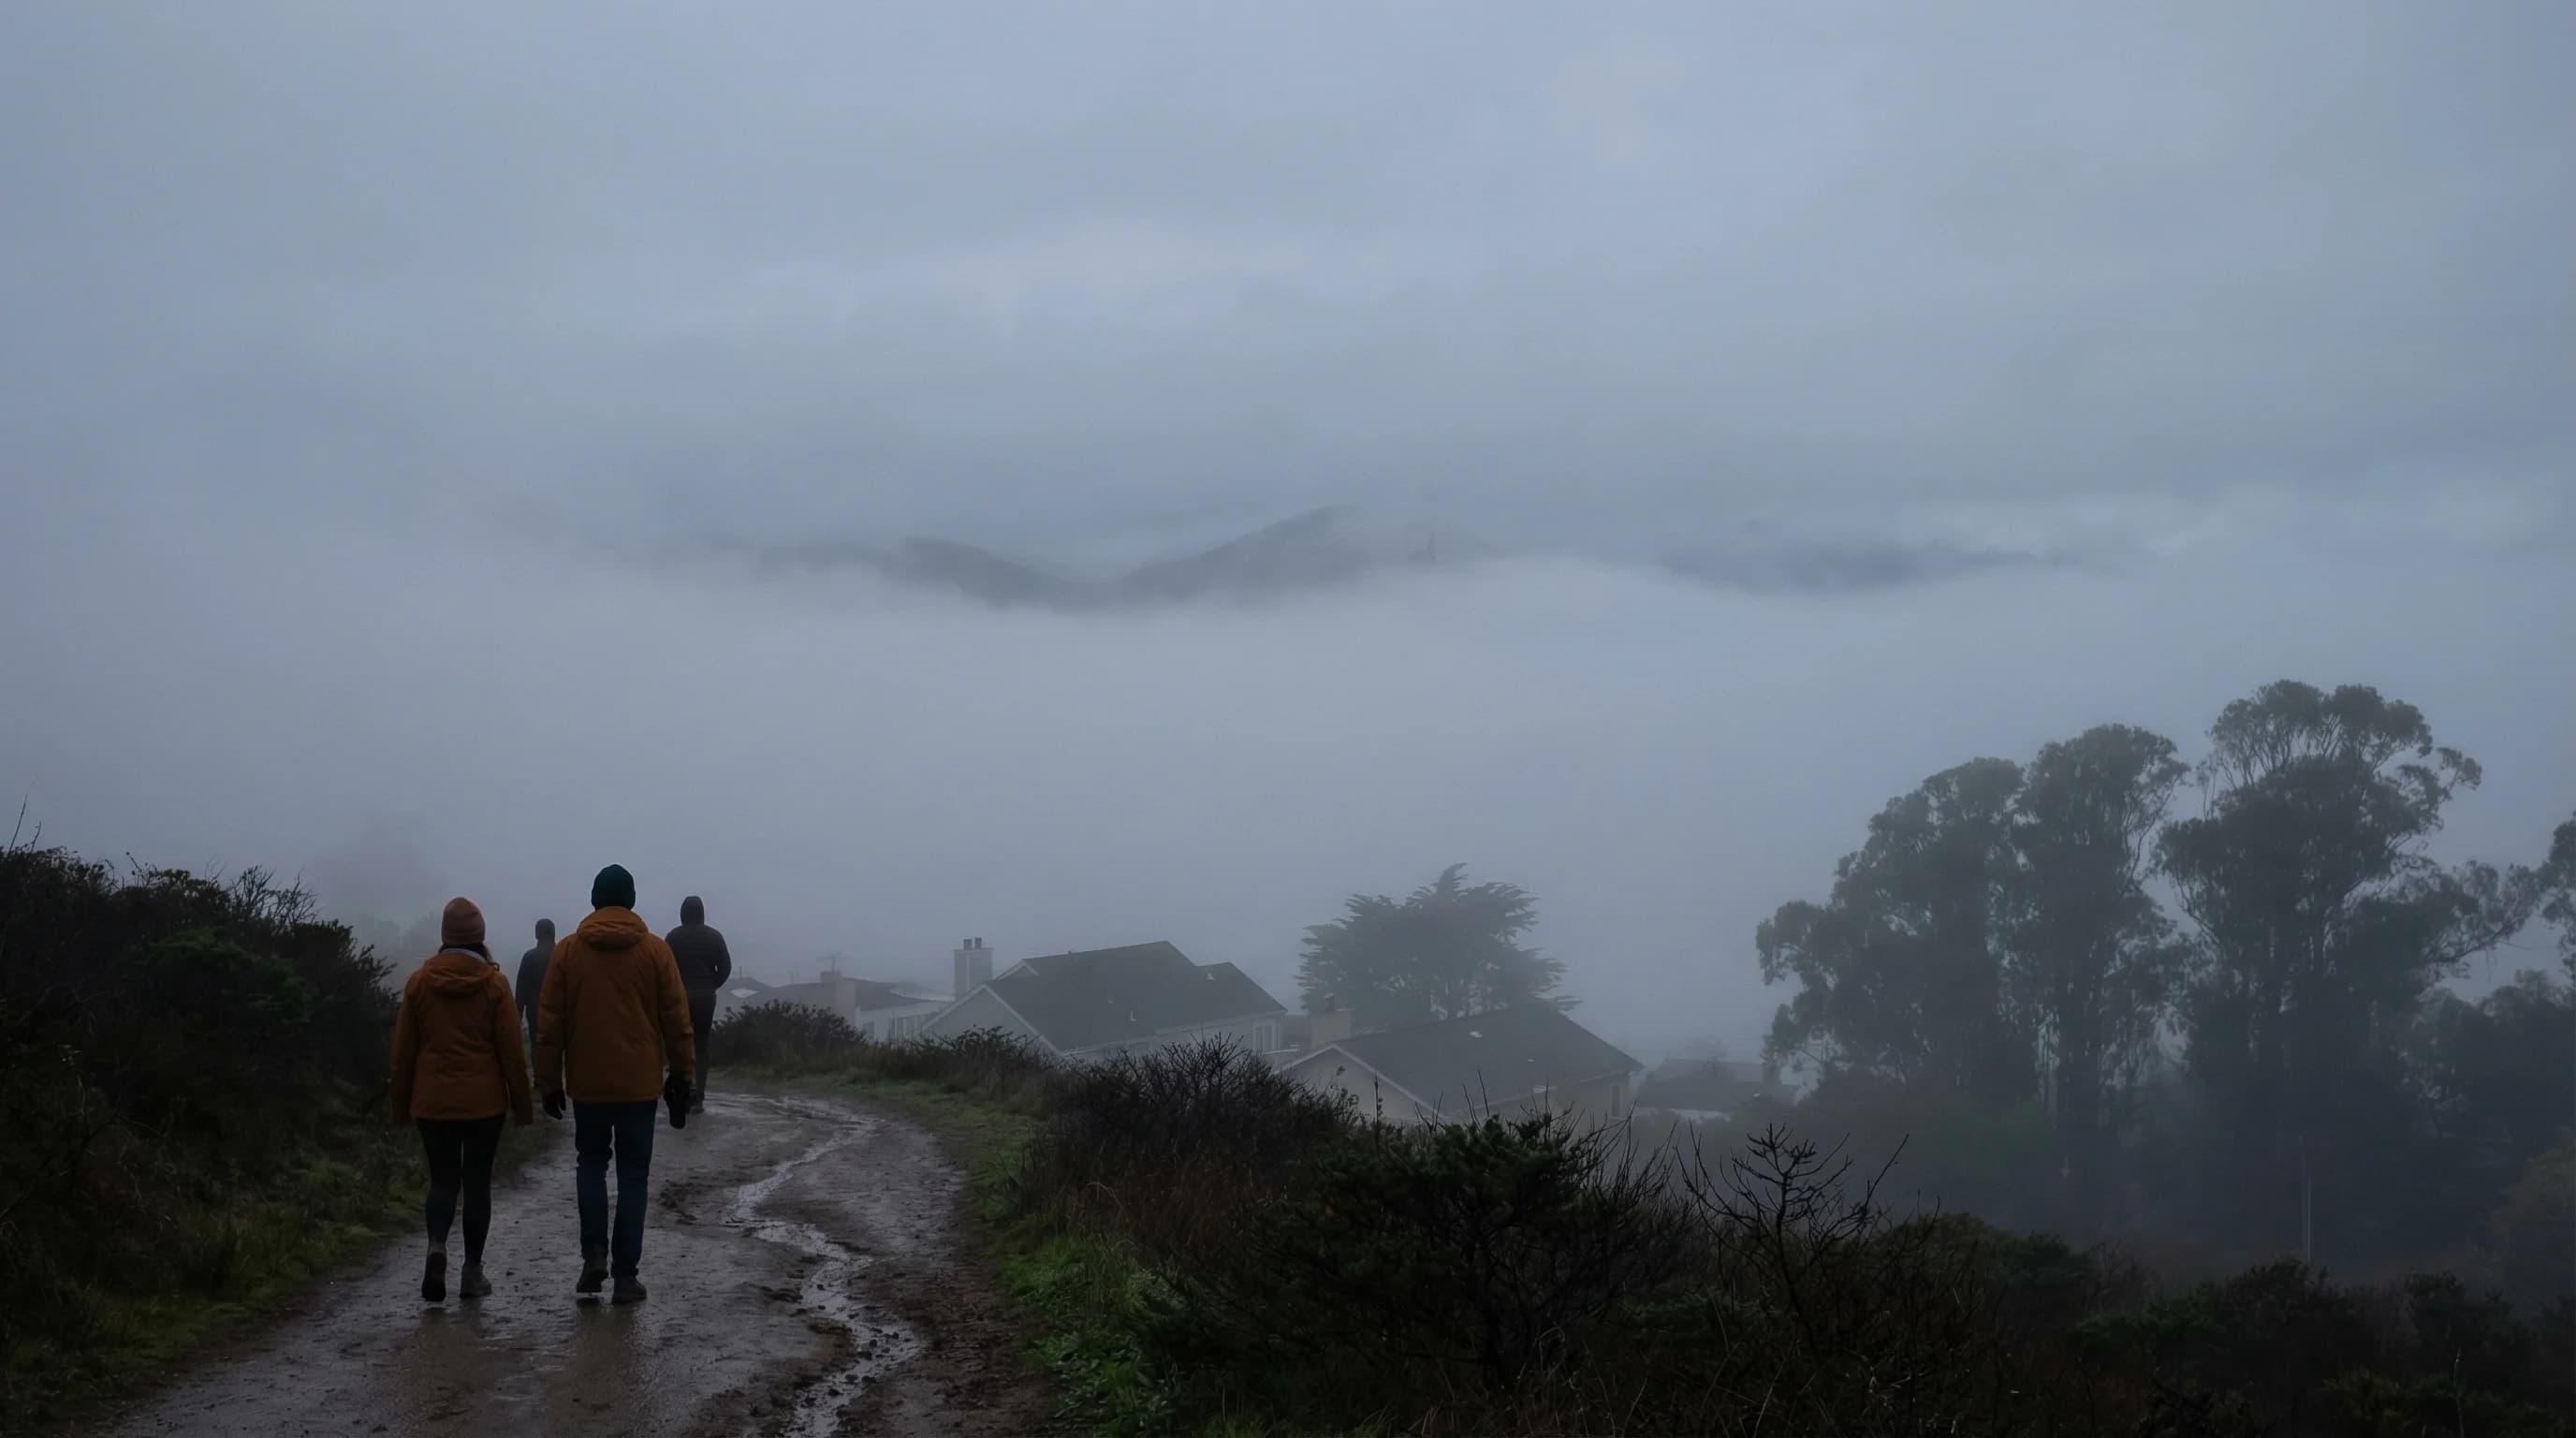
The only official difference between fog and mist is visibility: below 1 kilometer is fog, above is mist. The Bay Area's marine layer almost always qualifies as fog. Here's how all the related terms compare.
5min read →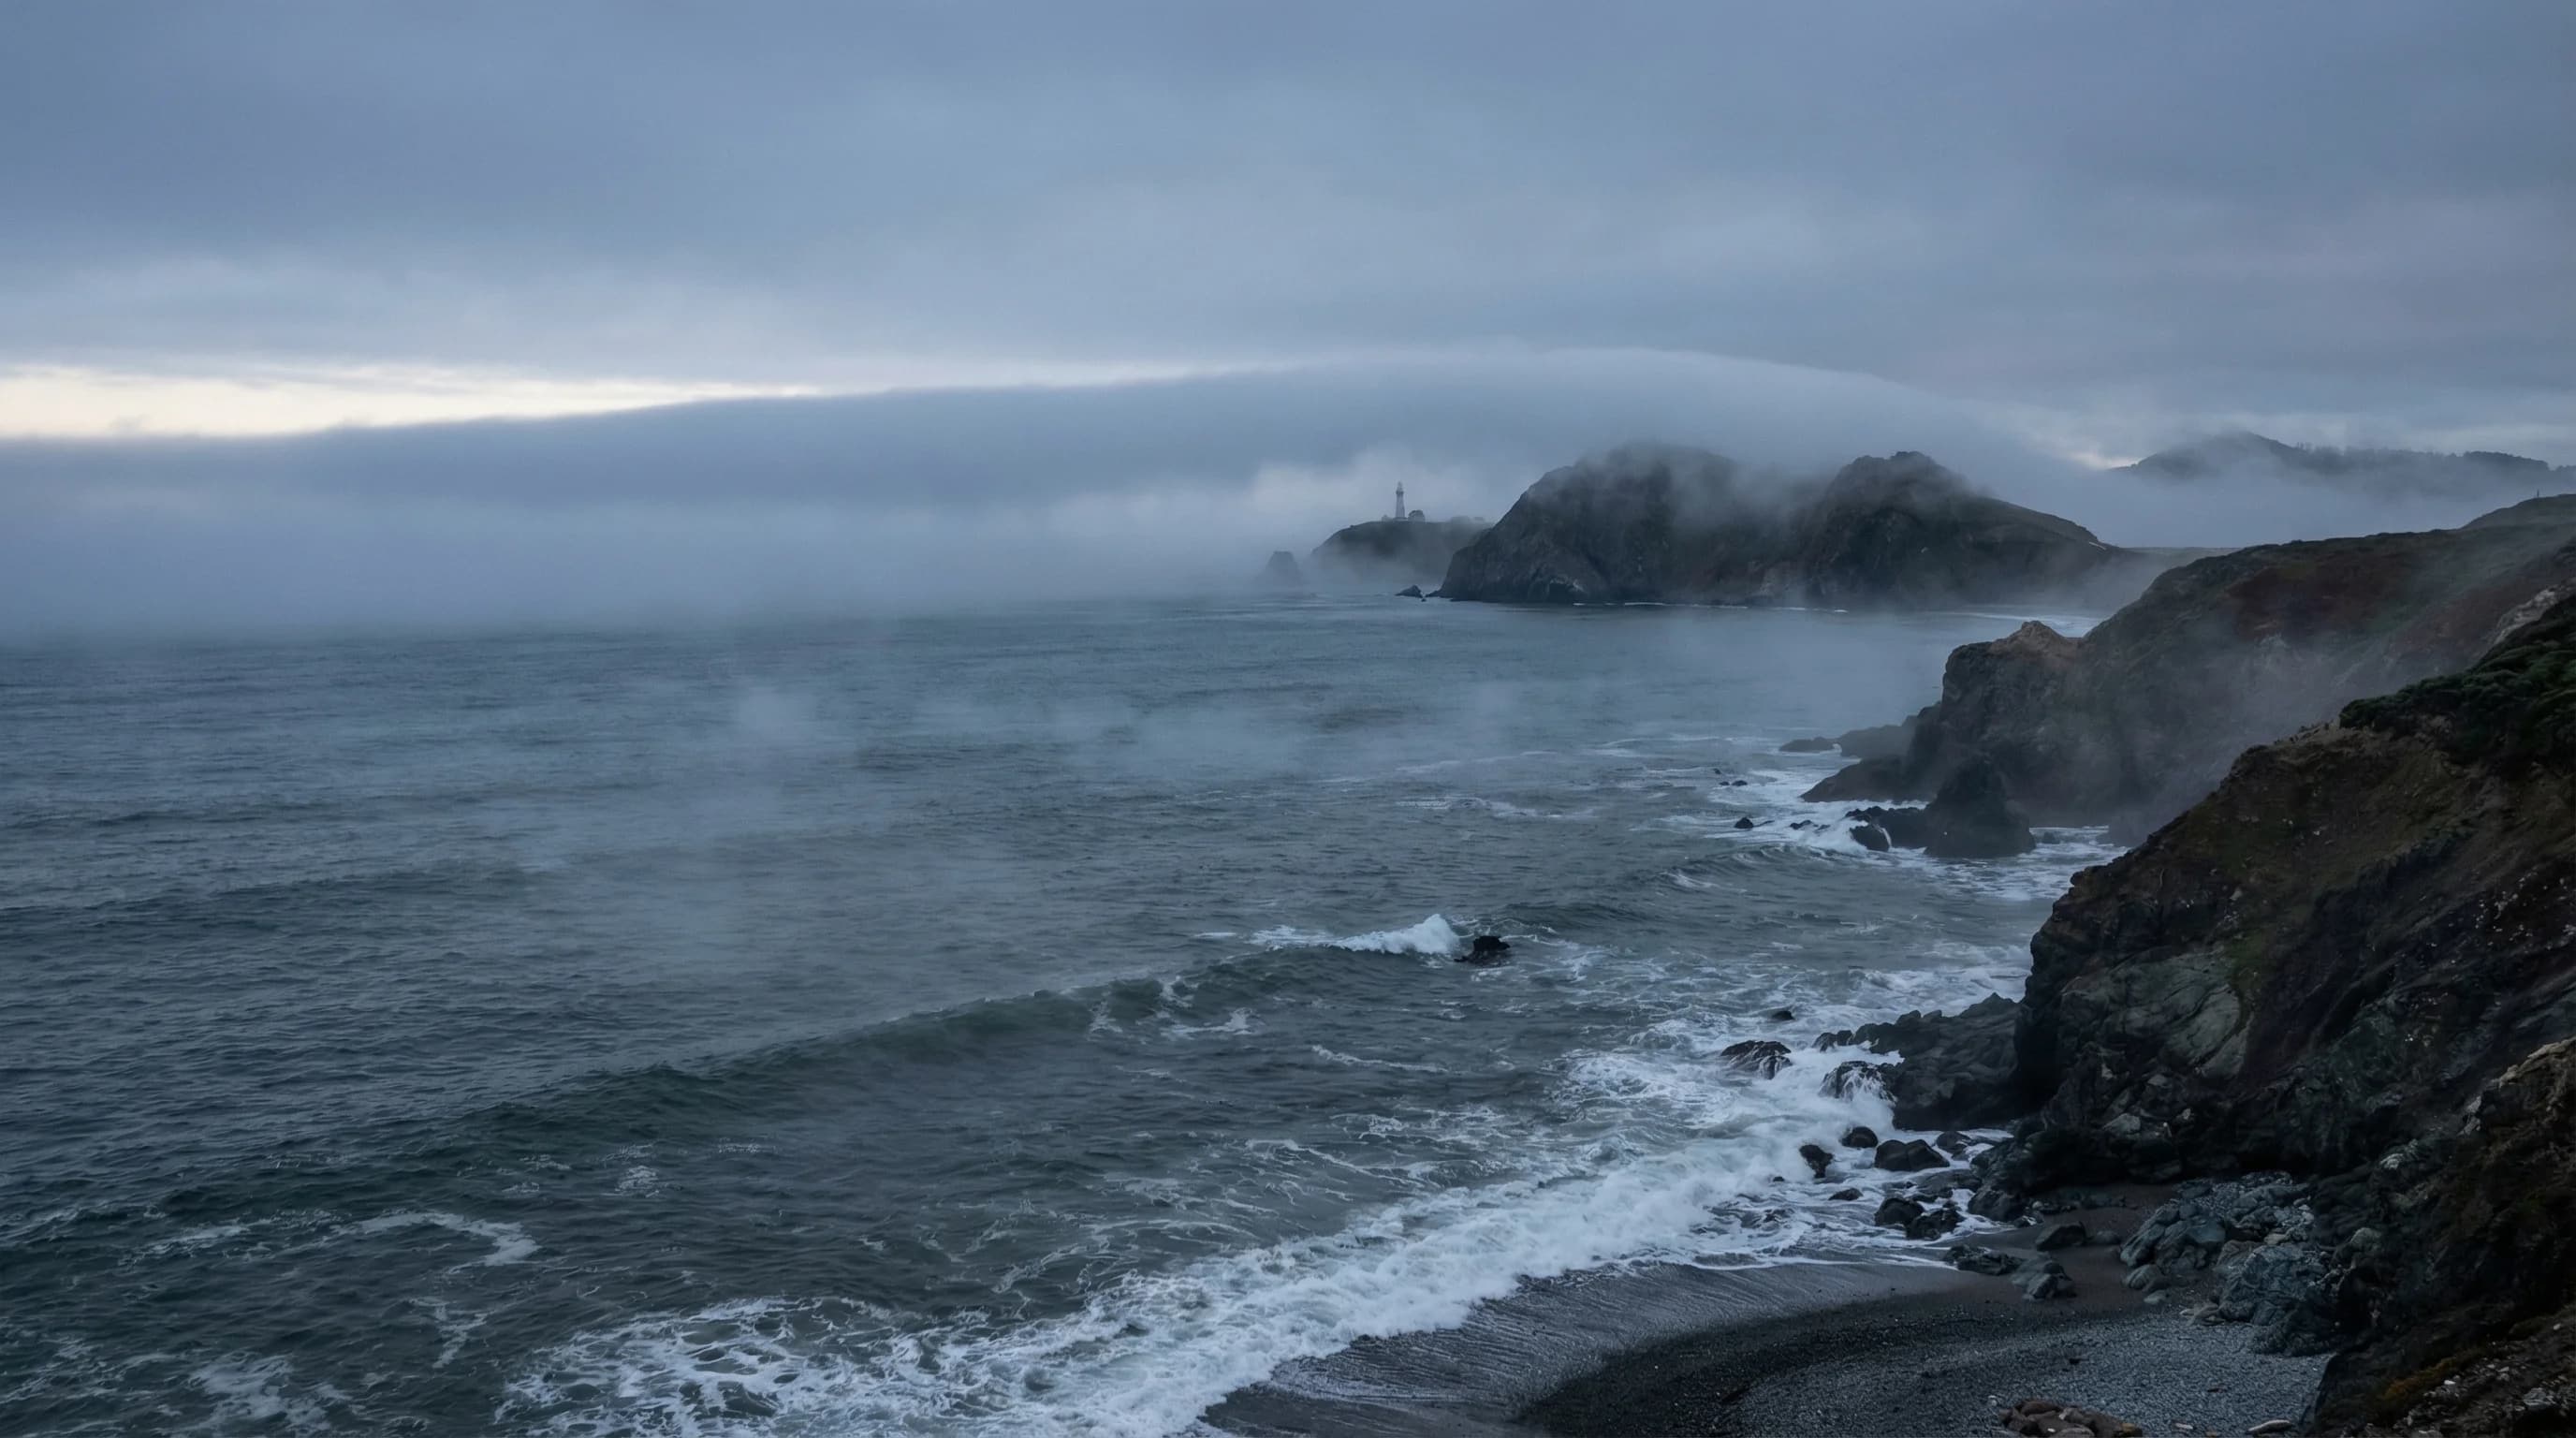
Bay Area fog begins over the cold Pacific Ocean, where warm moist air meets the California Current. It then travels onshore through the Golden Gate. This is ocean fog, and it follows different rules than any other kind.
6min read →
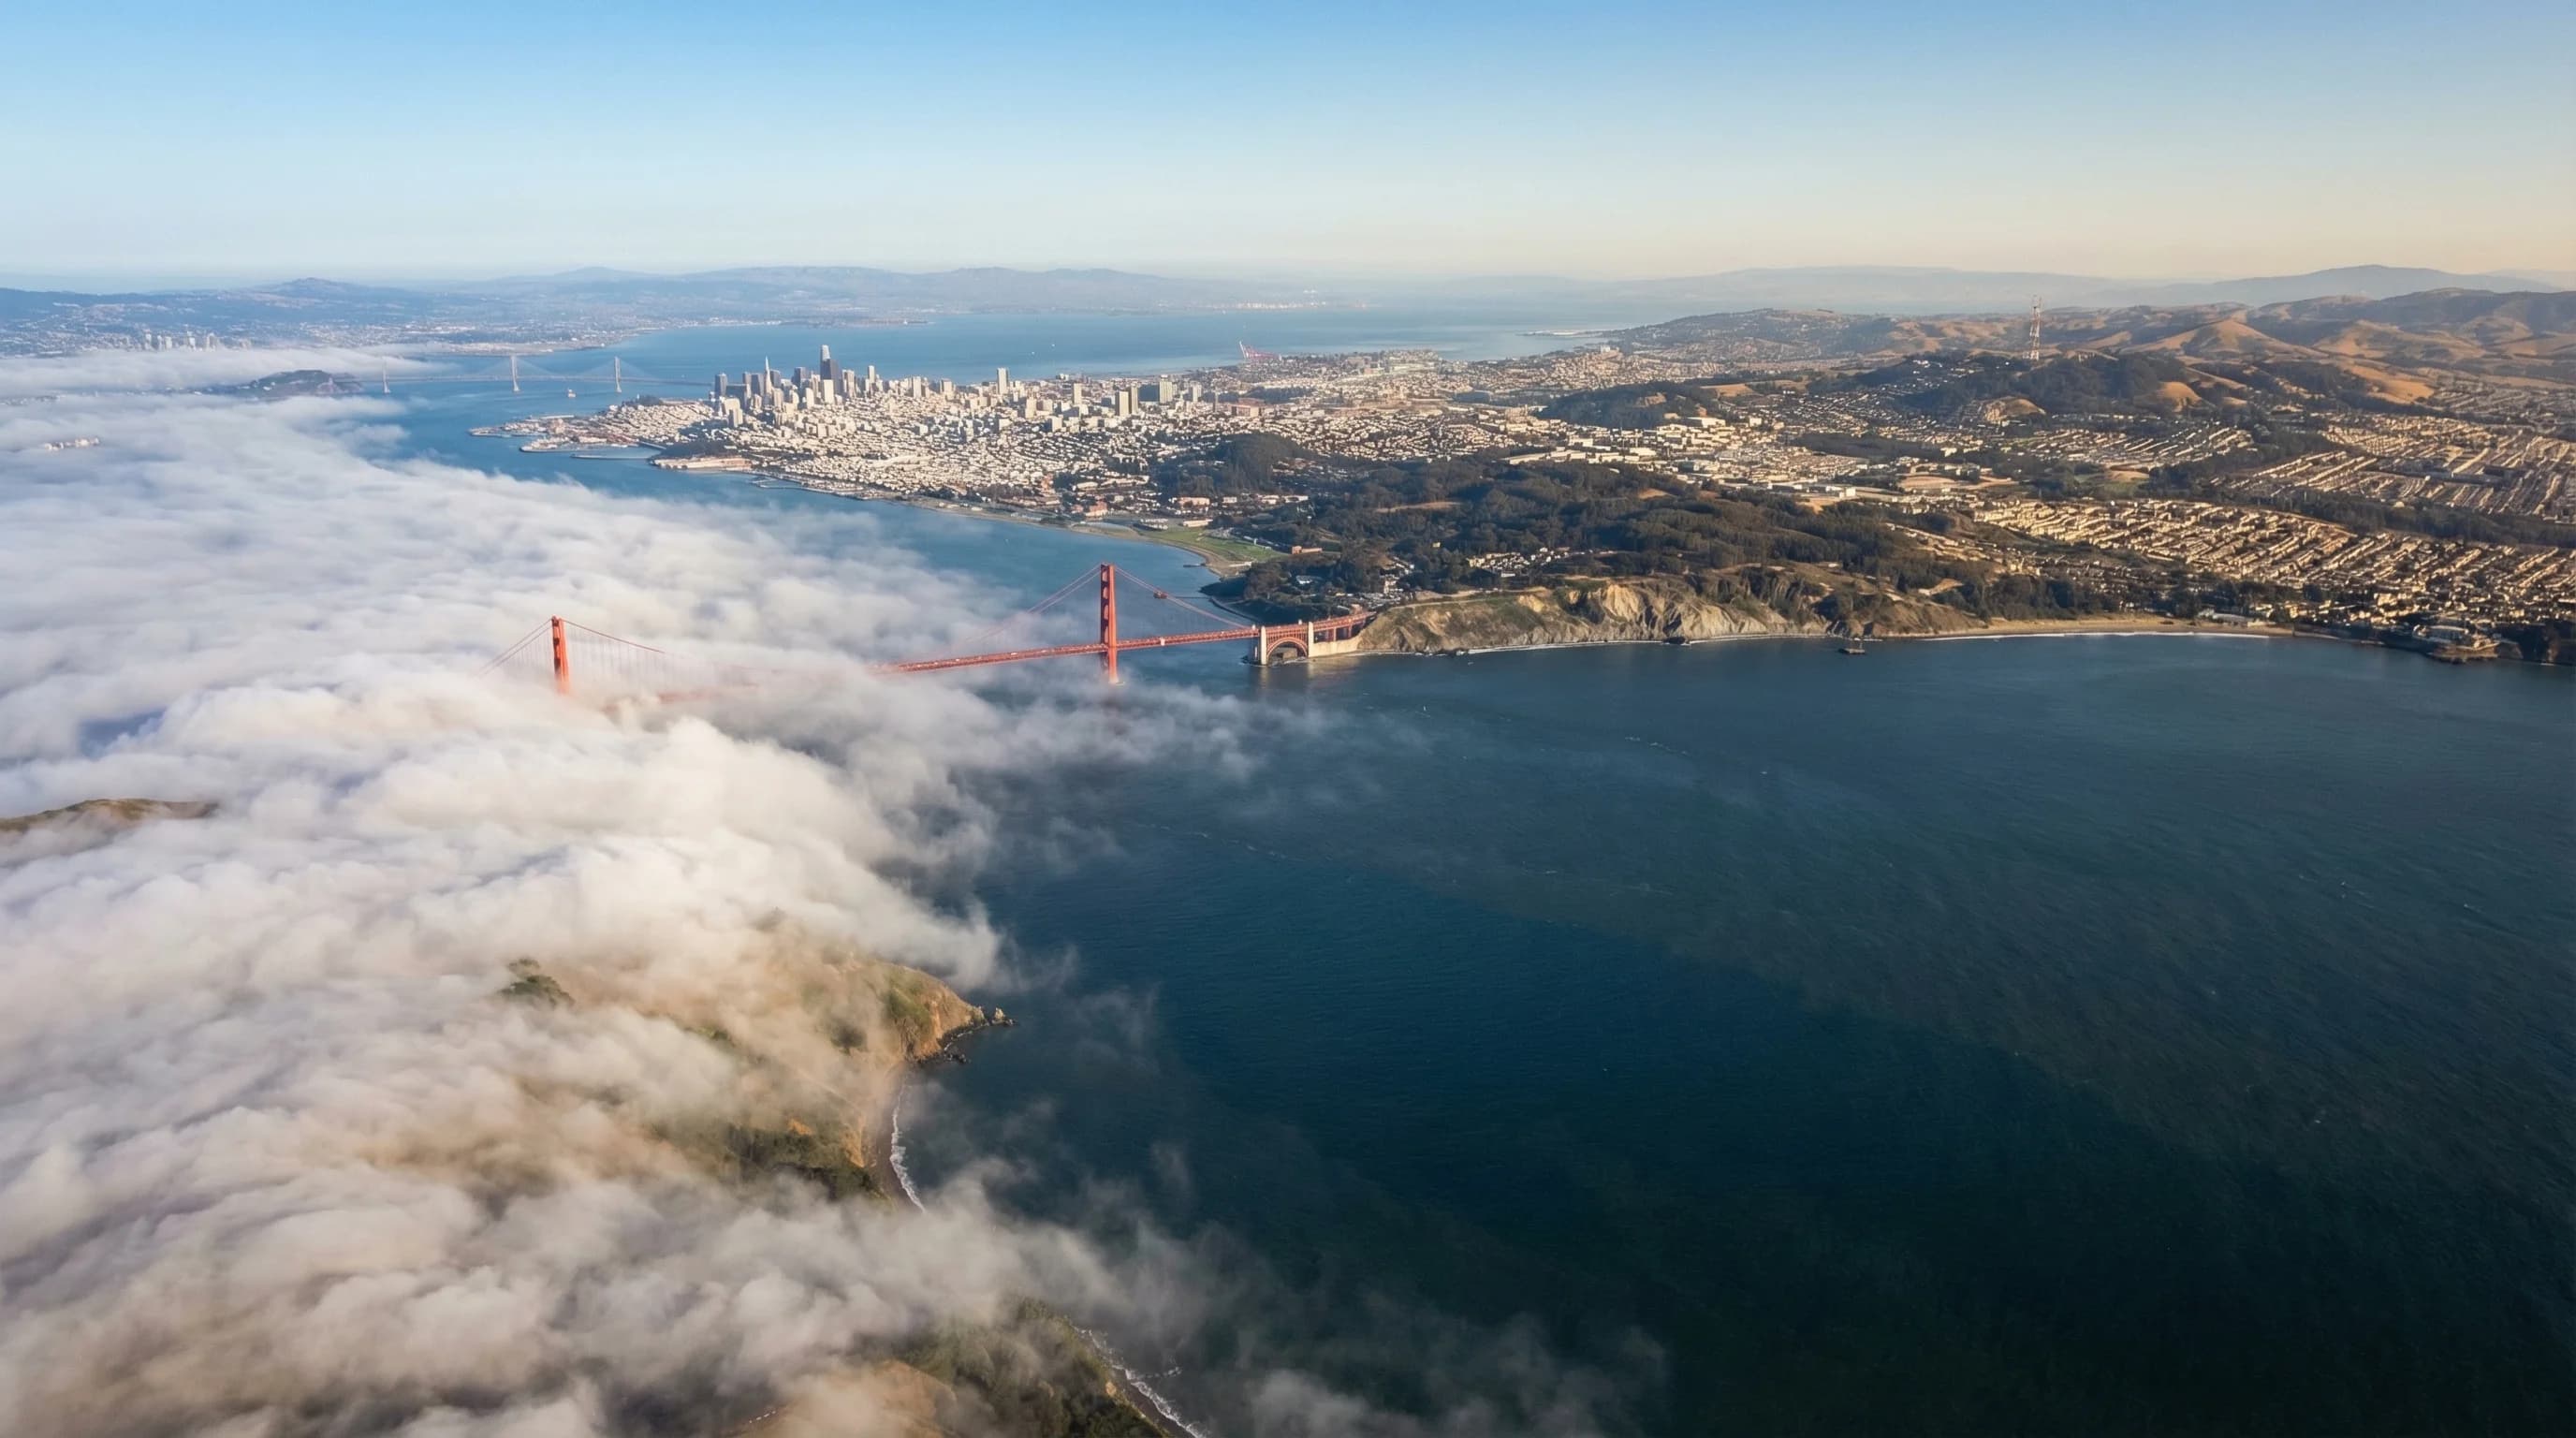
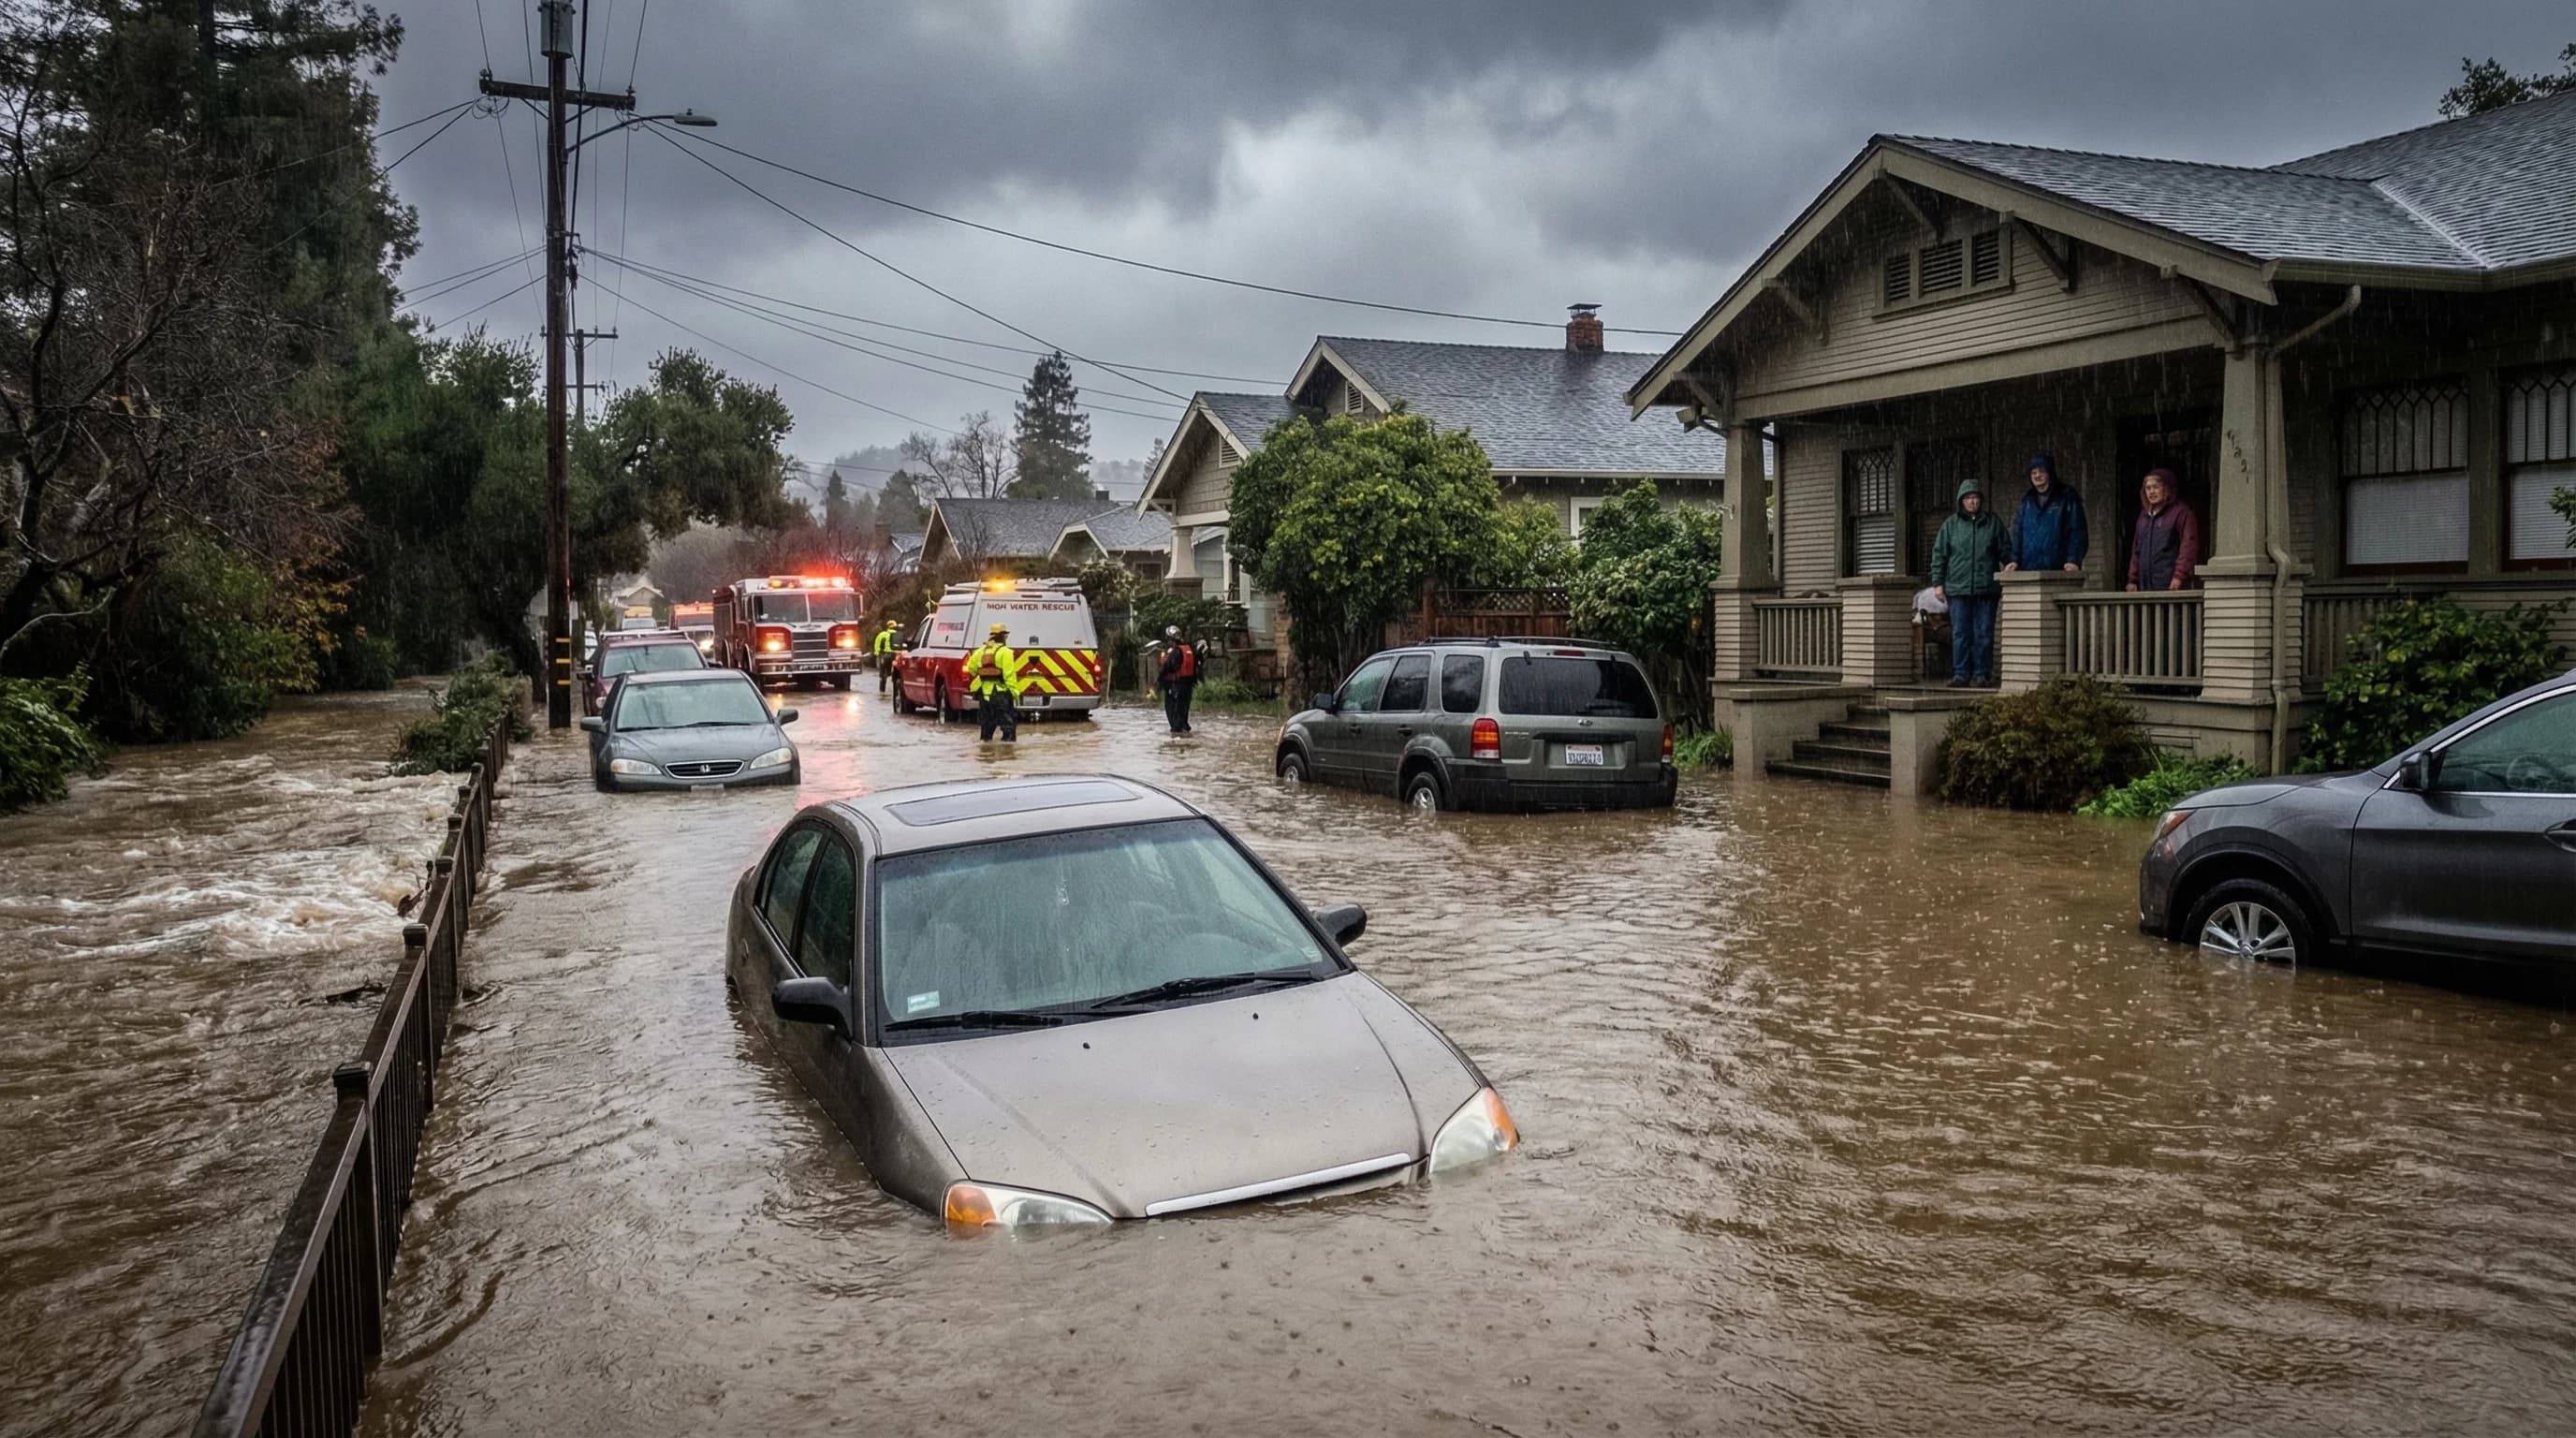
Tule fog is California's deadliest weather phenomenon, not earthquakes or wildfires. The Central Valley's flat bowl traps it for days or weeks. It flows into Bay Area inland valleys through the Delta and Altamont Pass.
6min read →Category
The big-picture forces that shape Bay Area weather: microclimates, wind, storms, and ocean effects.
A 10-mile drive in the Bay Area can mean a 20-degree temperature change. Here is why the region has more distinct microclimates than anywhere else in California.
6min read →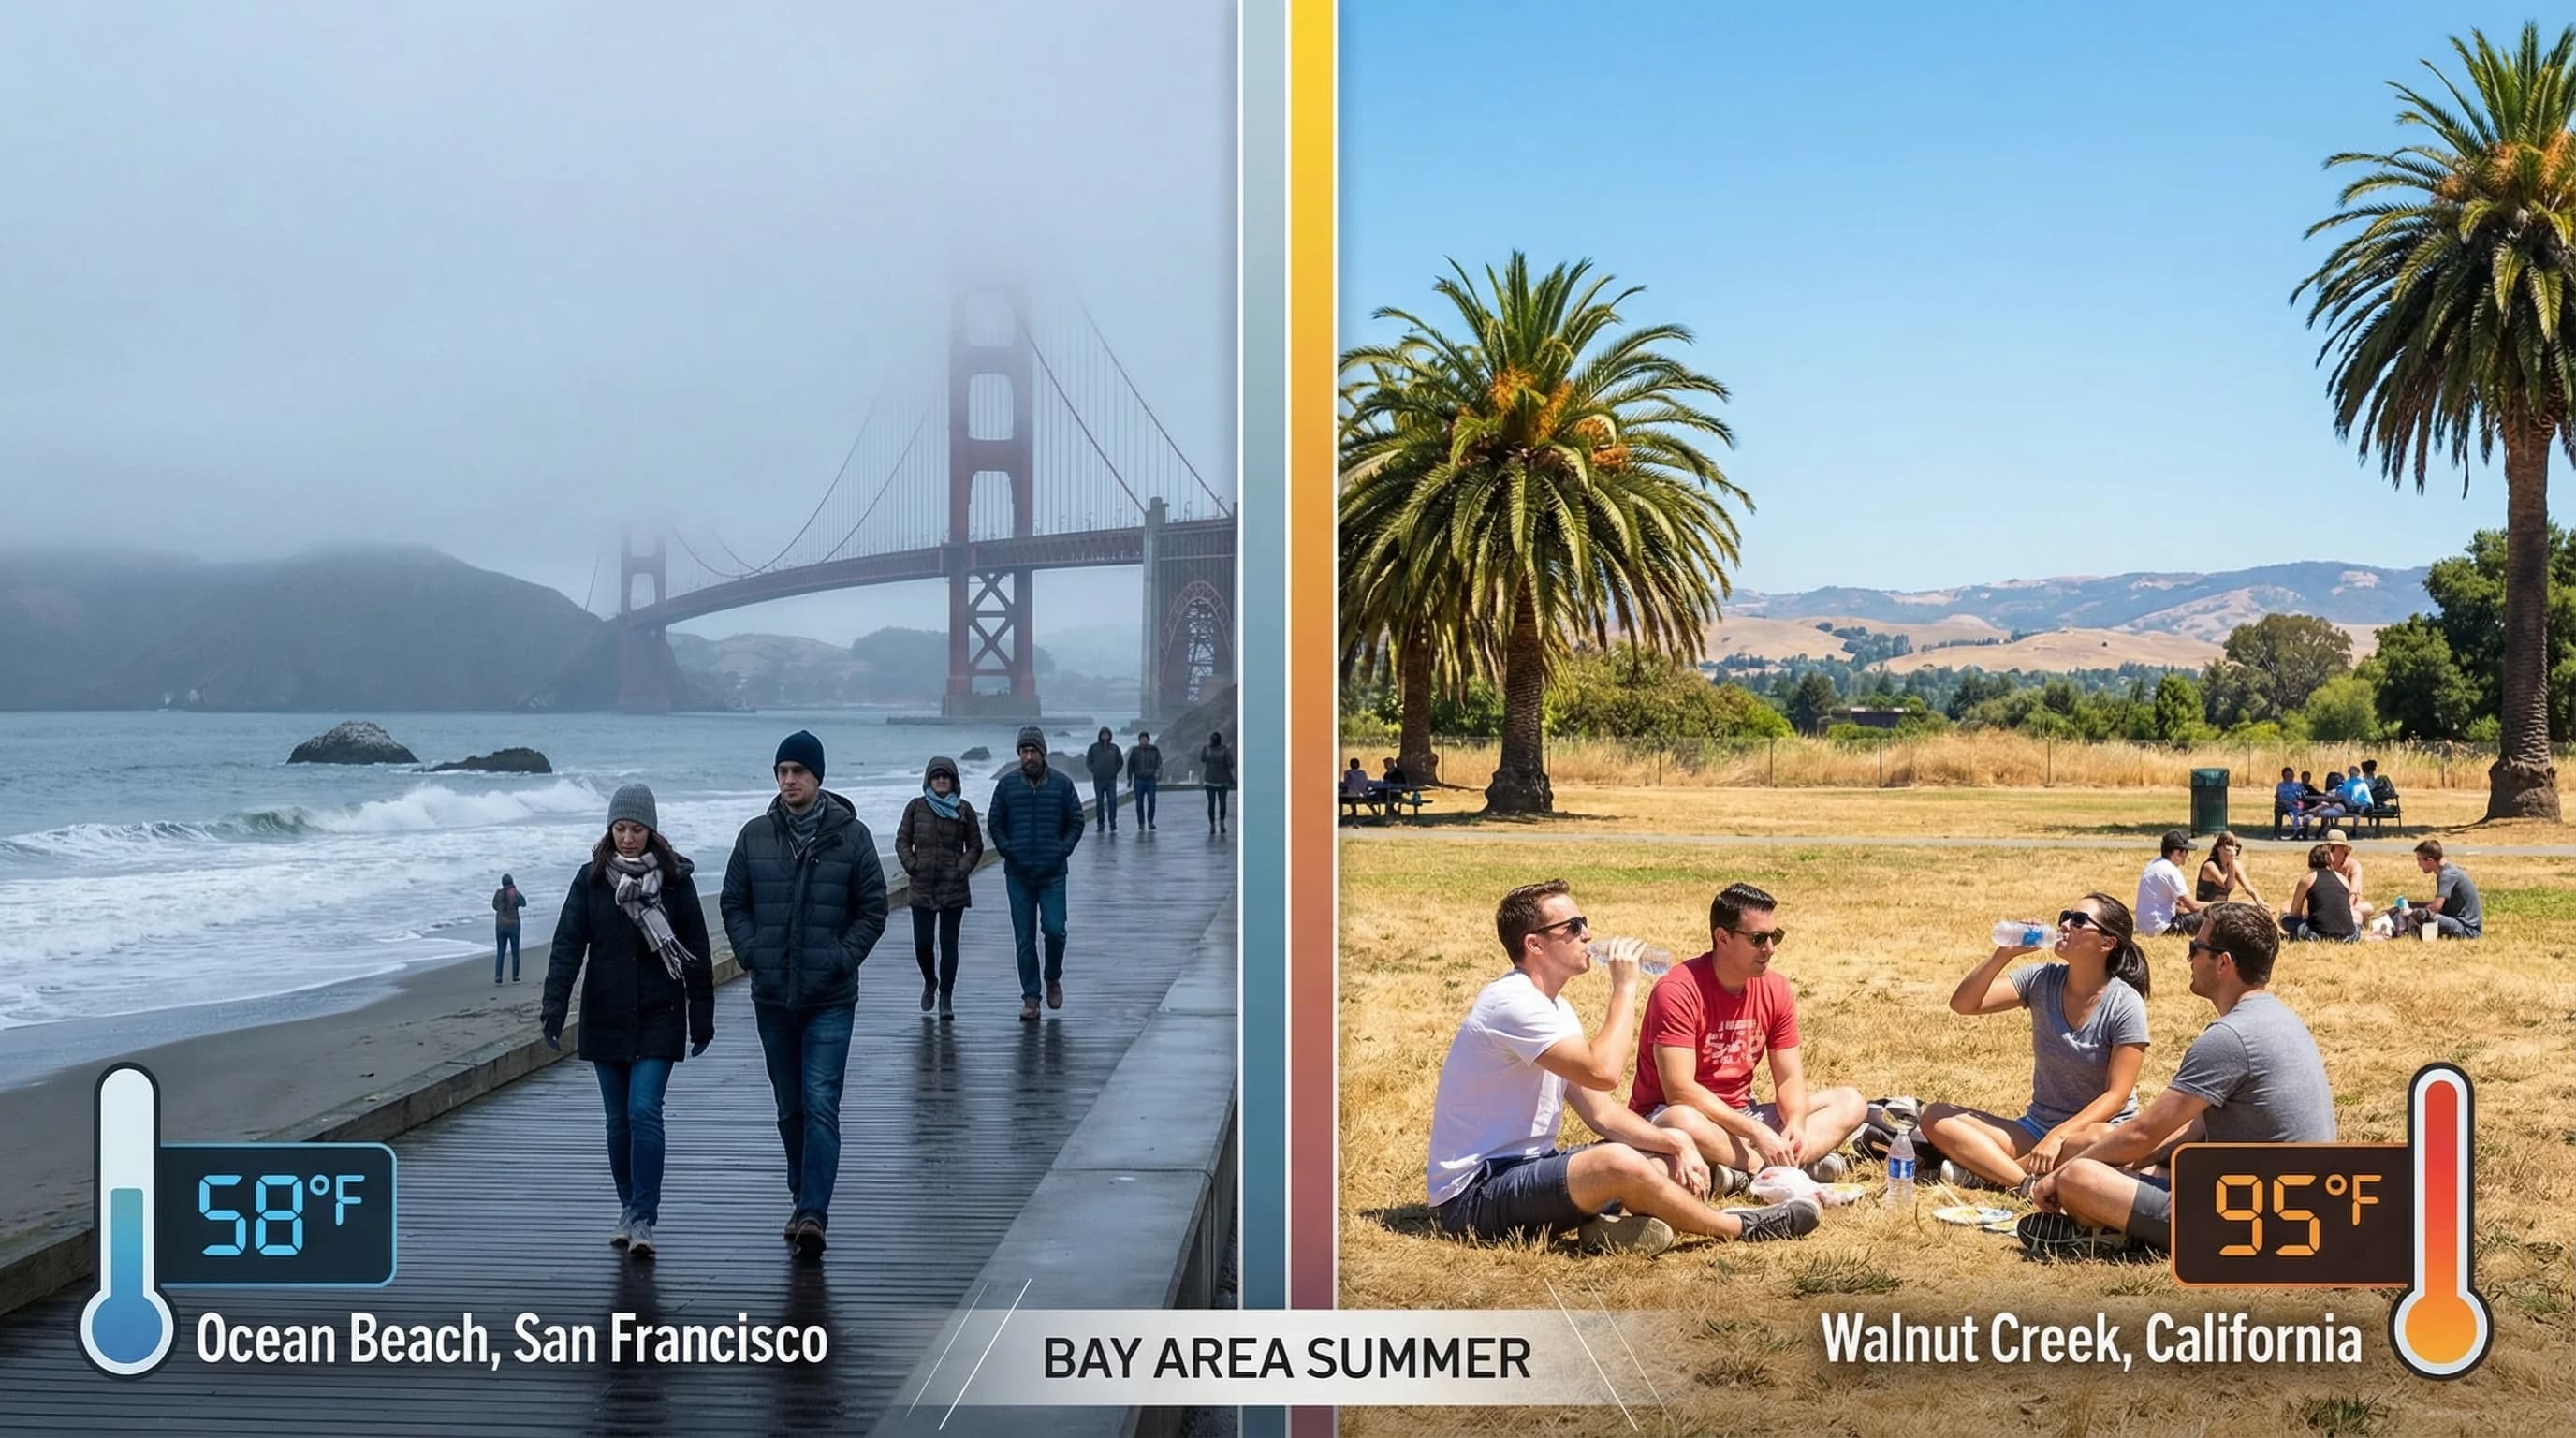
The Bay Area coast is typically 20-30 degrees colder than inland valleys on the same summer day. Here is the science behind one of the world's most dramatic short-distance temperature gaps.
6min read →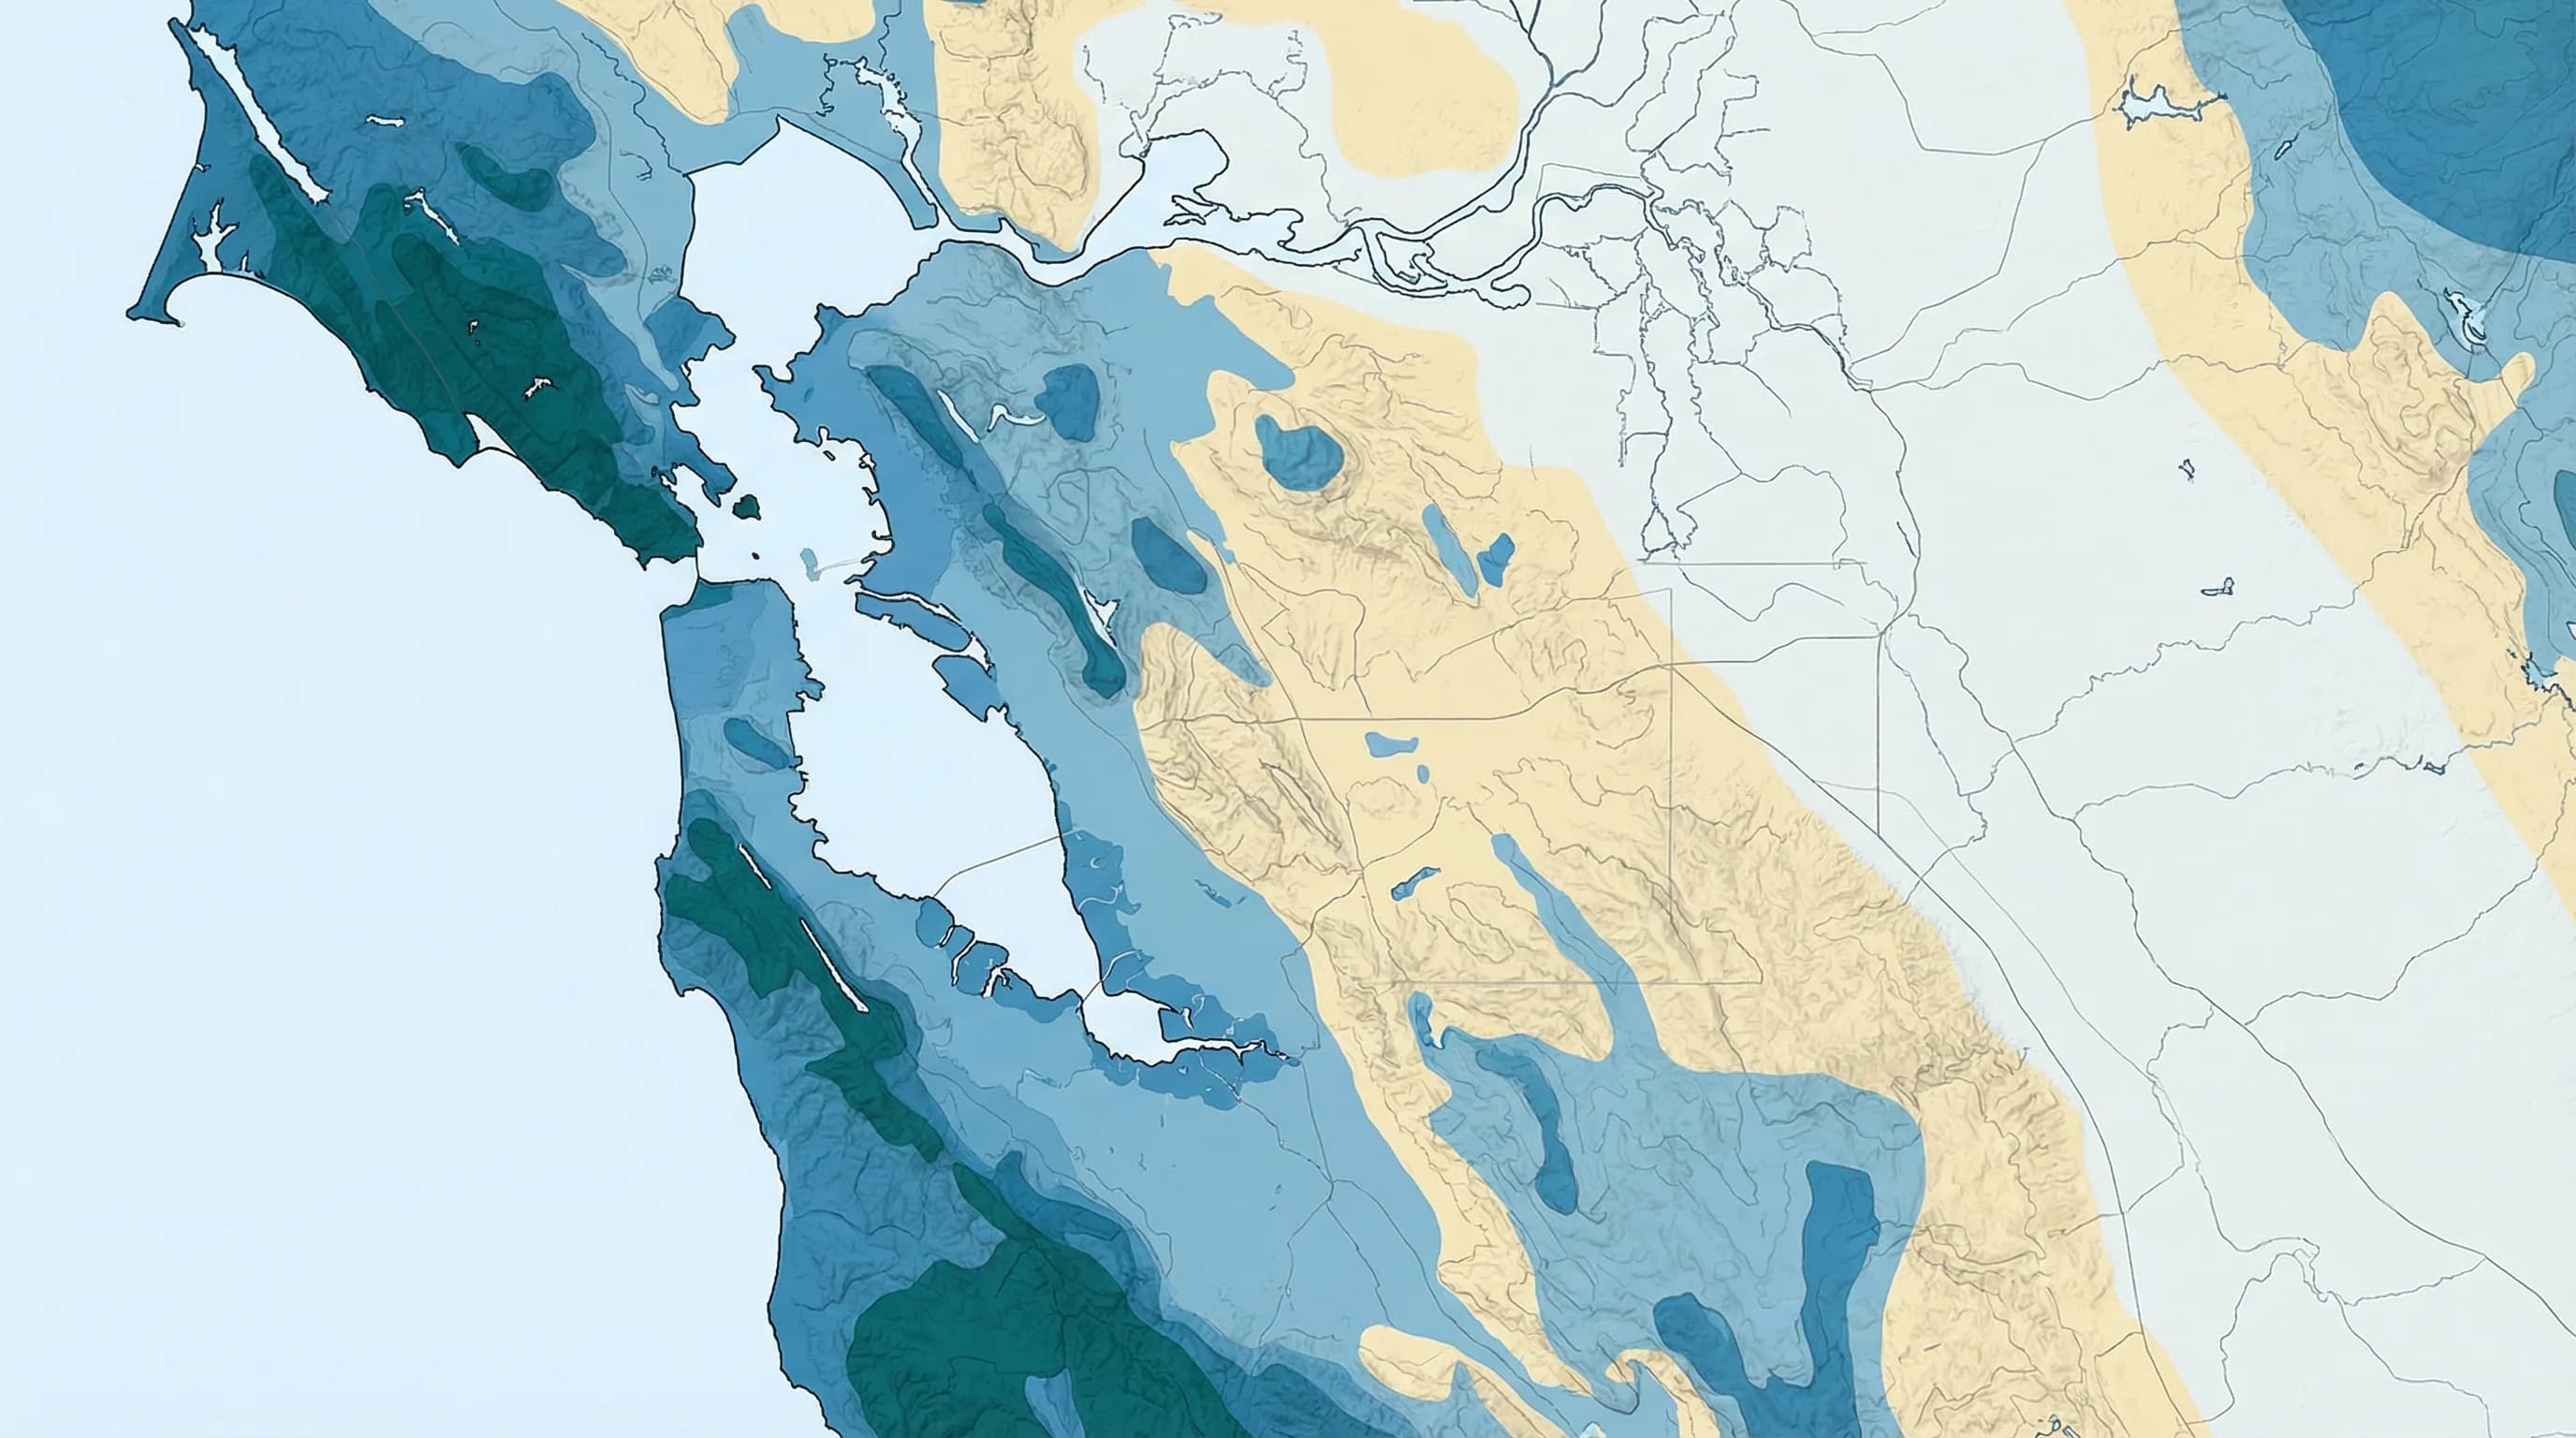
Mount Tamalpais receives 70 inches of rain per year. Livermore, 30 miles away, gets 14 inches. The difference comes down to orographic lift, mountain ranges, and rain shadows. Those same forces create Bay Area microclimates.
7min read →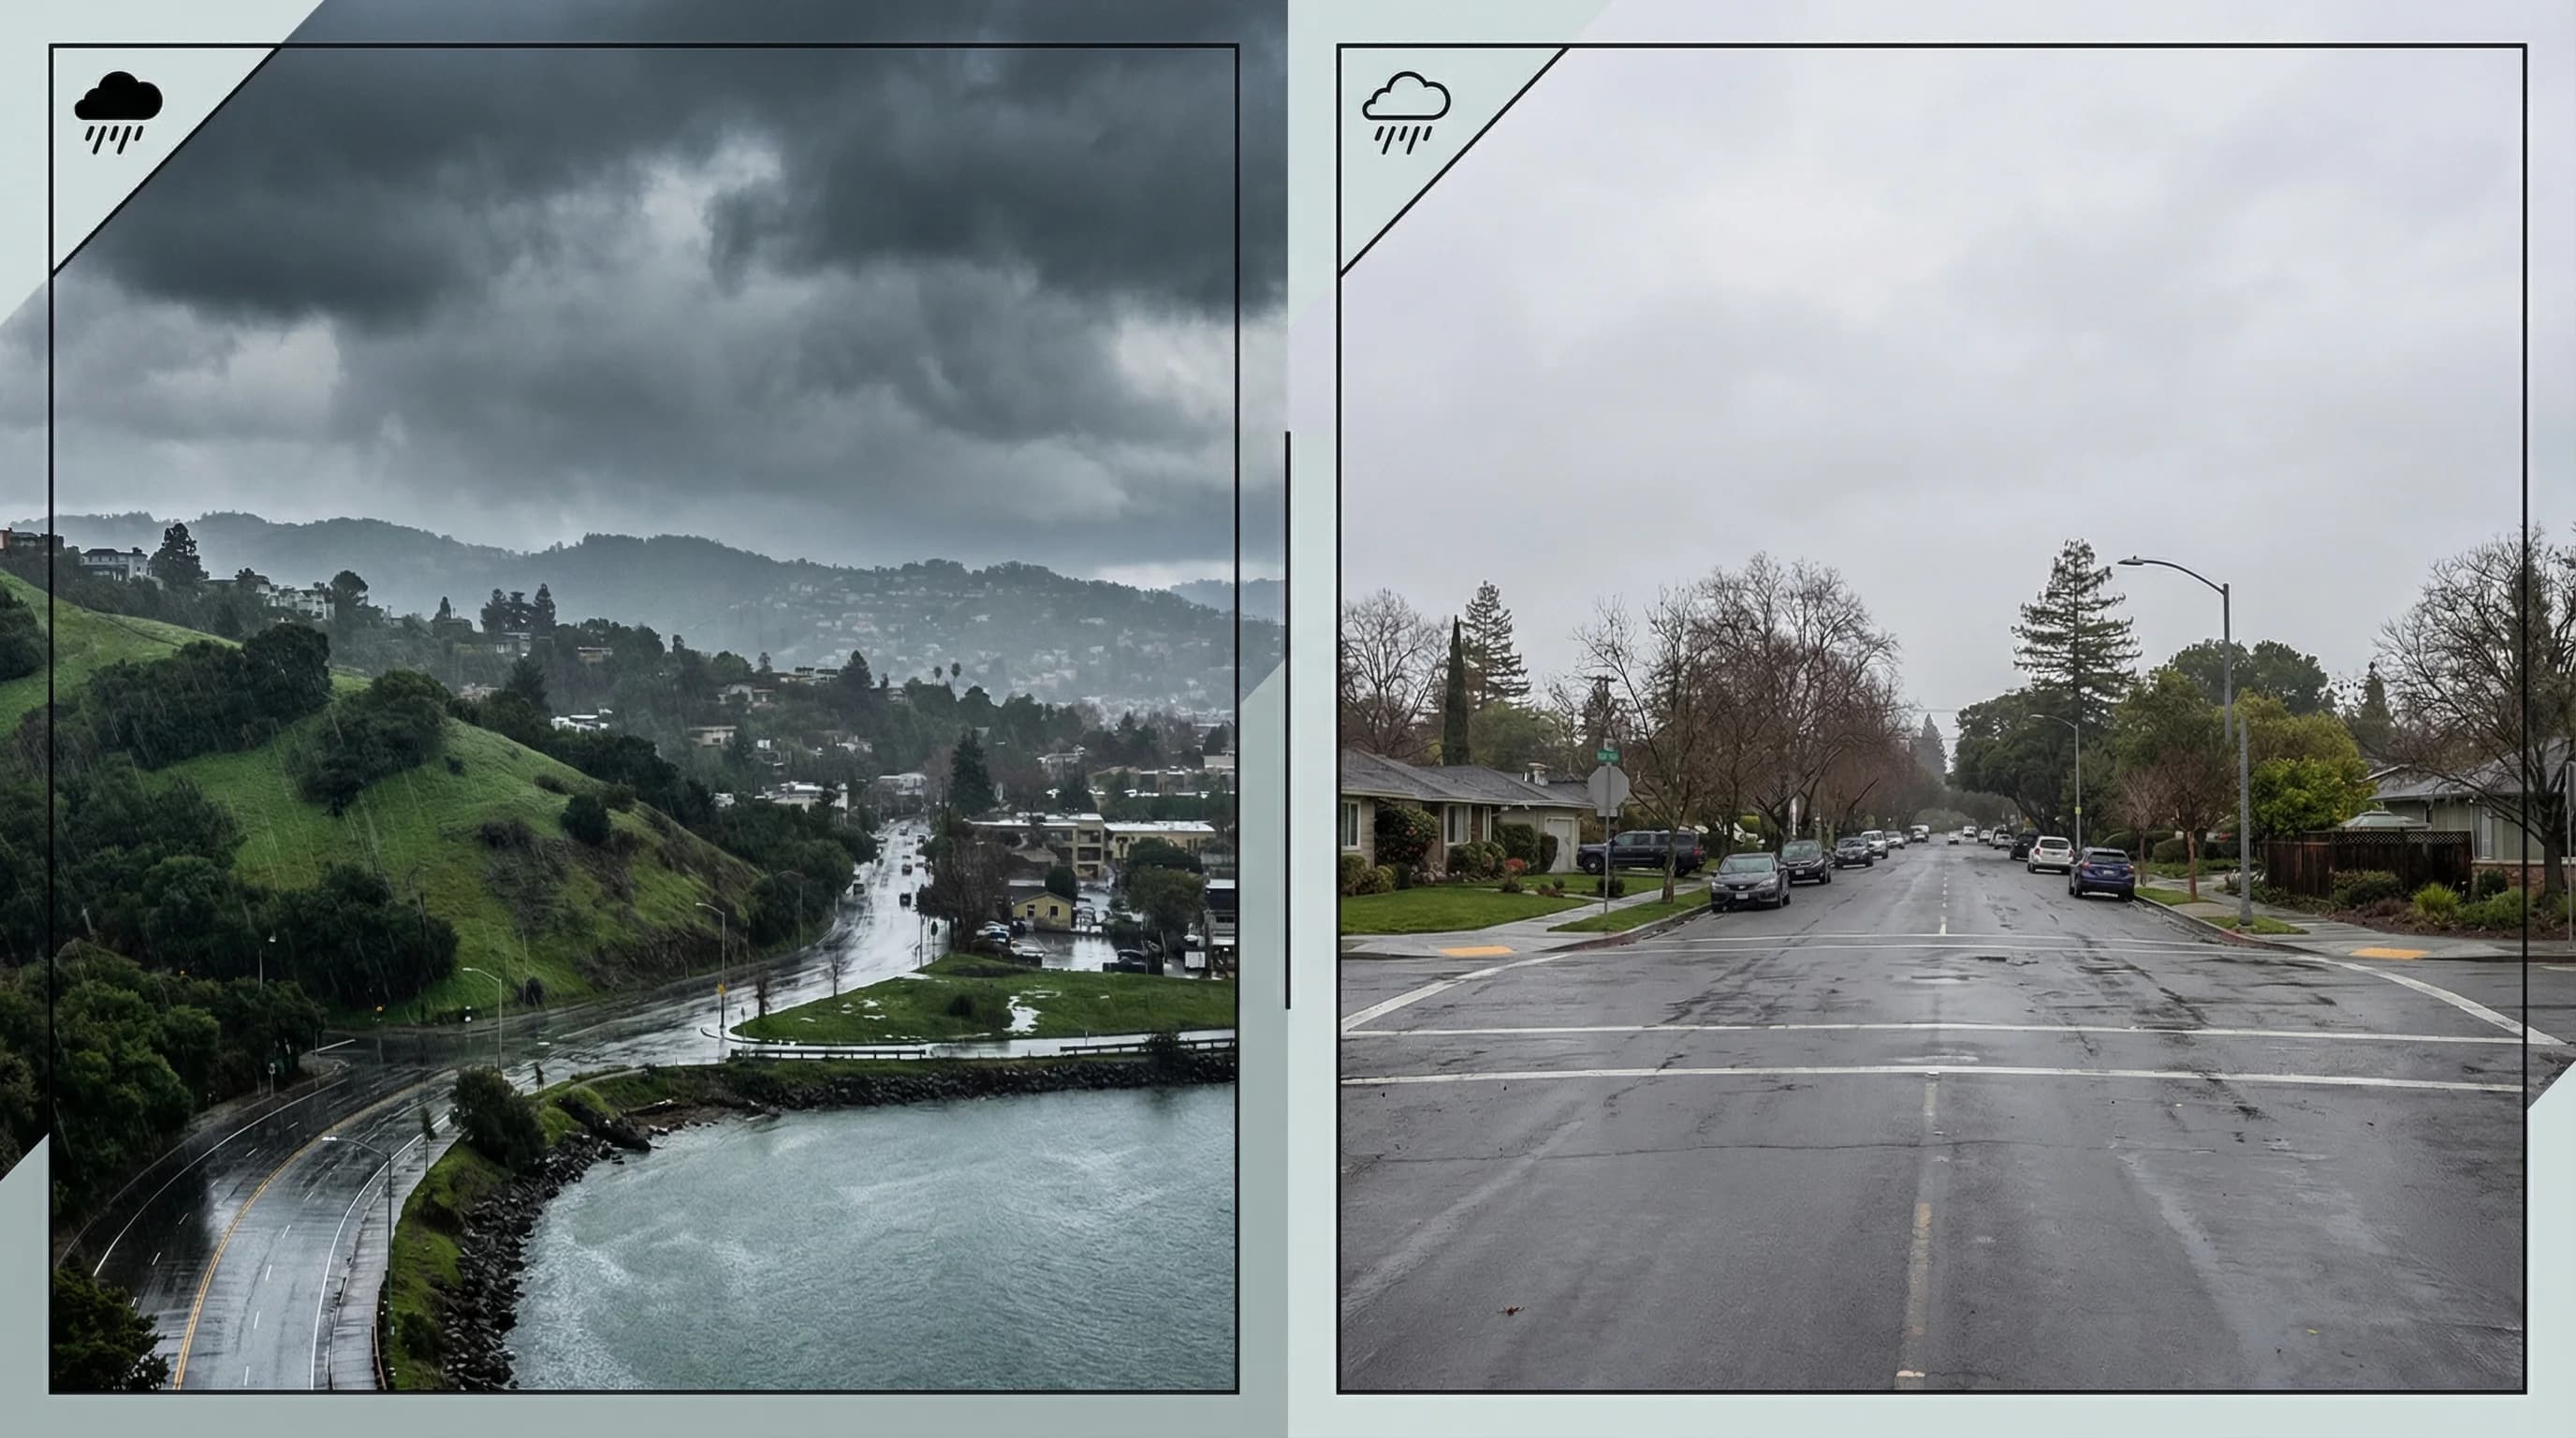
Oakland gets 25 inches of rain per year. Palo Alto gets 16 inches. The East Bay is consistently wetter than the Peninsula, despite being further from the ocean, because of storm tracks and the orographic effect of the Berkeley Hills and Diablo Range.
6min read →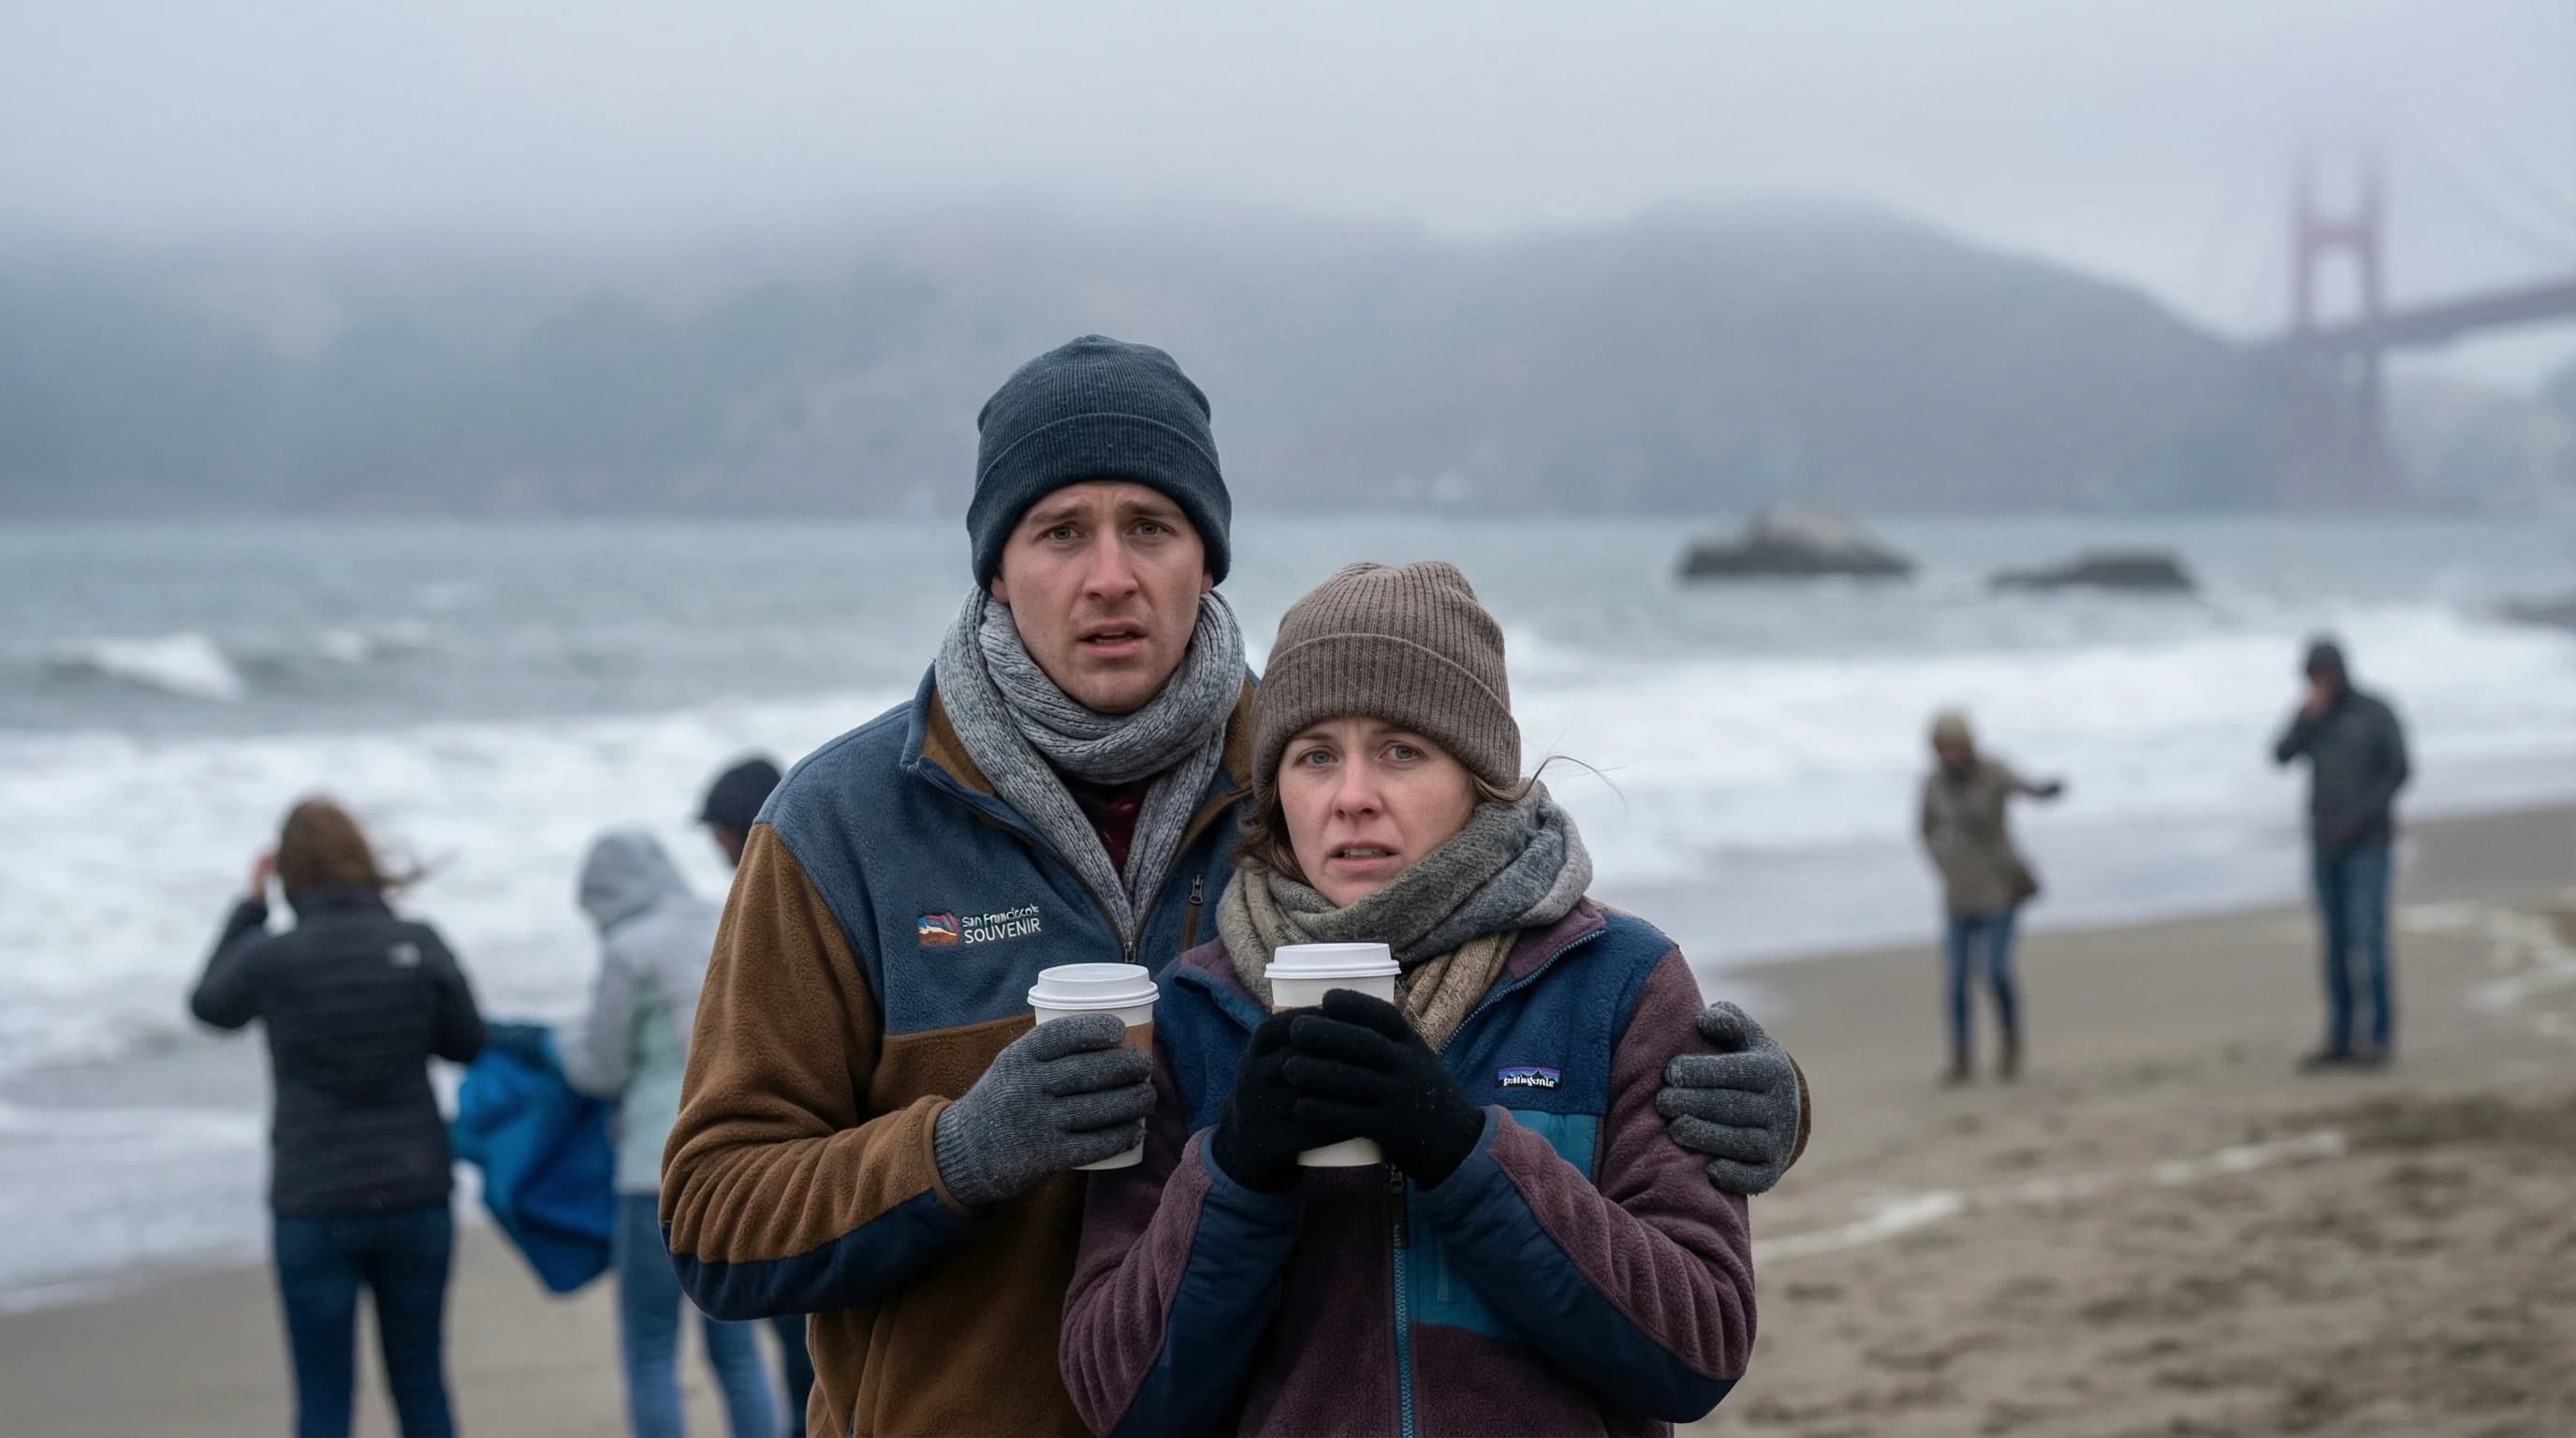
San Francisco summers average 64°F to 67 while the rest of California bakes. The cold Pacific Ocean, persistent marine fog, and coastal pressure dynamics combine to keep the city cool when you least expect it.
5min read →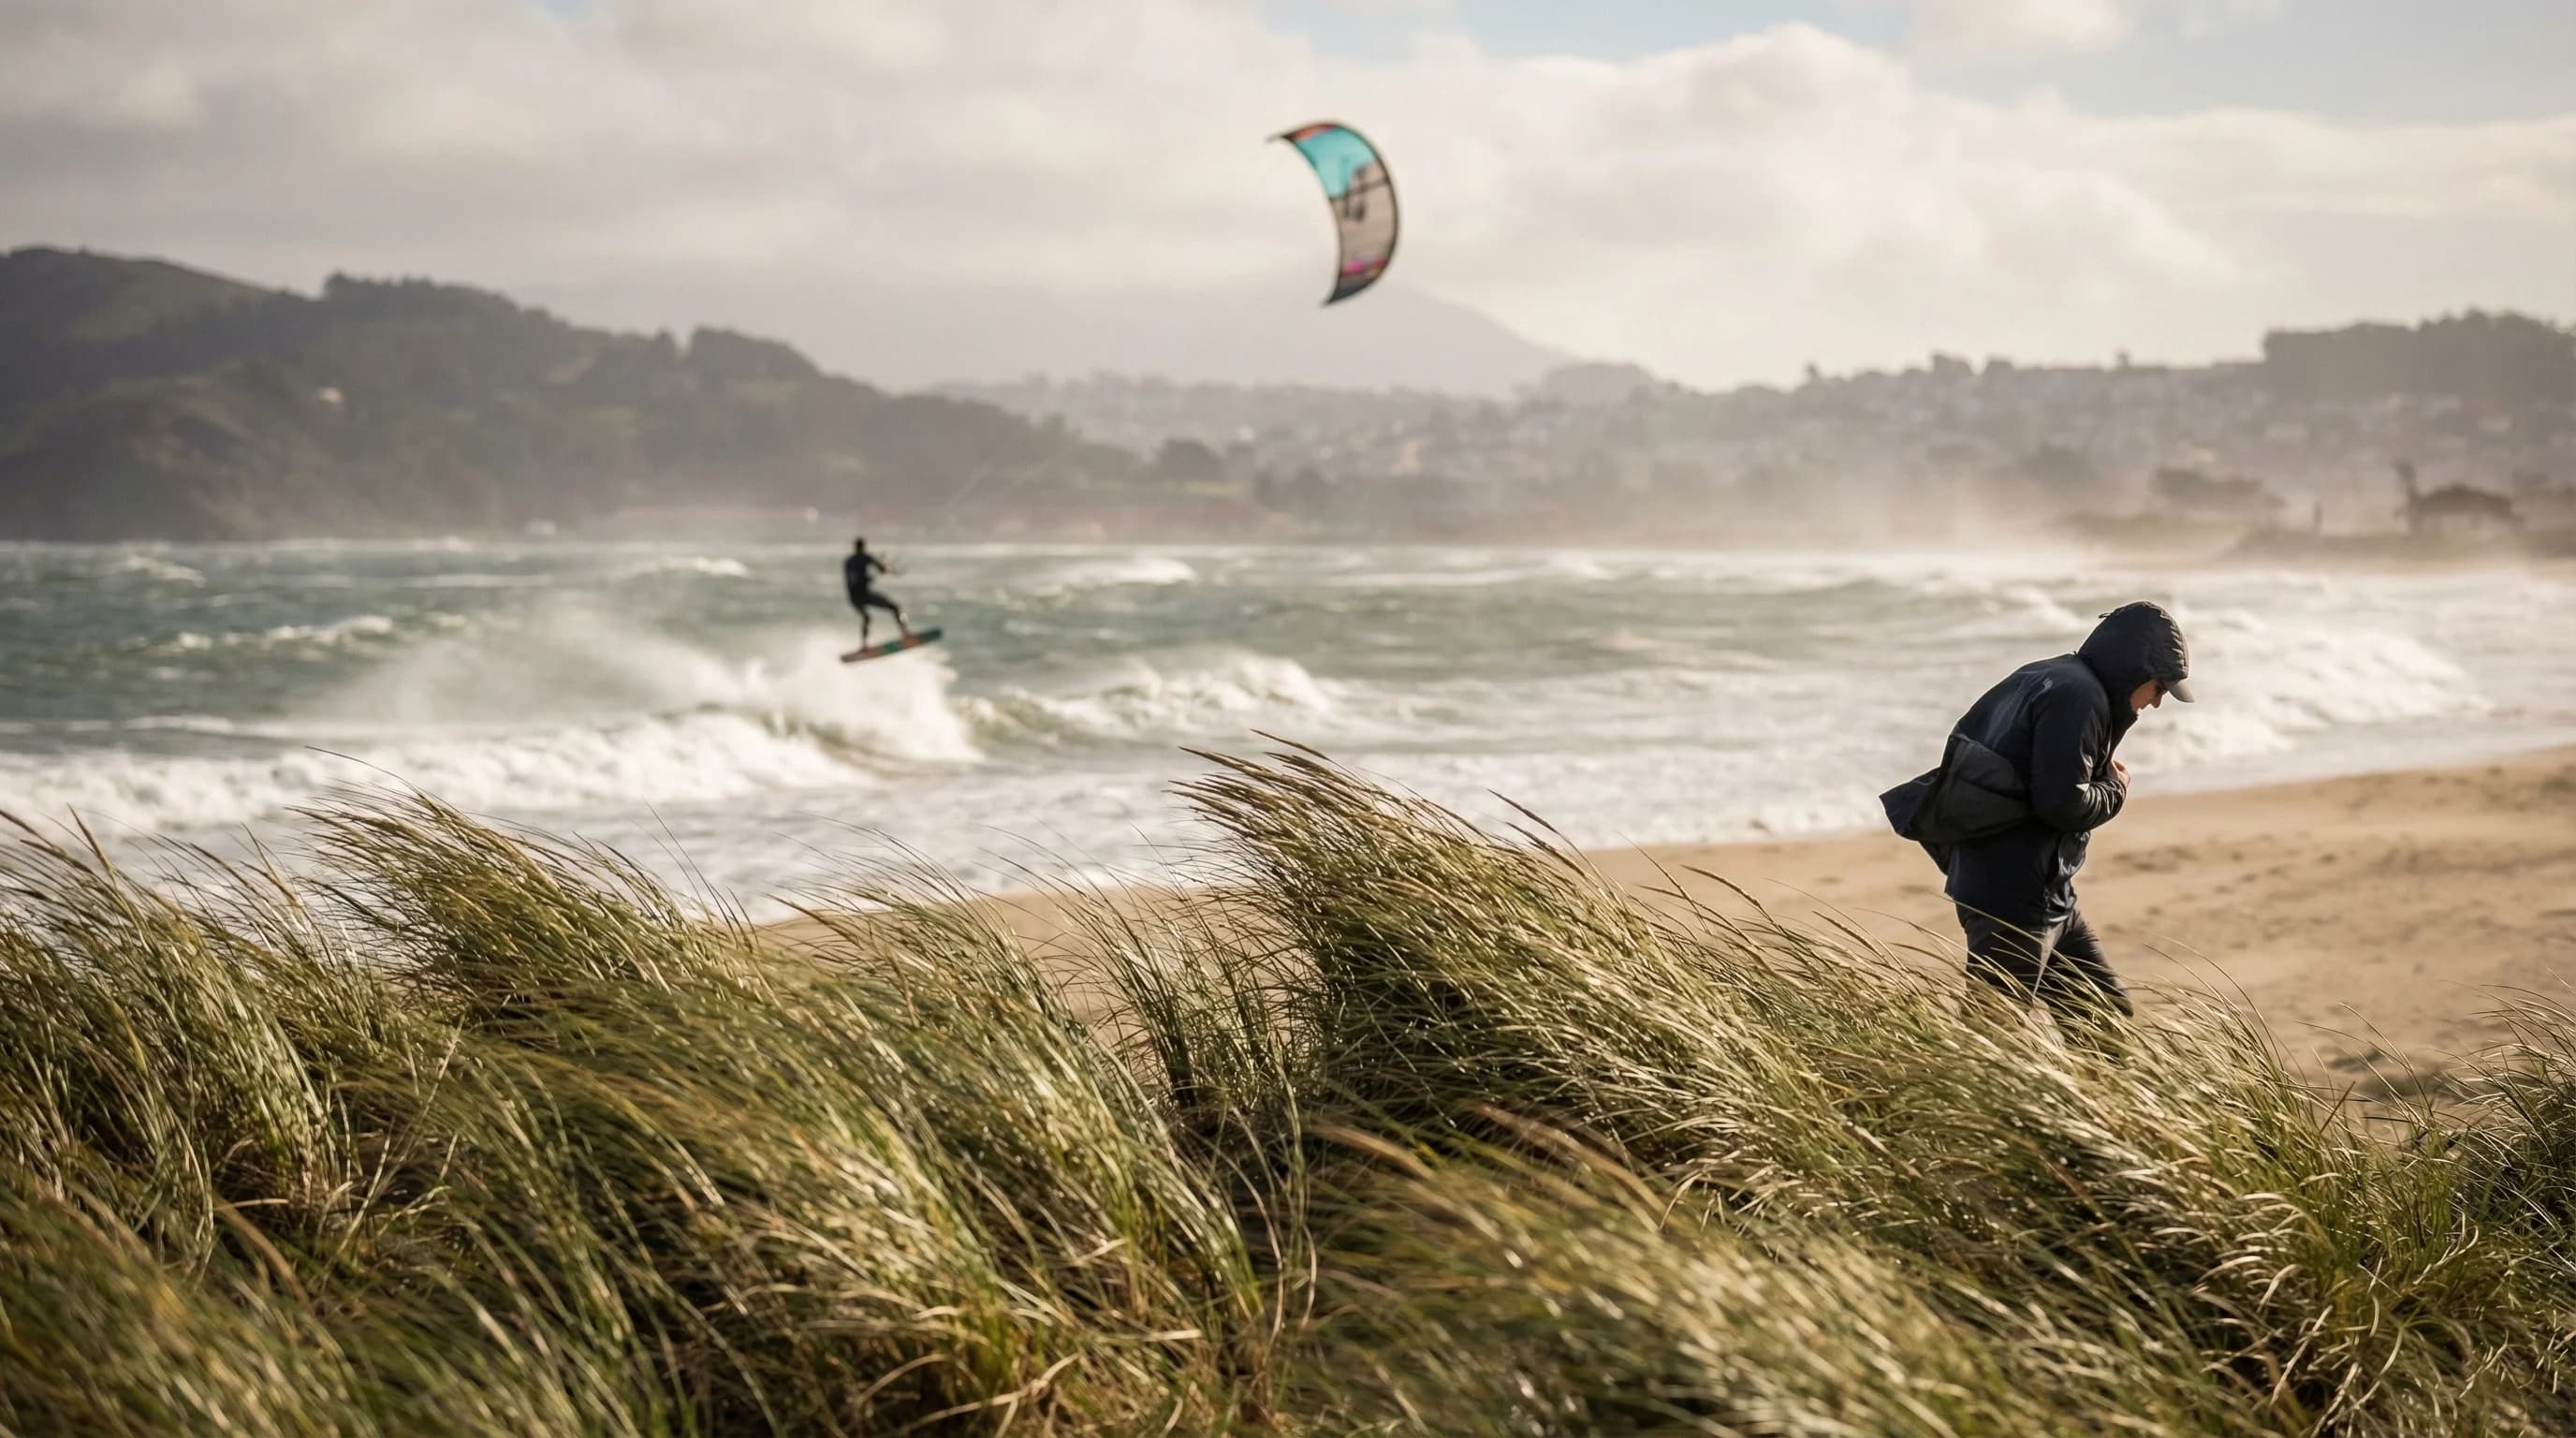
The cold Pacific Ocean, the scorching Central Valley, and geographic corridors like the Golden Gate all conspire to make the Bay Area genuinely windier than most regions. Here is the physics behind it.
5min read →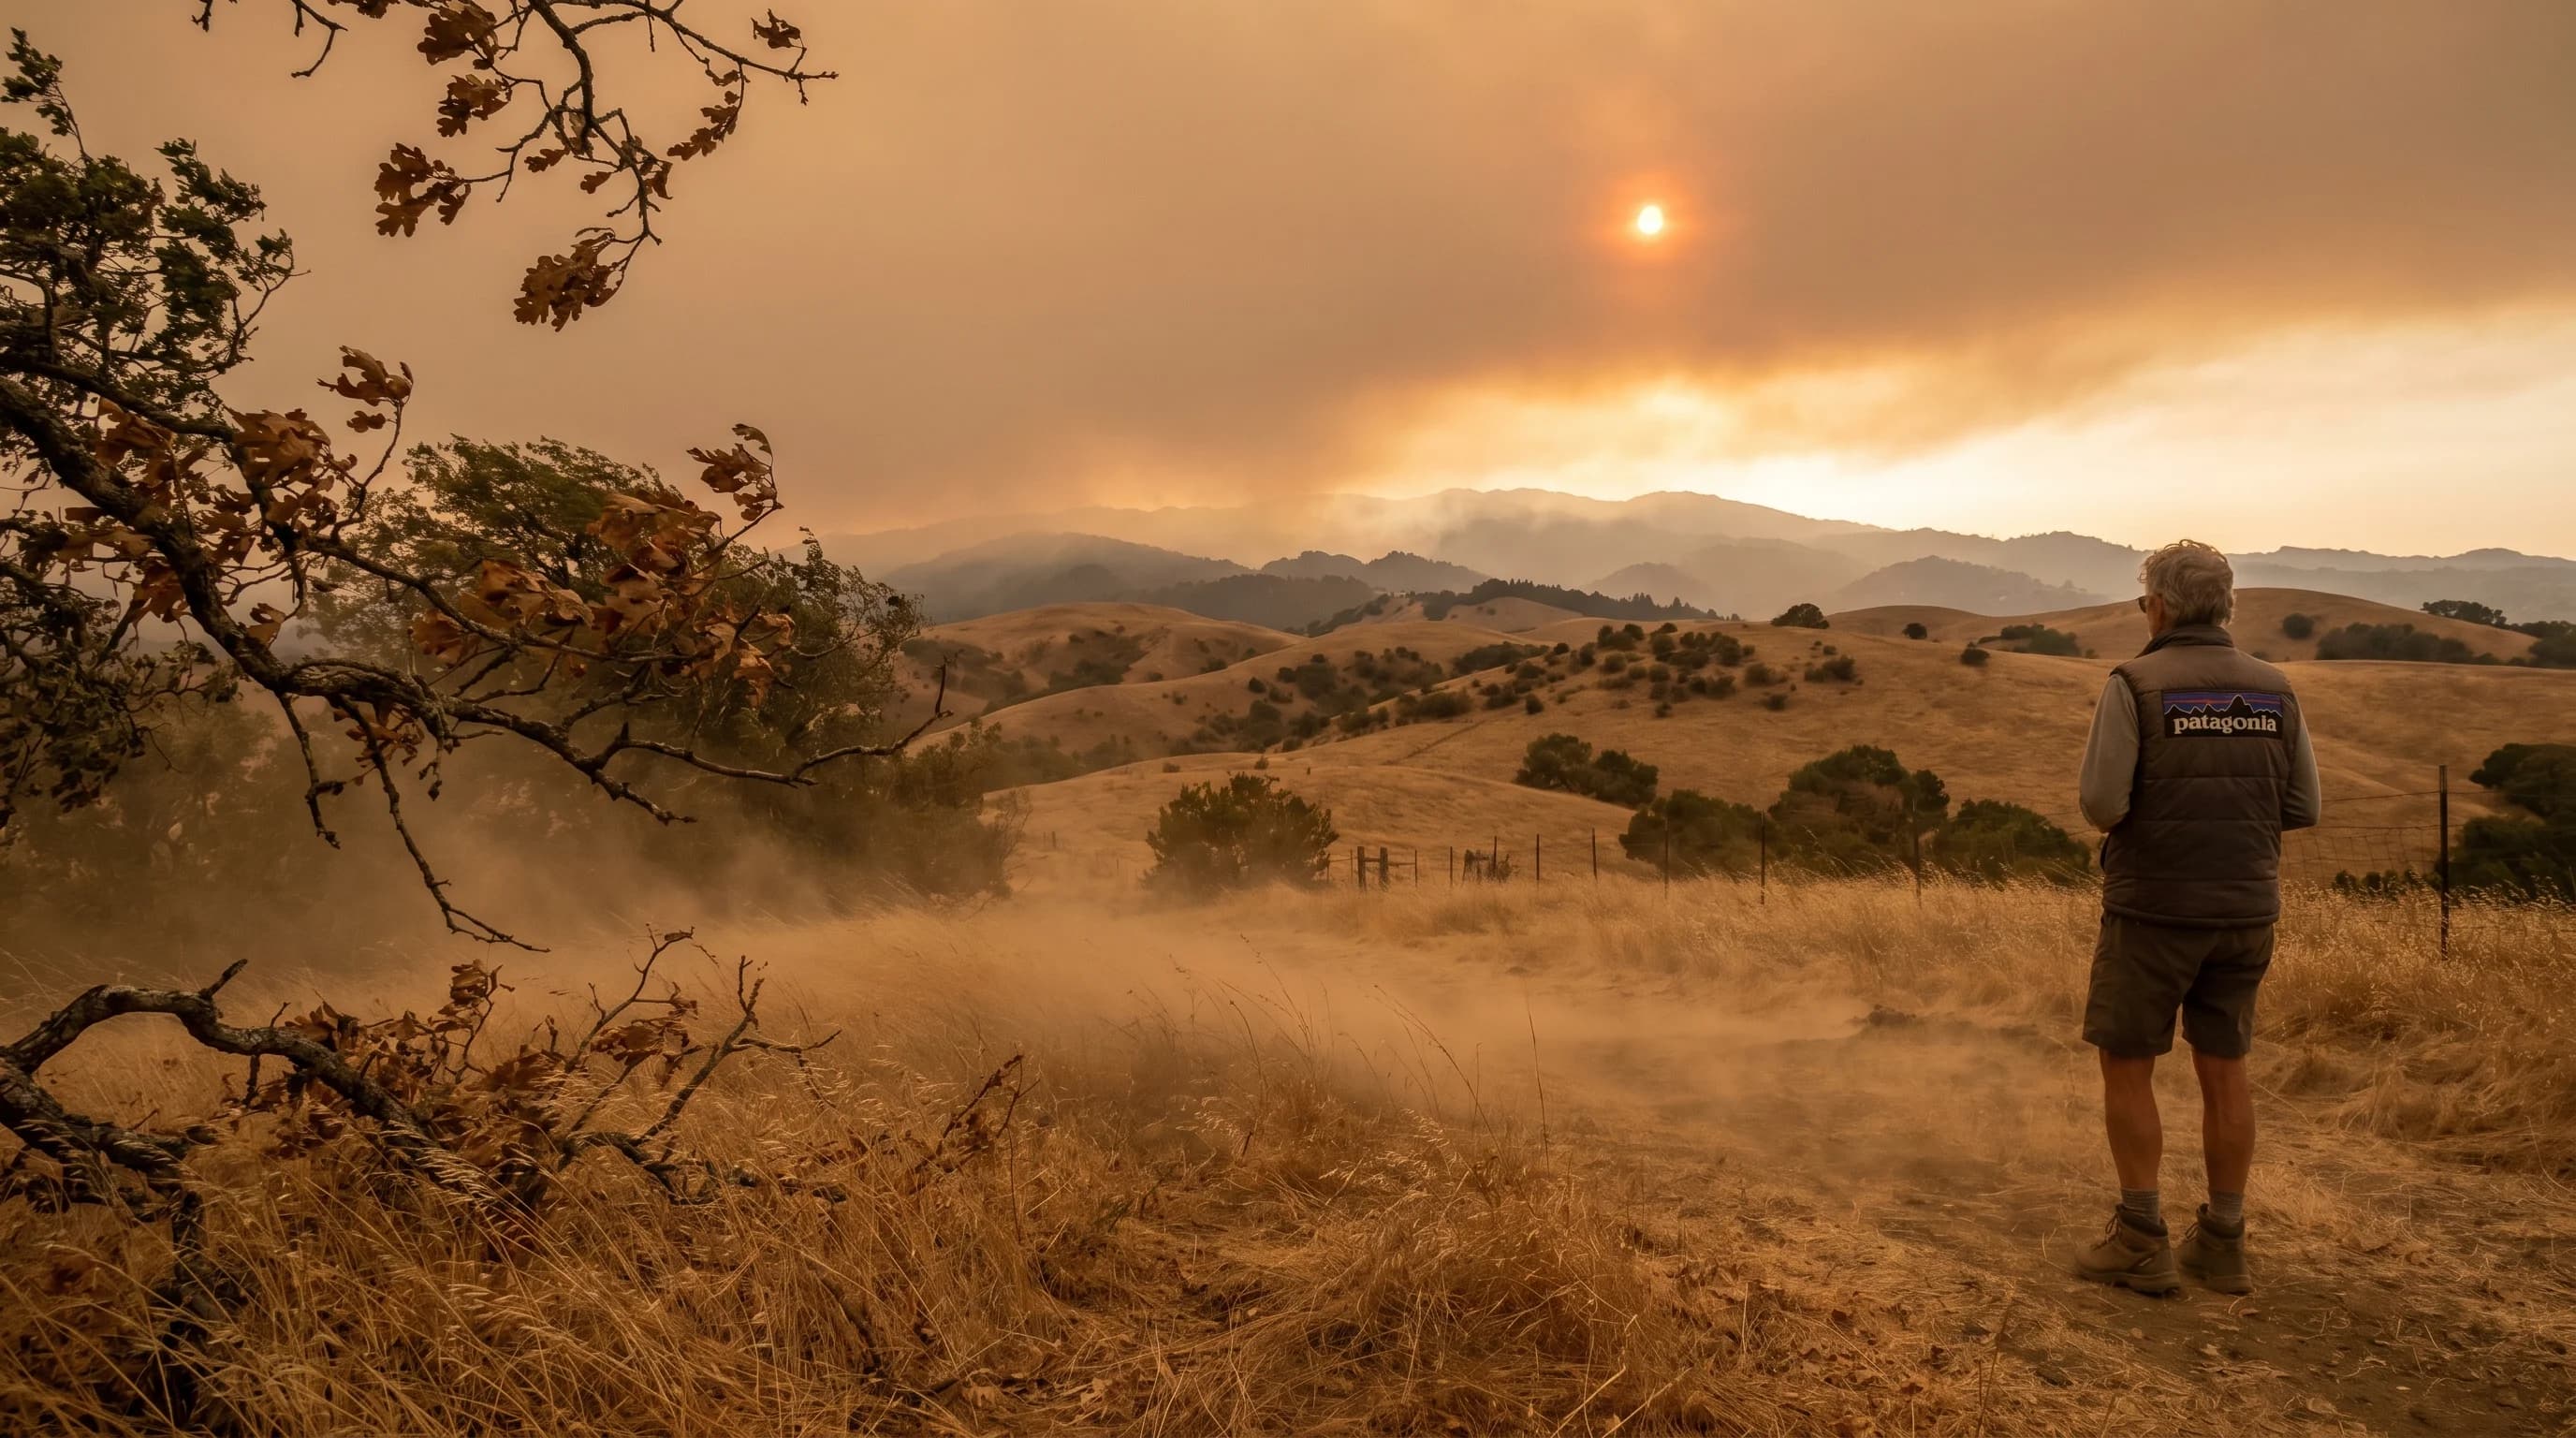
Diablo Winds are hot, dry, downslope winds that descend from the Sierra Nevada and Central Valley toward the coast, heating to 90-110°F and dropping humidity below 10%. They are the engine behind the Bay Area's most catastrophic wildfires.
6min read →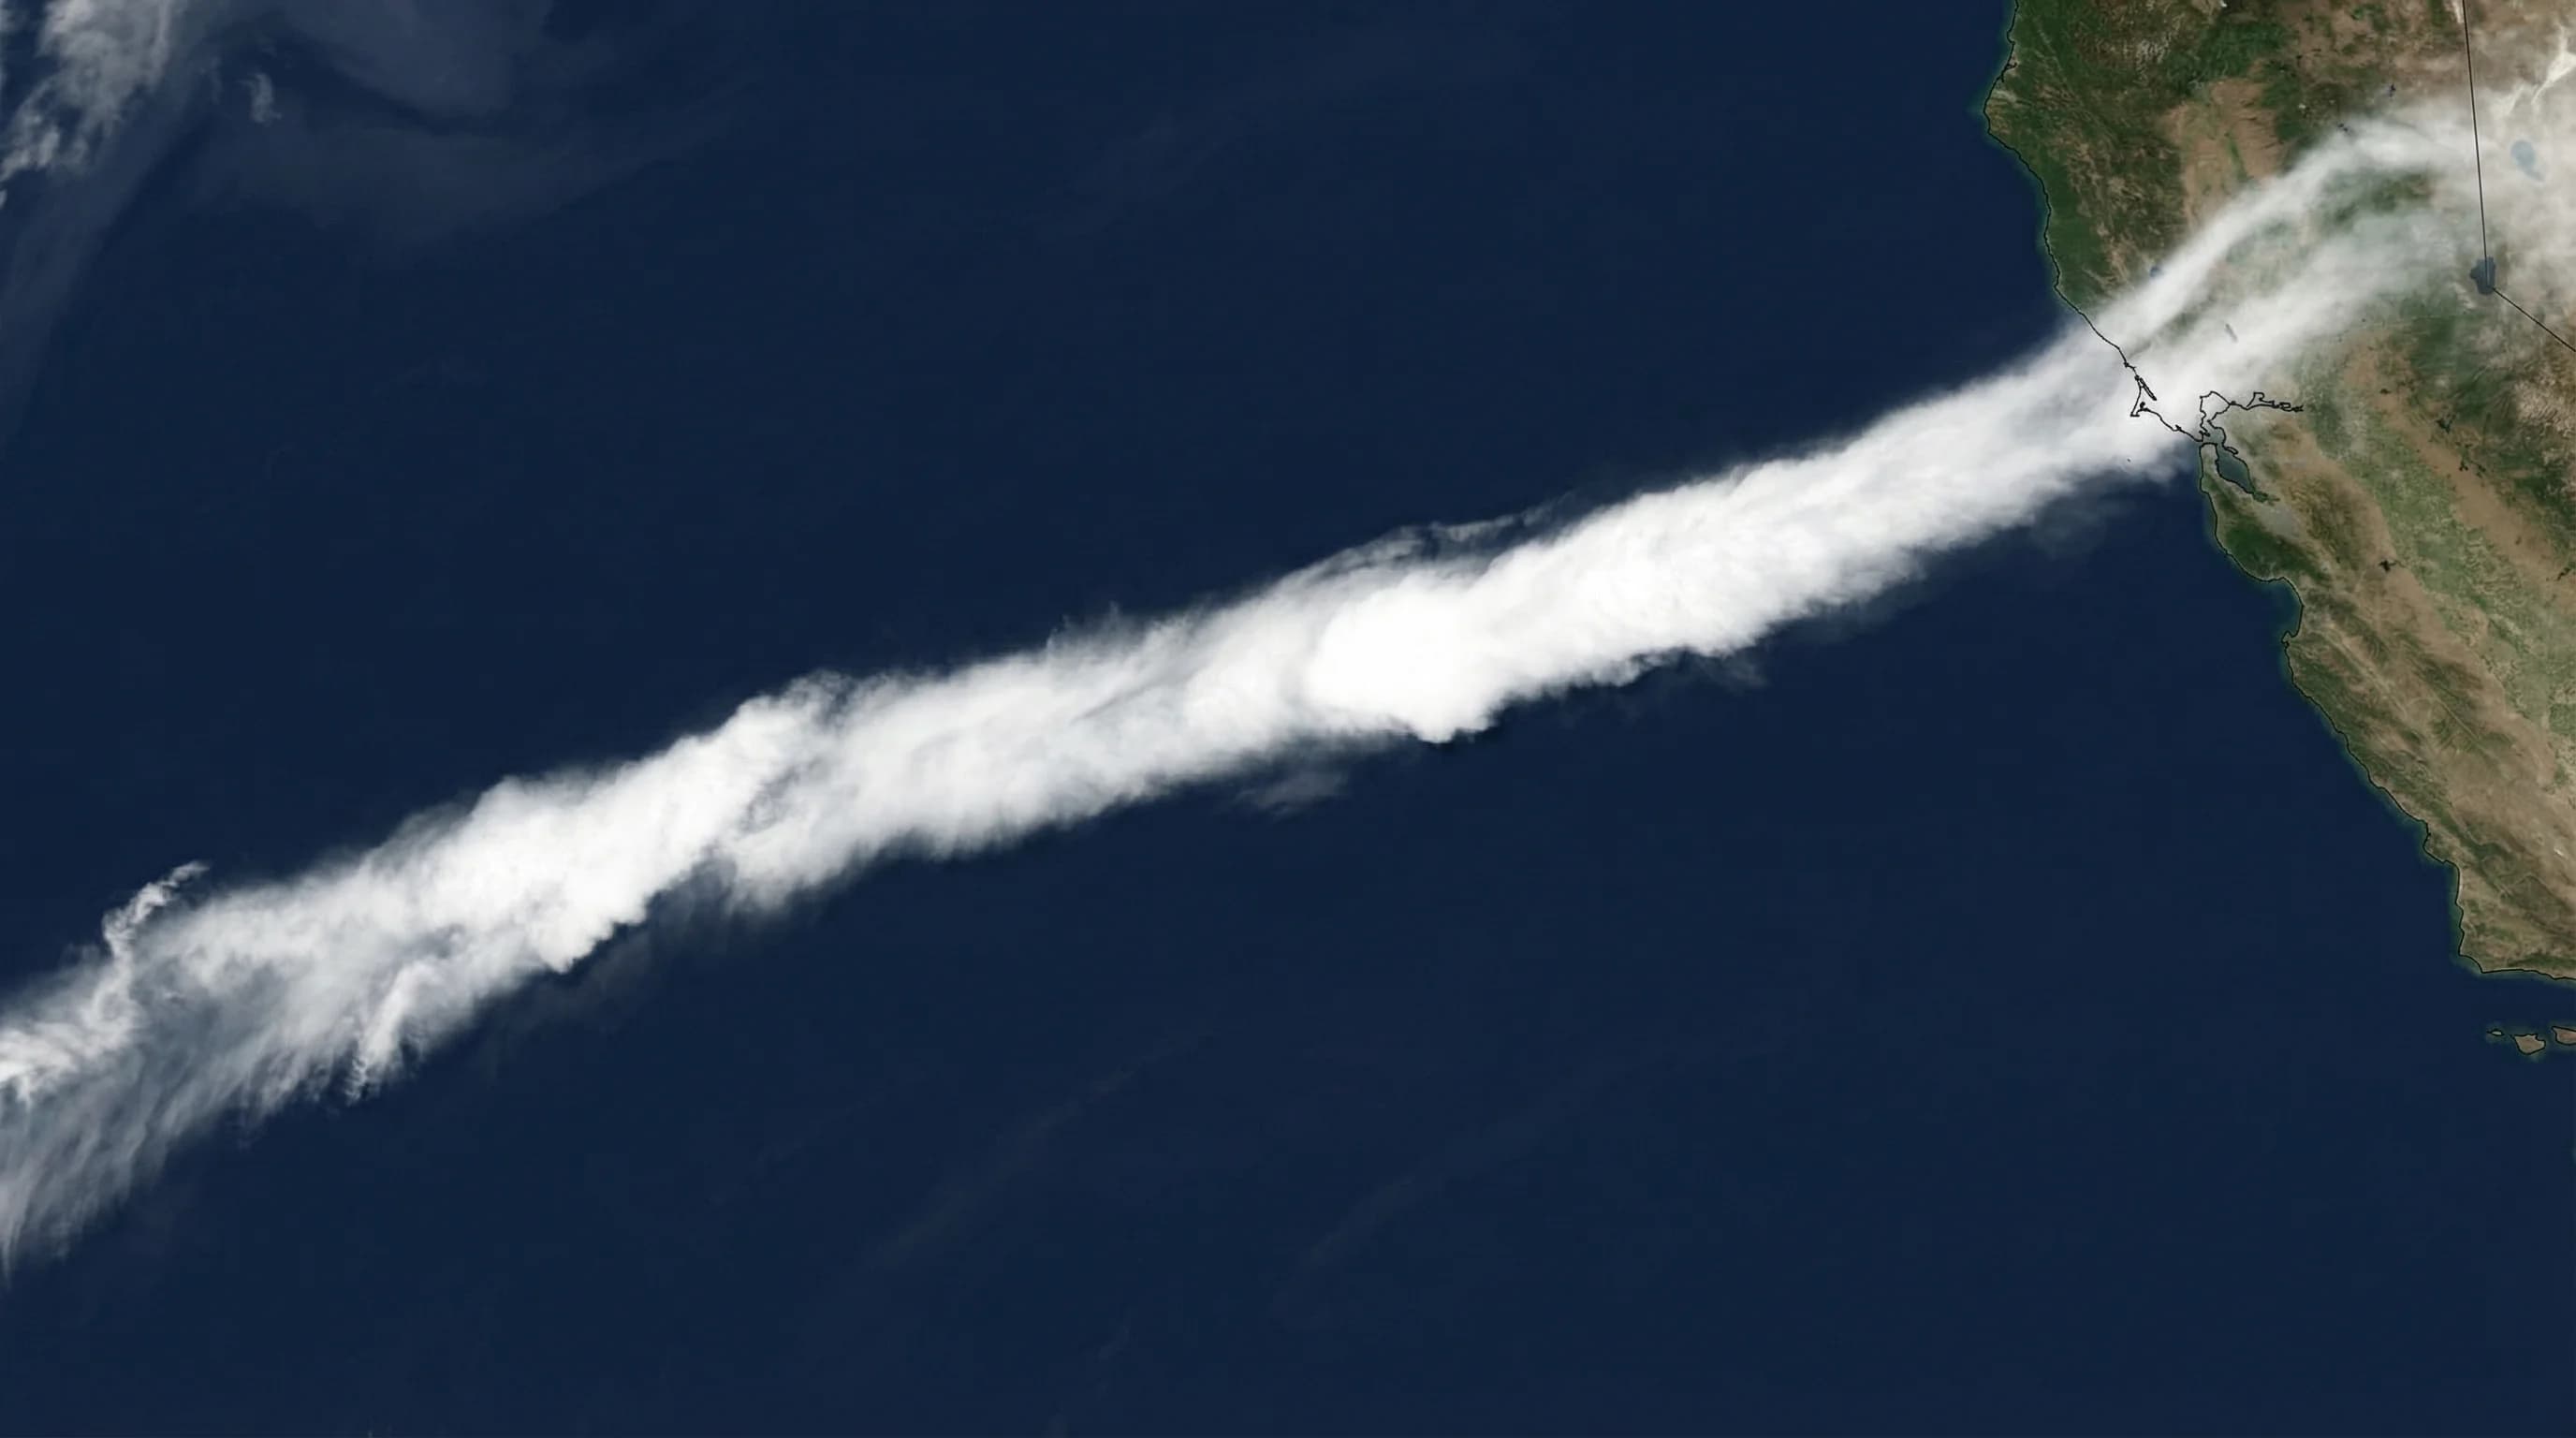
An atmospheric river is a narrow band of concentrated water vapor, a river of moisture in the sky. These systems carry more water than the Amazon River and can dump 10+ inches of rain in 24 hours.
6min read →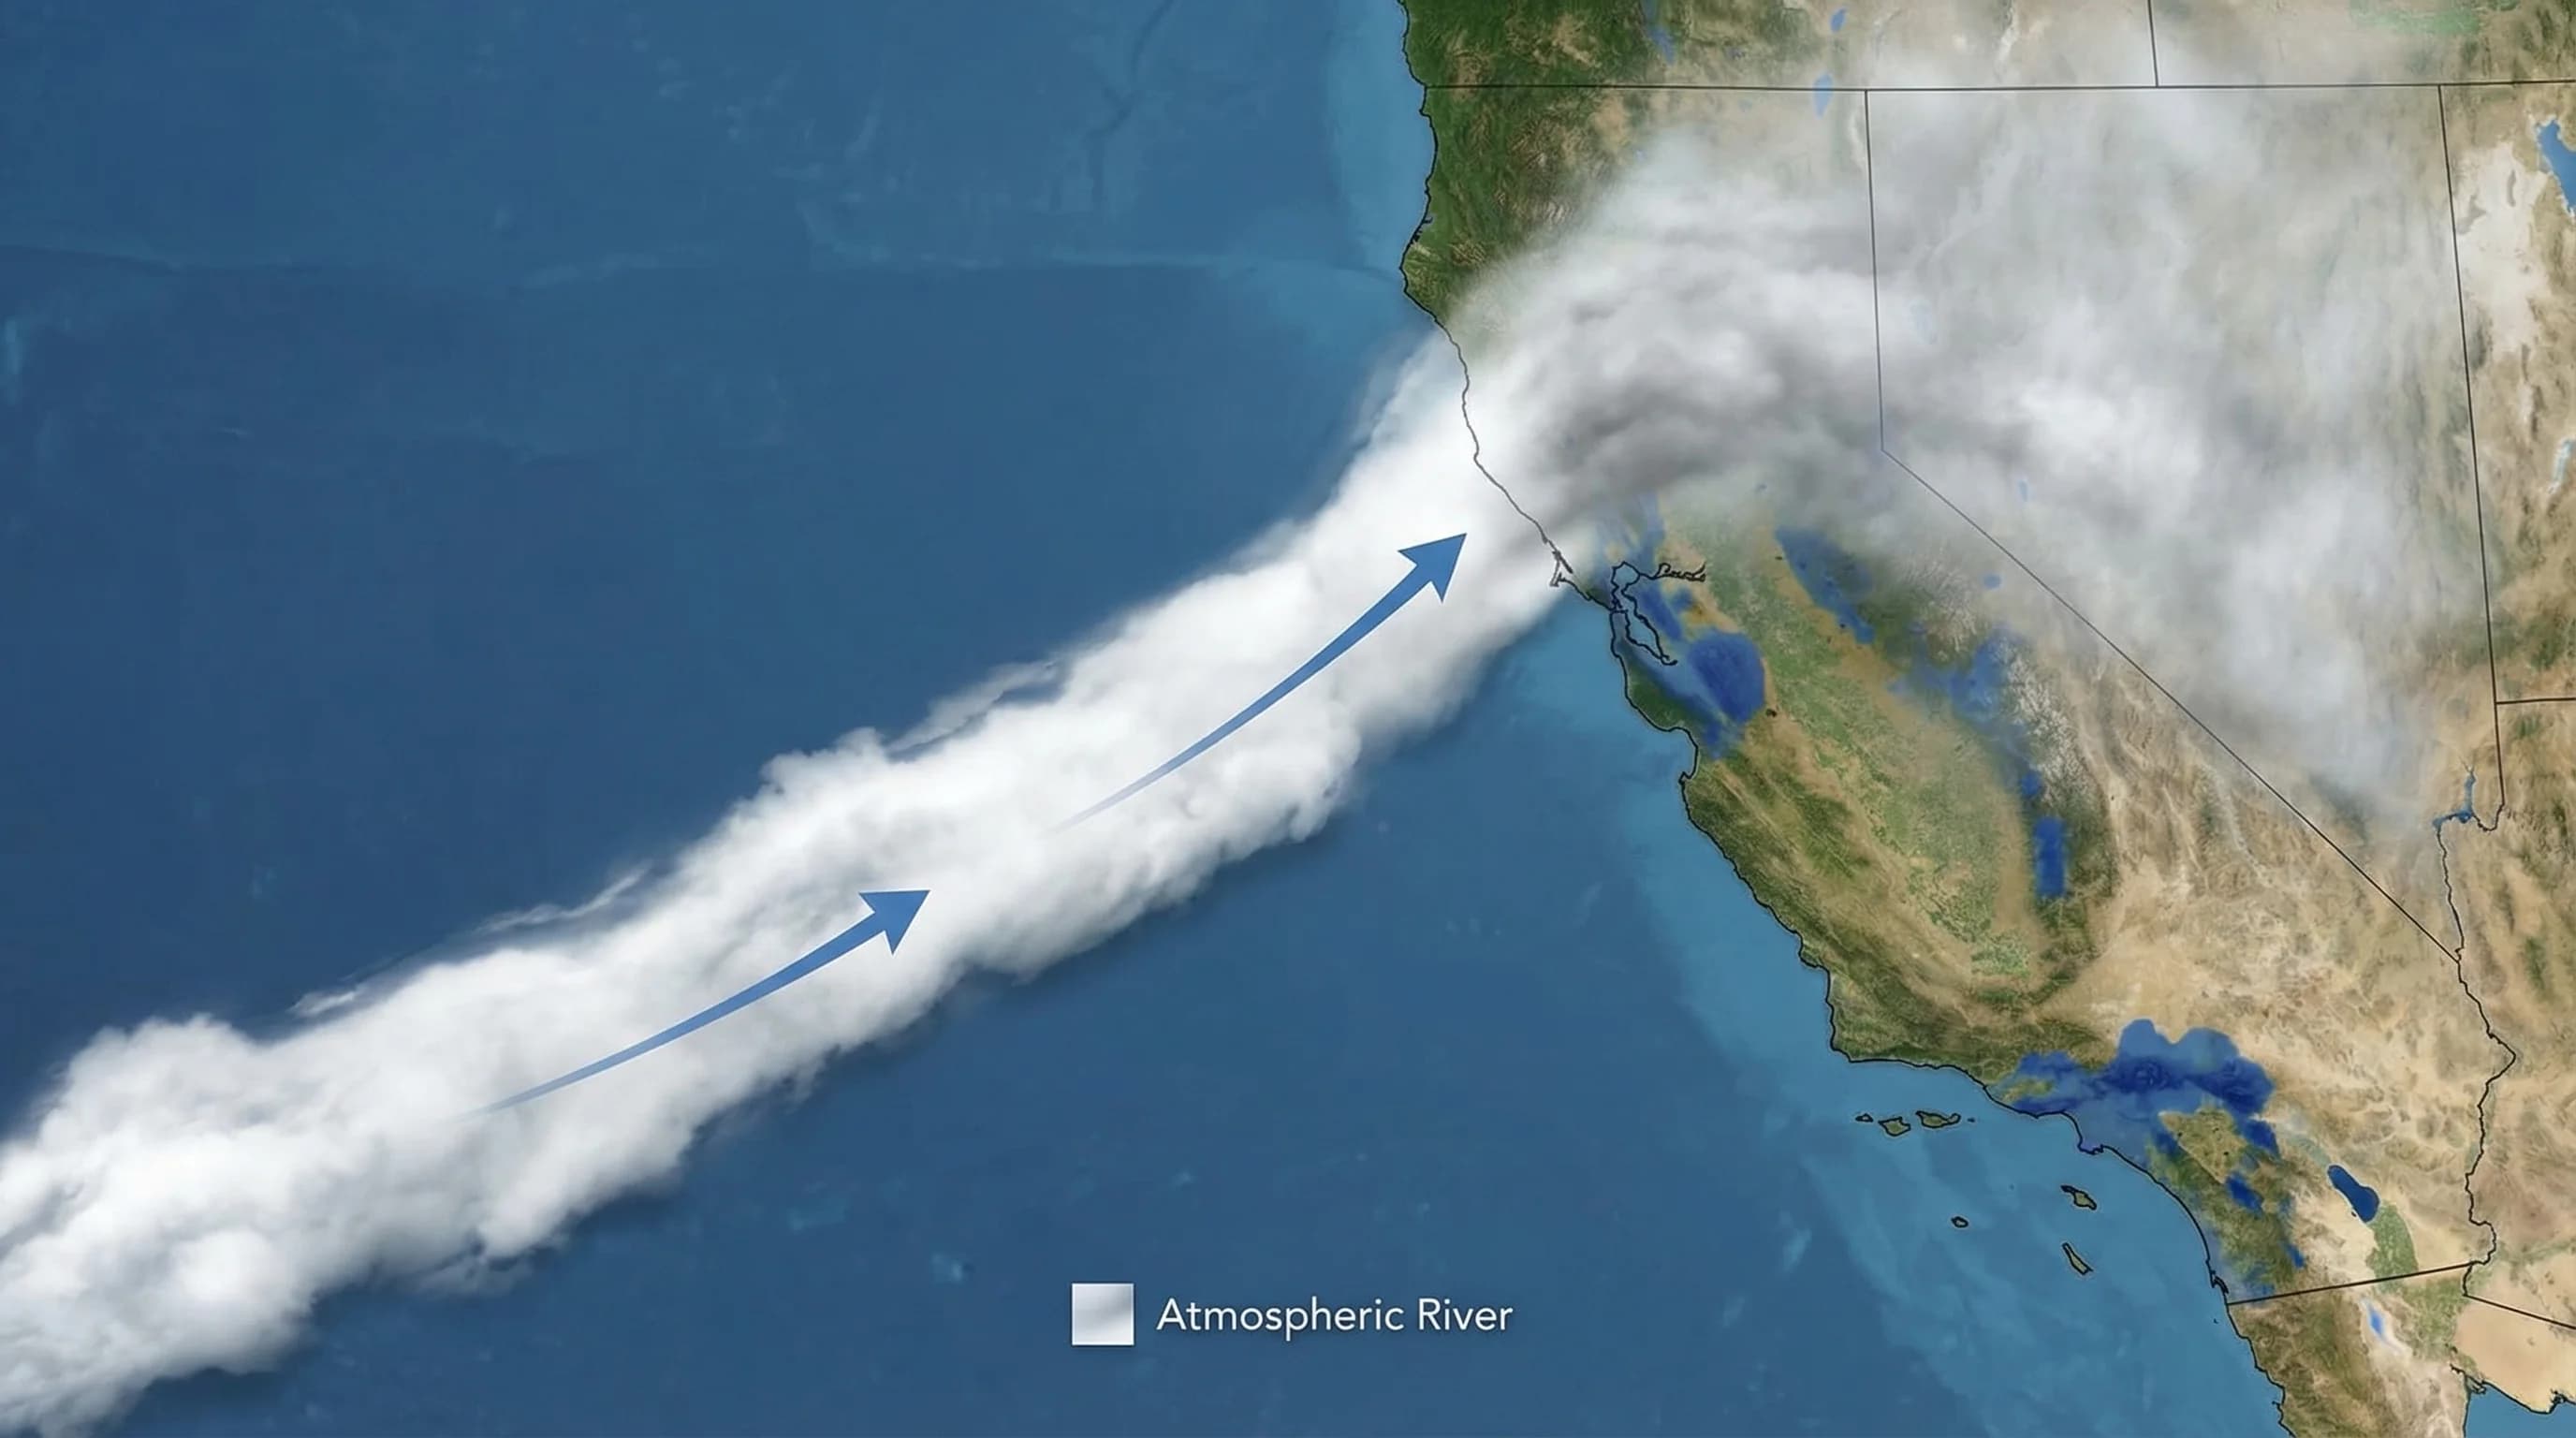
Atmospheric rivers are the primary cause of major flooding in the Bay Area, dumping 5-15 inches in 1-3 days. Here is what you need to know about where they hit hardest and how to prepare.
7min read →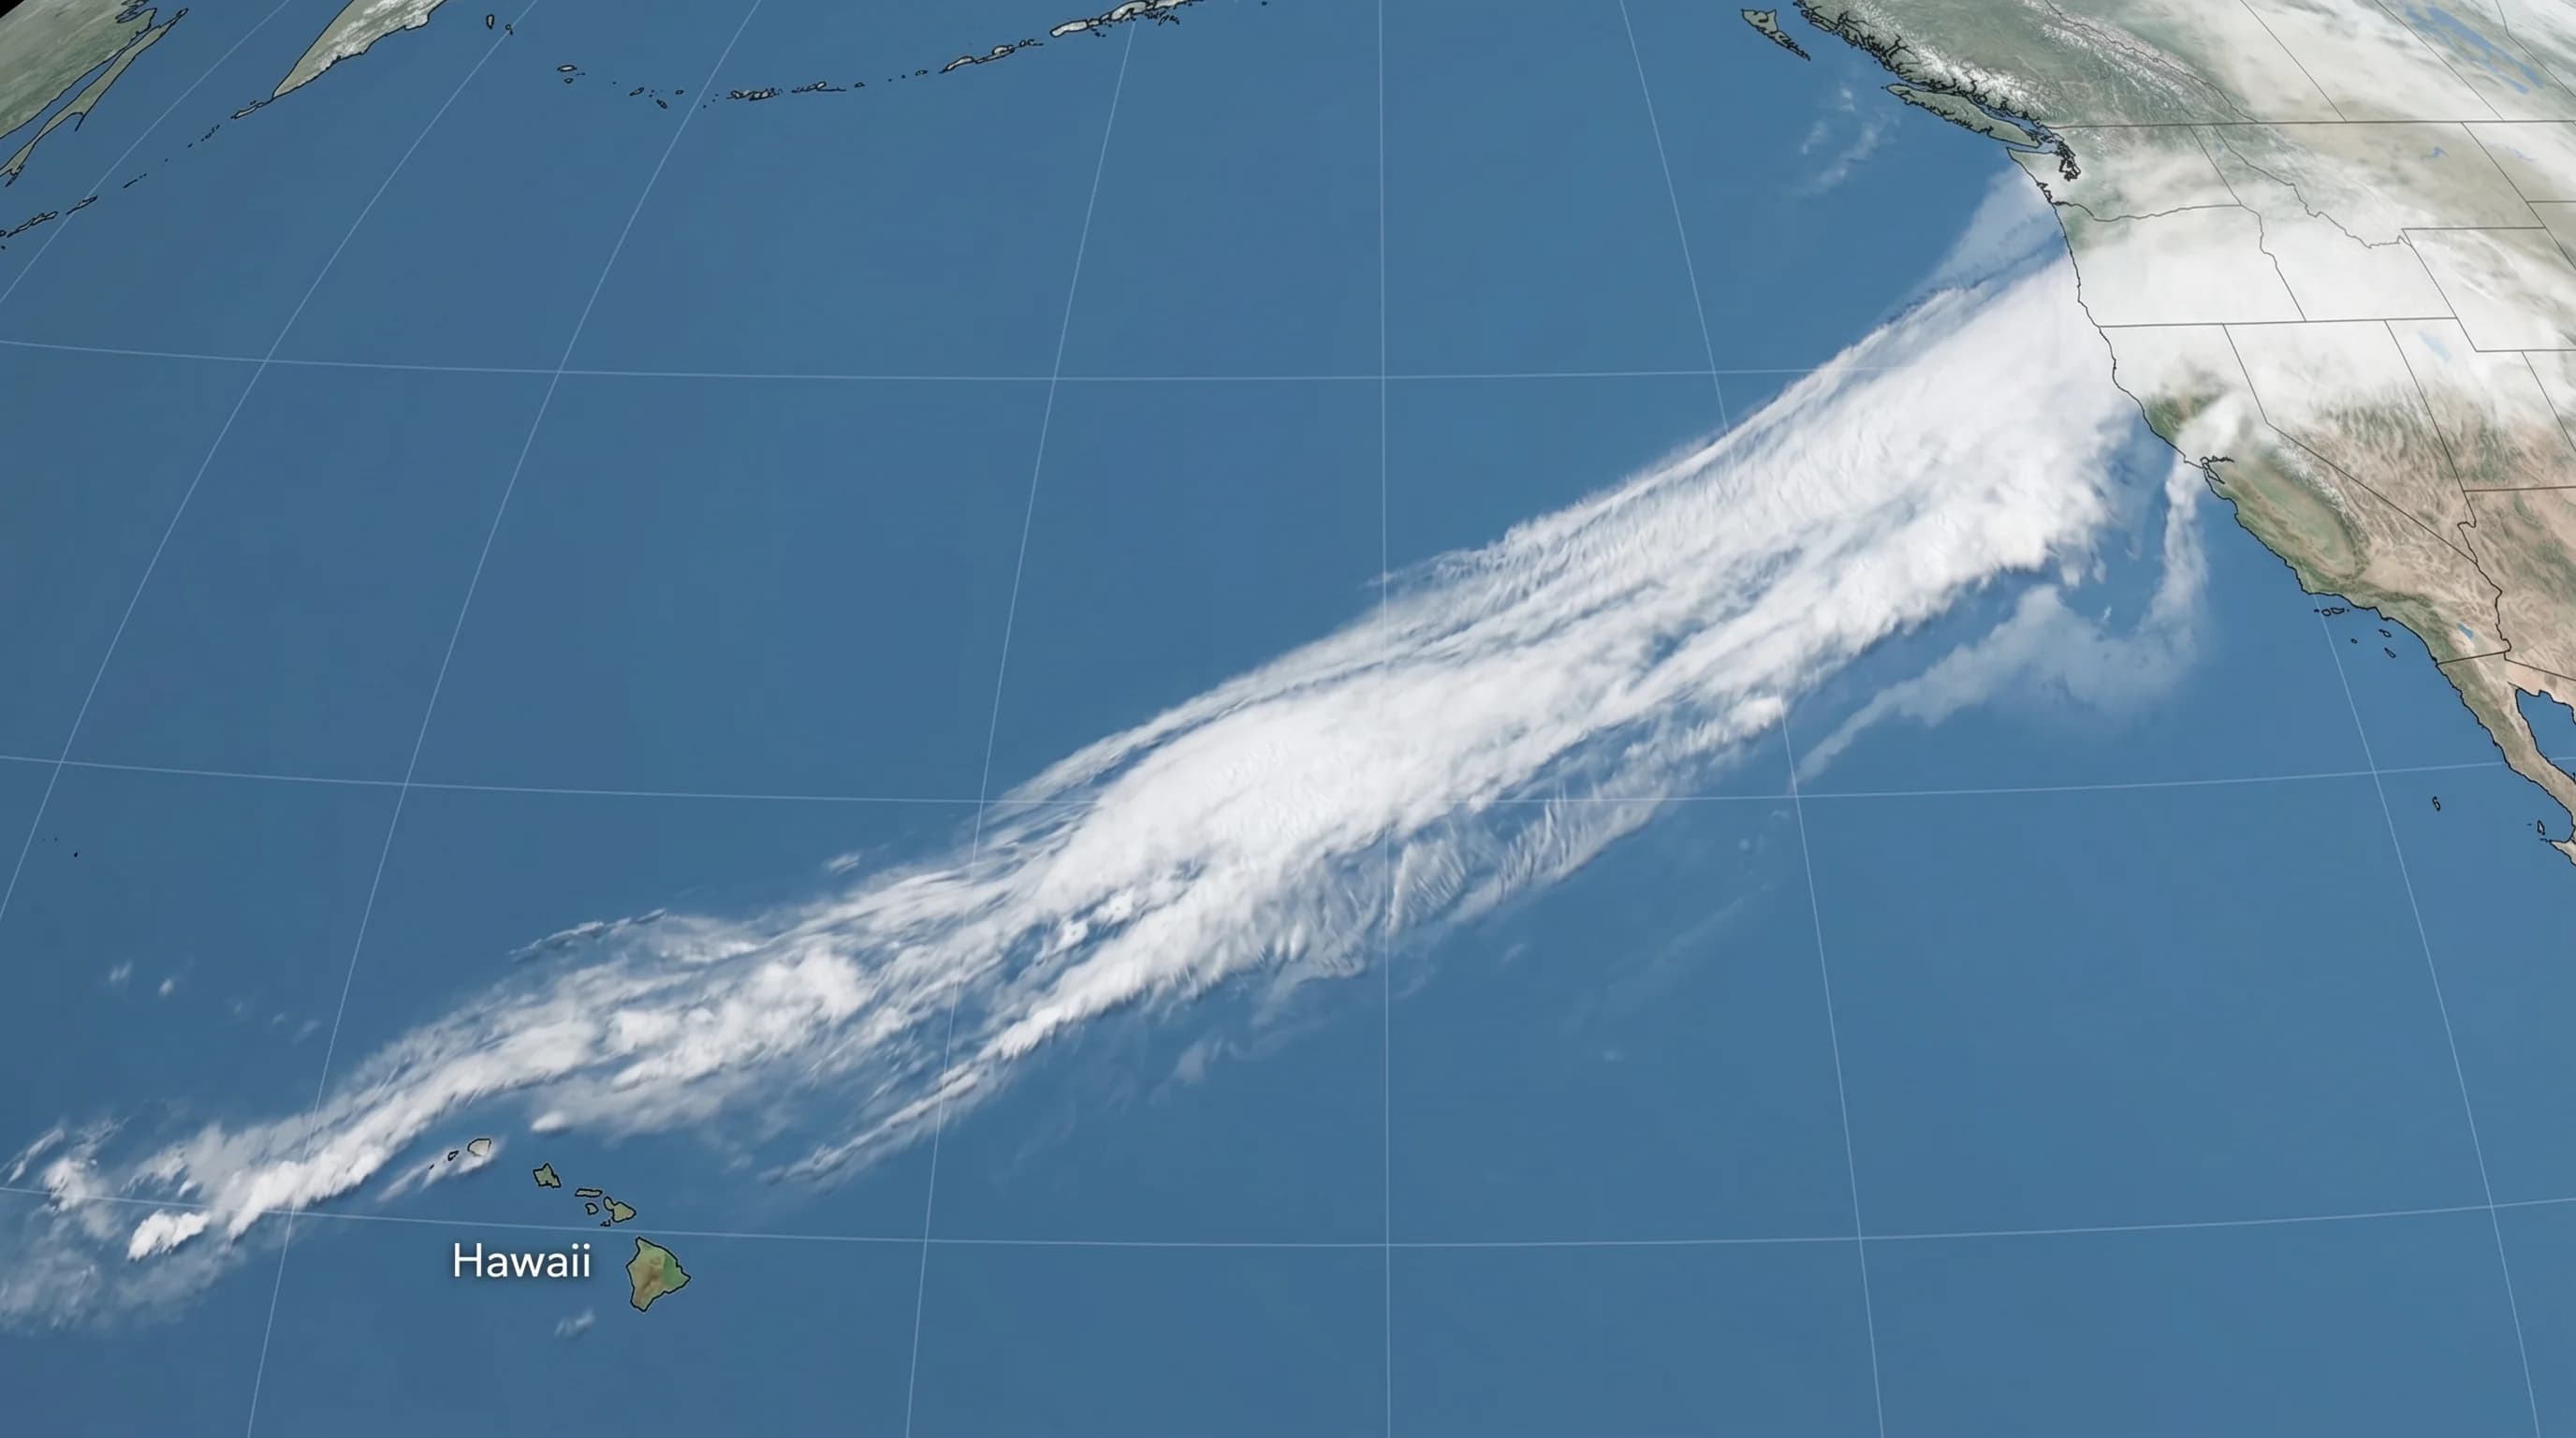
A Pineapple Express is an atmospheric river originating near Hawaii, carrying warm tropical moisture directly to California at jet-stream speed. These storms are responsible for some of California's most dramatic winter floods.
6min read →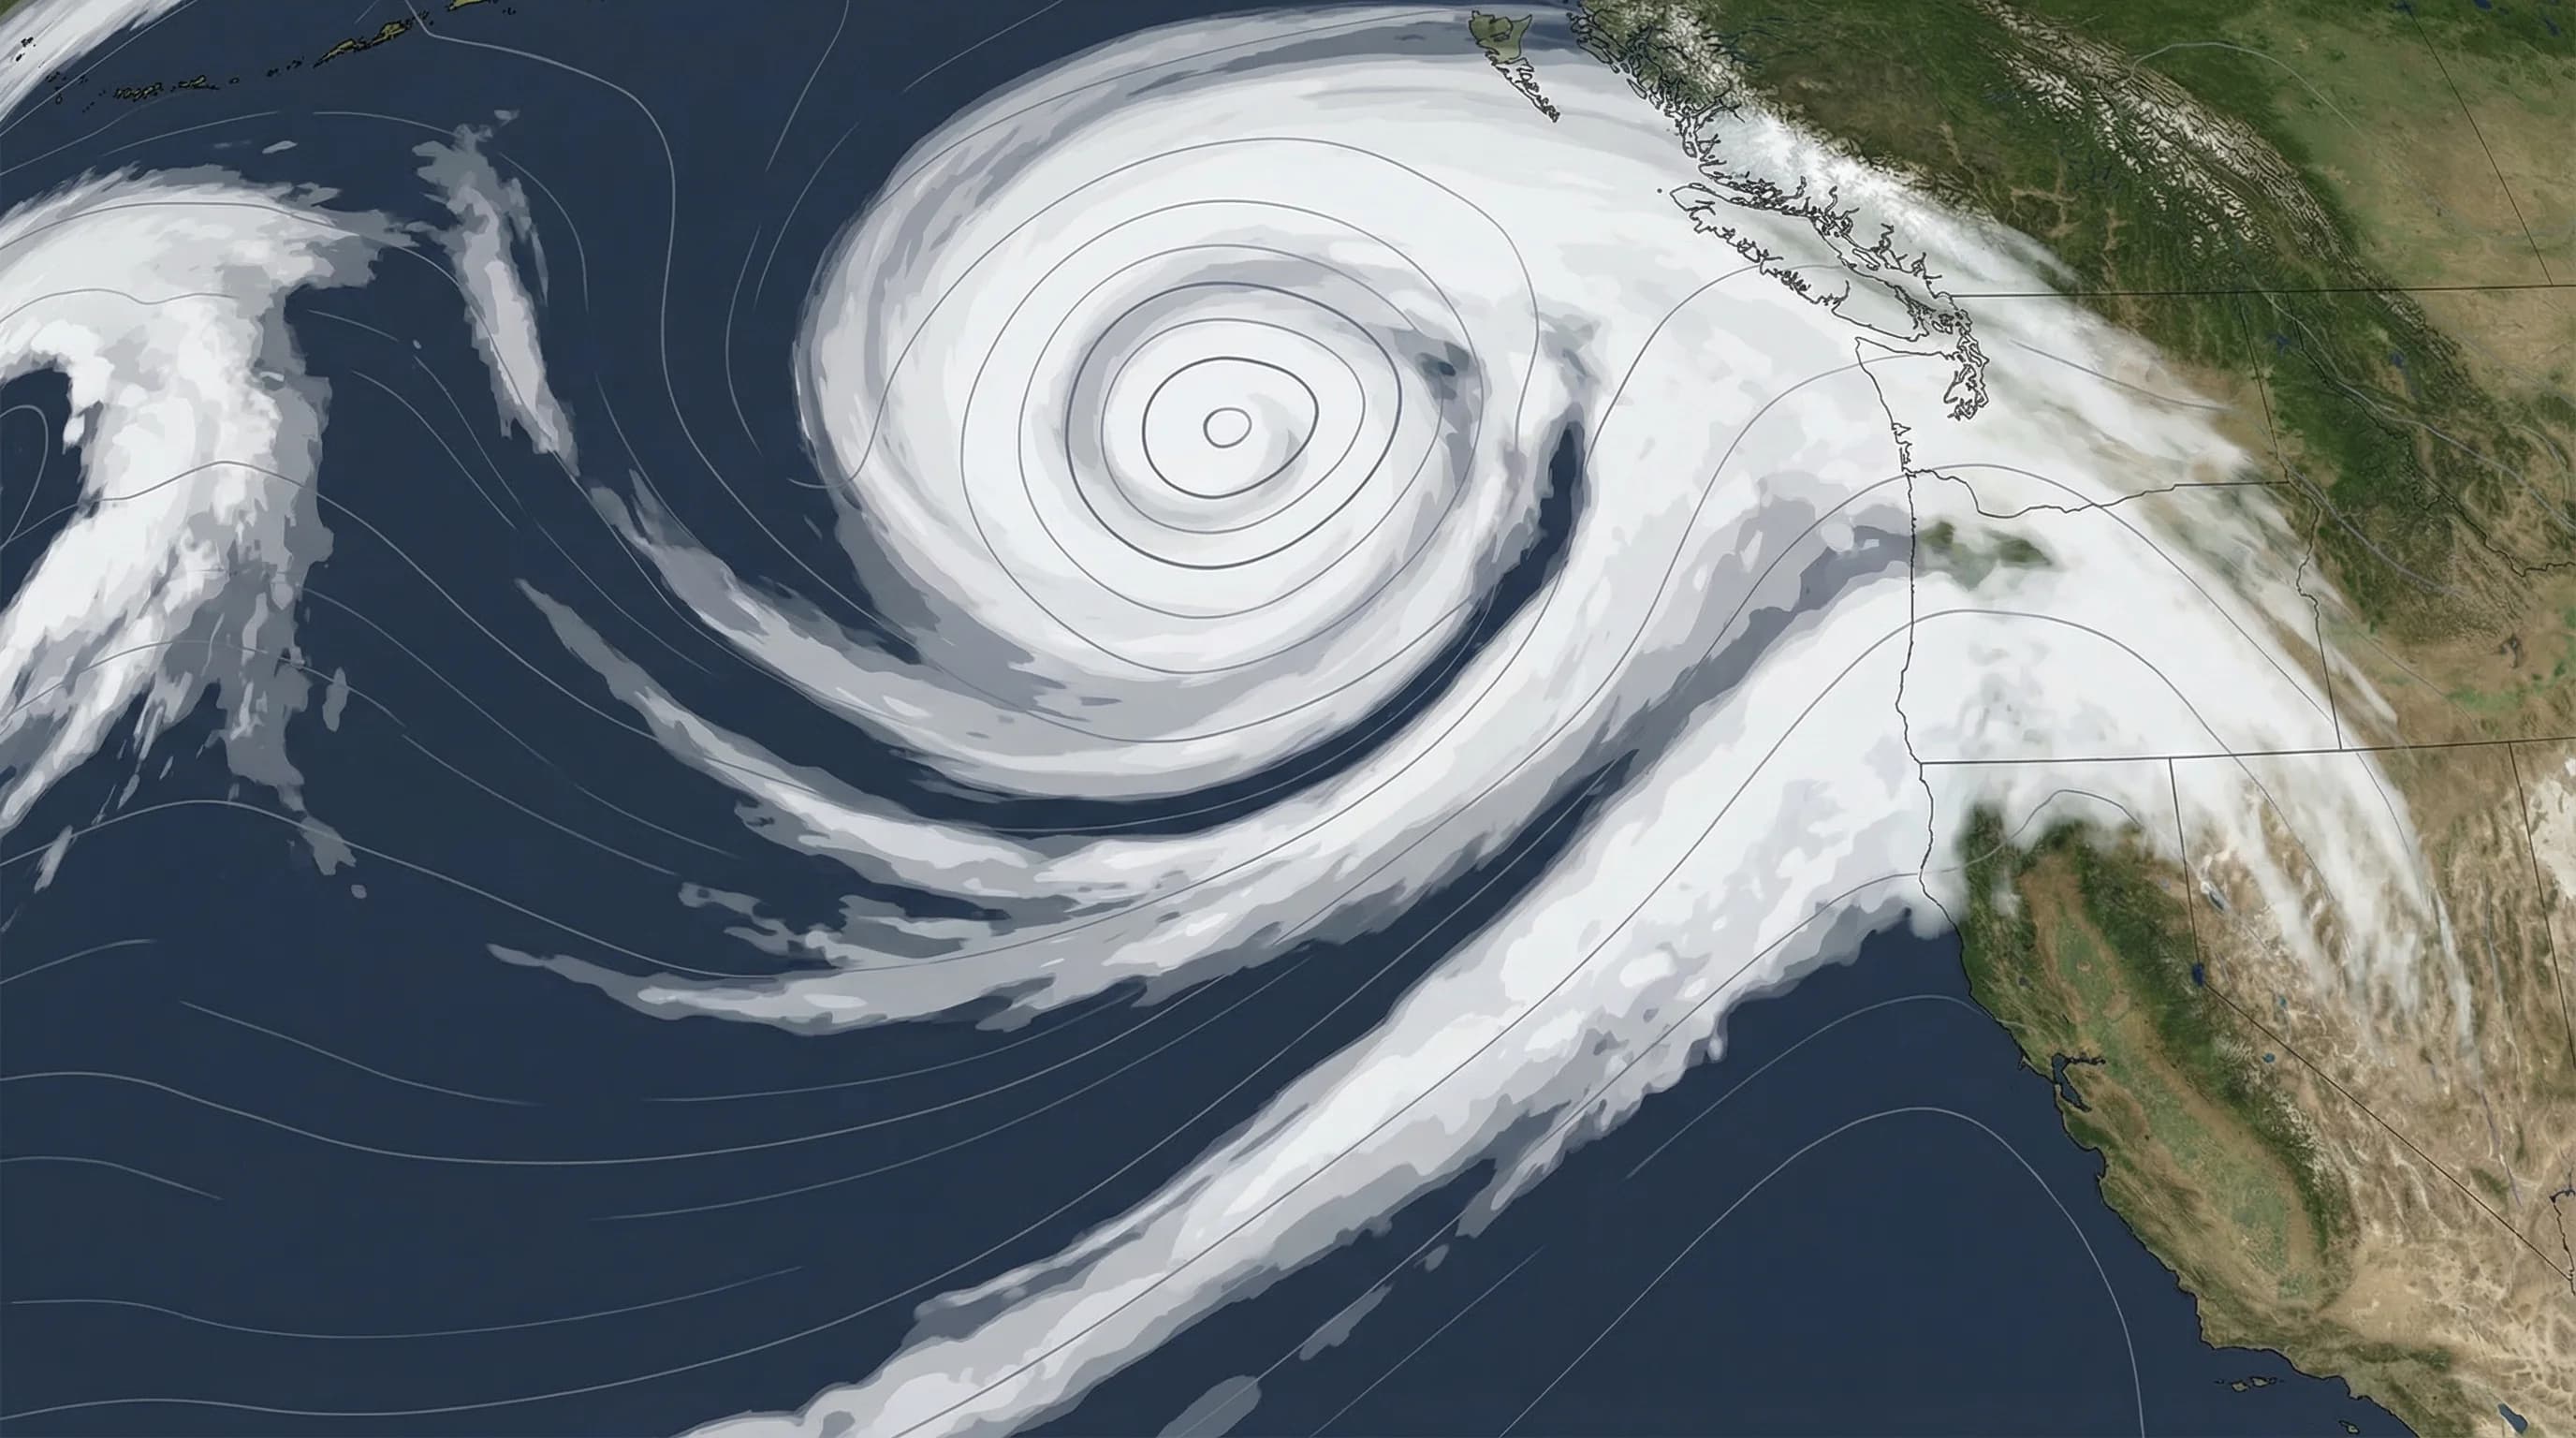
Bomb cyclones are storms that intensify at extraordinary speed, sometimes dropping 24+ millibars of pressure in a single day. When they hit the Bay Area, the results include record rainfall, 80 mph gusts, and severe flooding.
7min read →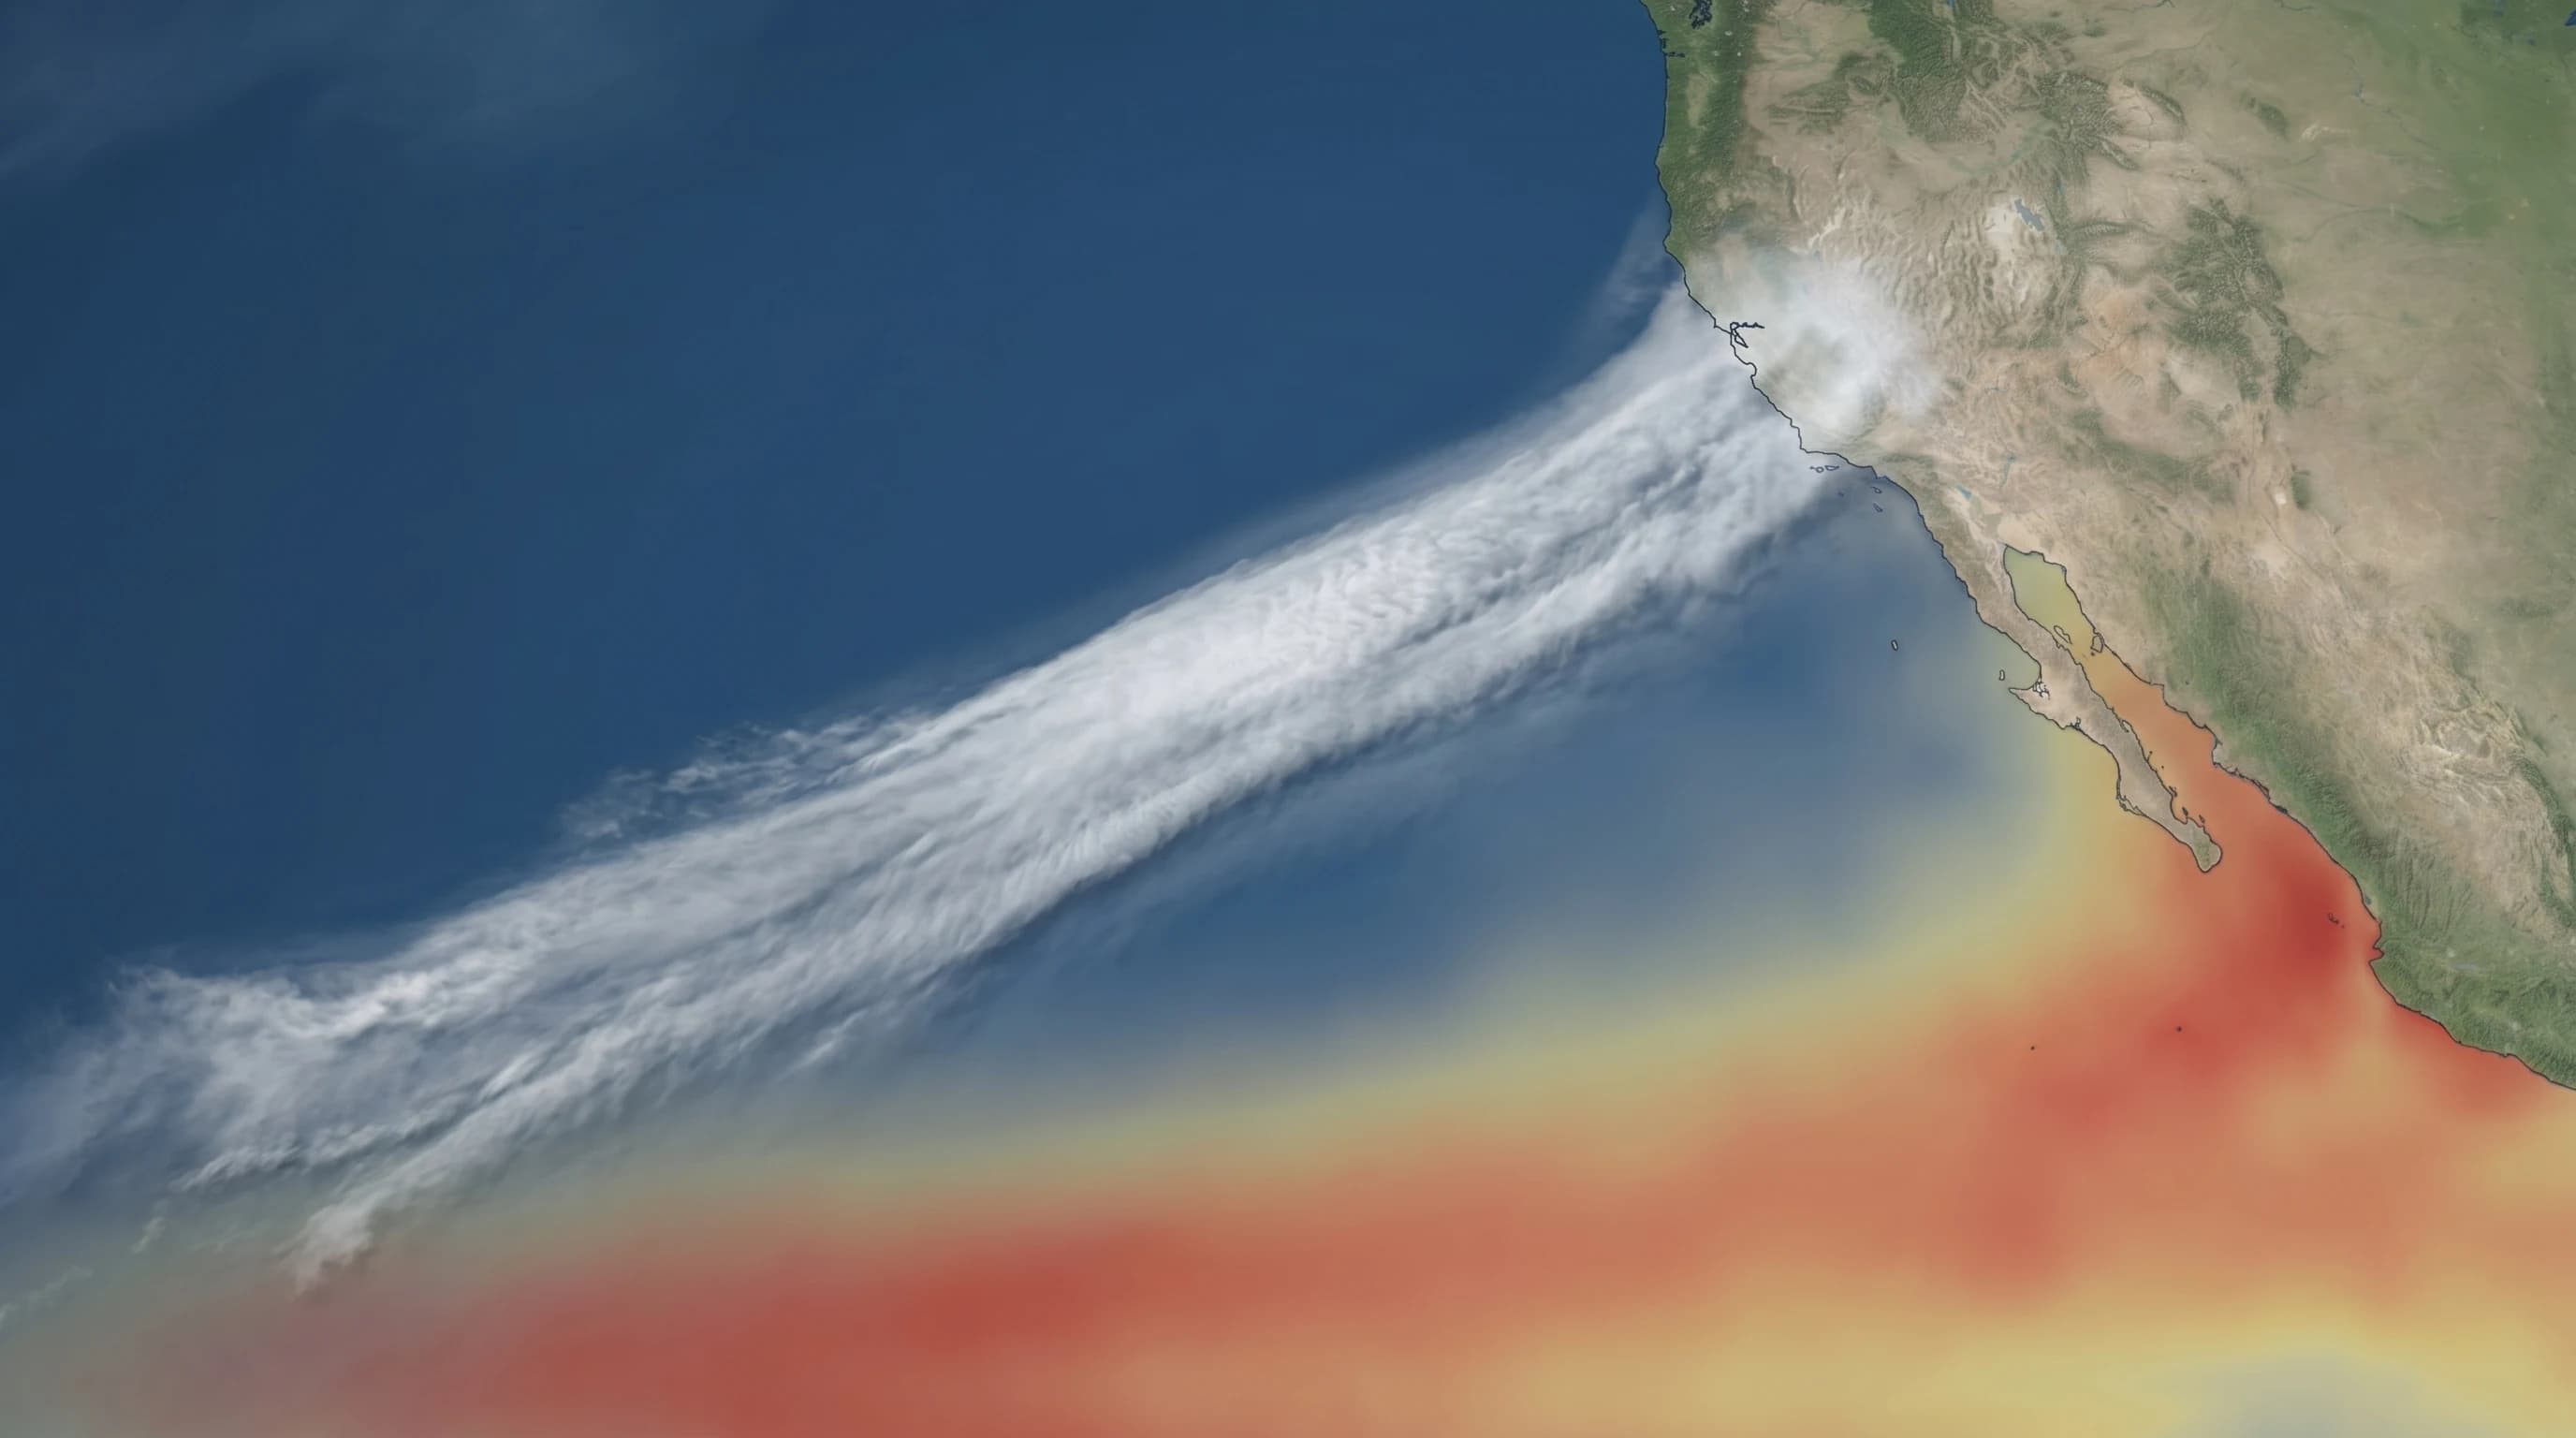
El Nino is back in 2026, but Bay Area impacts are about probabilities, not promises. Past El Ninos brought everything from damaging floods to underwhelming Northern California rain years.
8min read →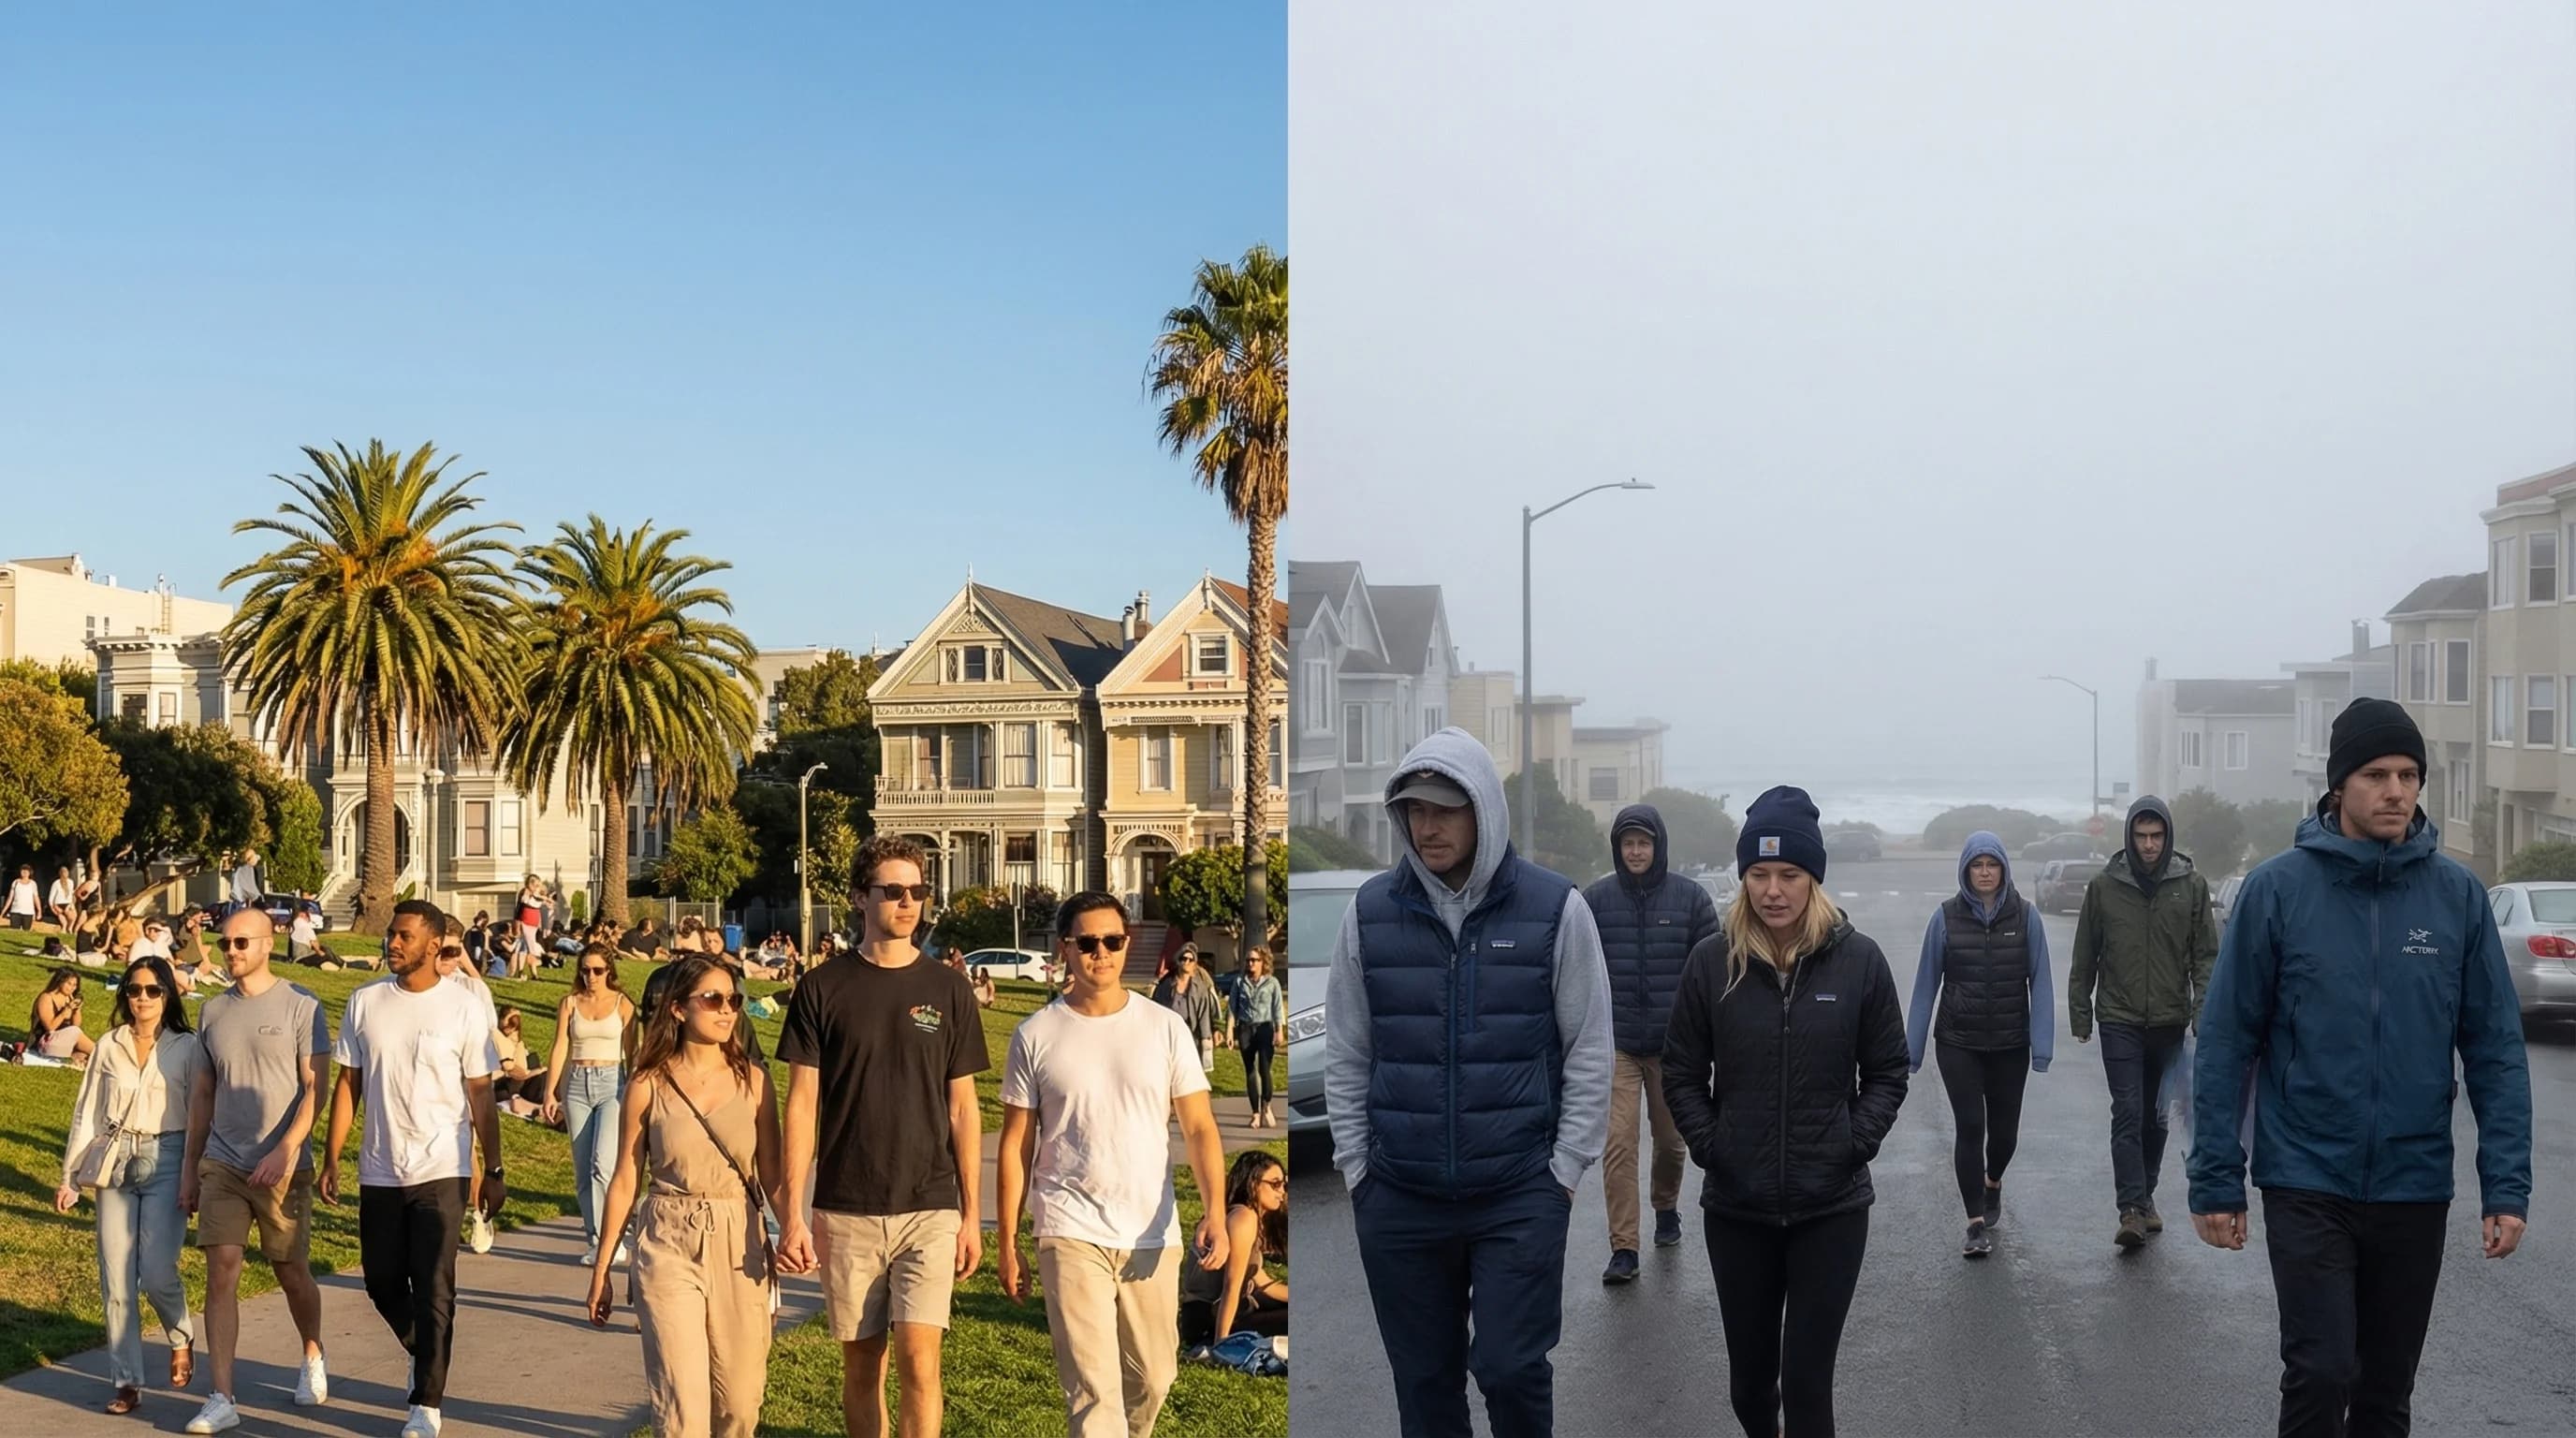
The Mission and Castro can be 20 degrees warmer than the Outer Sunset on the same afternoon. San Francisco's hills and geography create distinct microclimates across its neighborhoods.
8min read →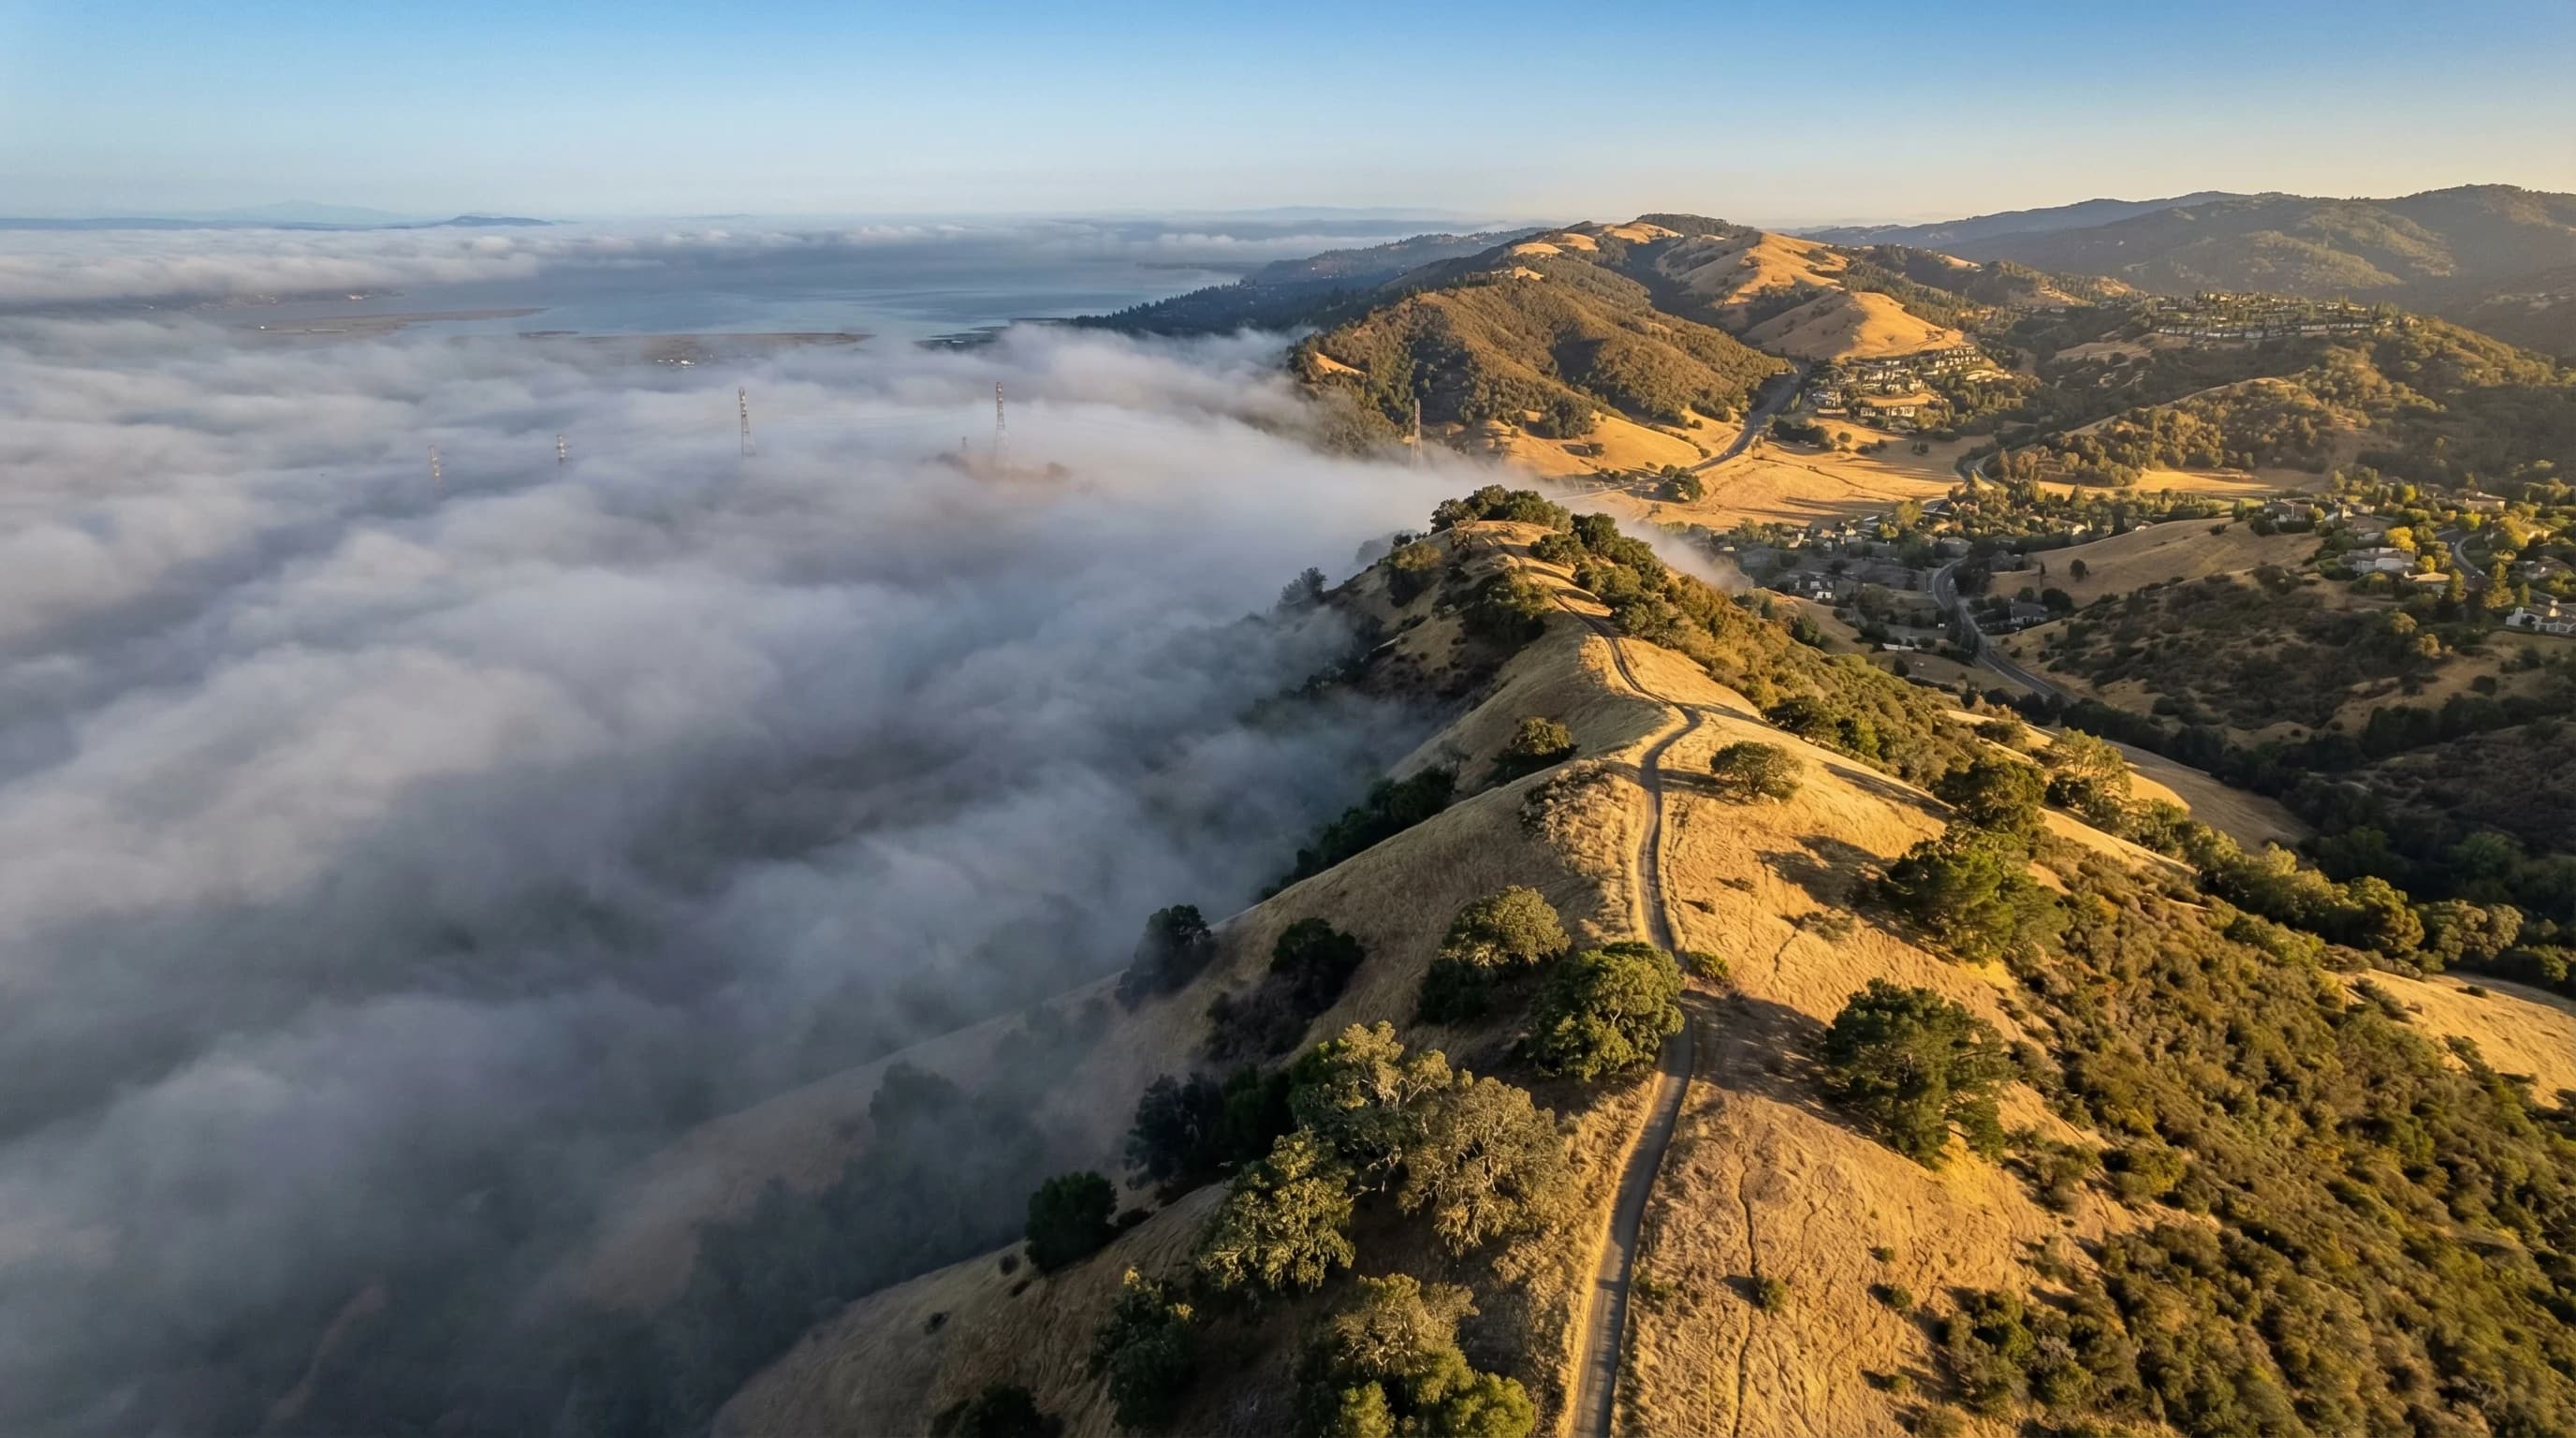
The Berkeley Hills split the East Bay into two climate zones. Berkeley's flatlands sit in the marine layer while Orinda and Lafayette on the other side regularly hit 90-100°F. The distance between them is less than 8 miles.
7min read →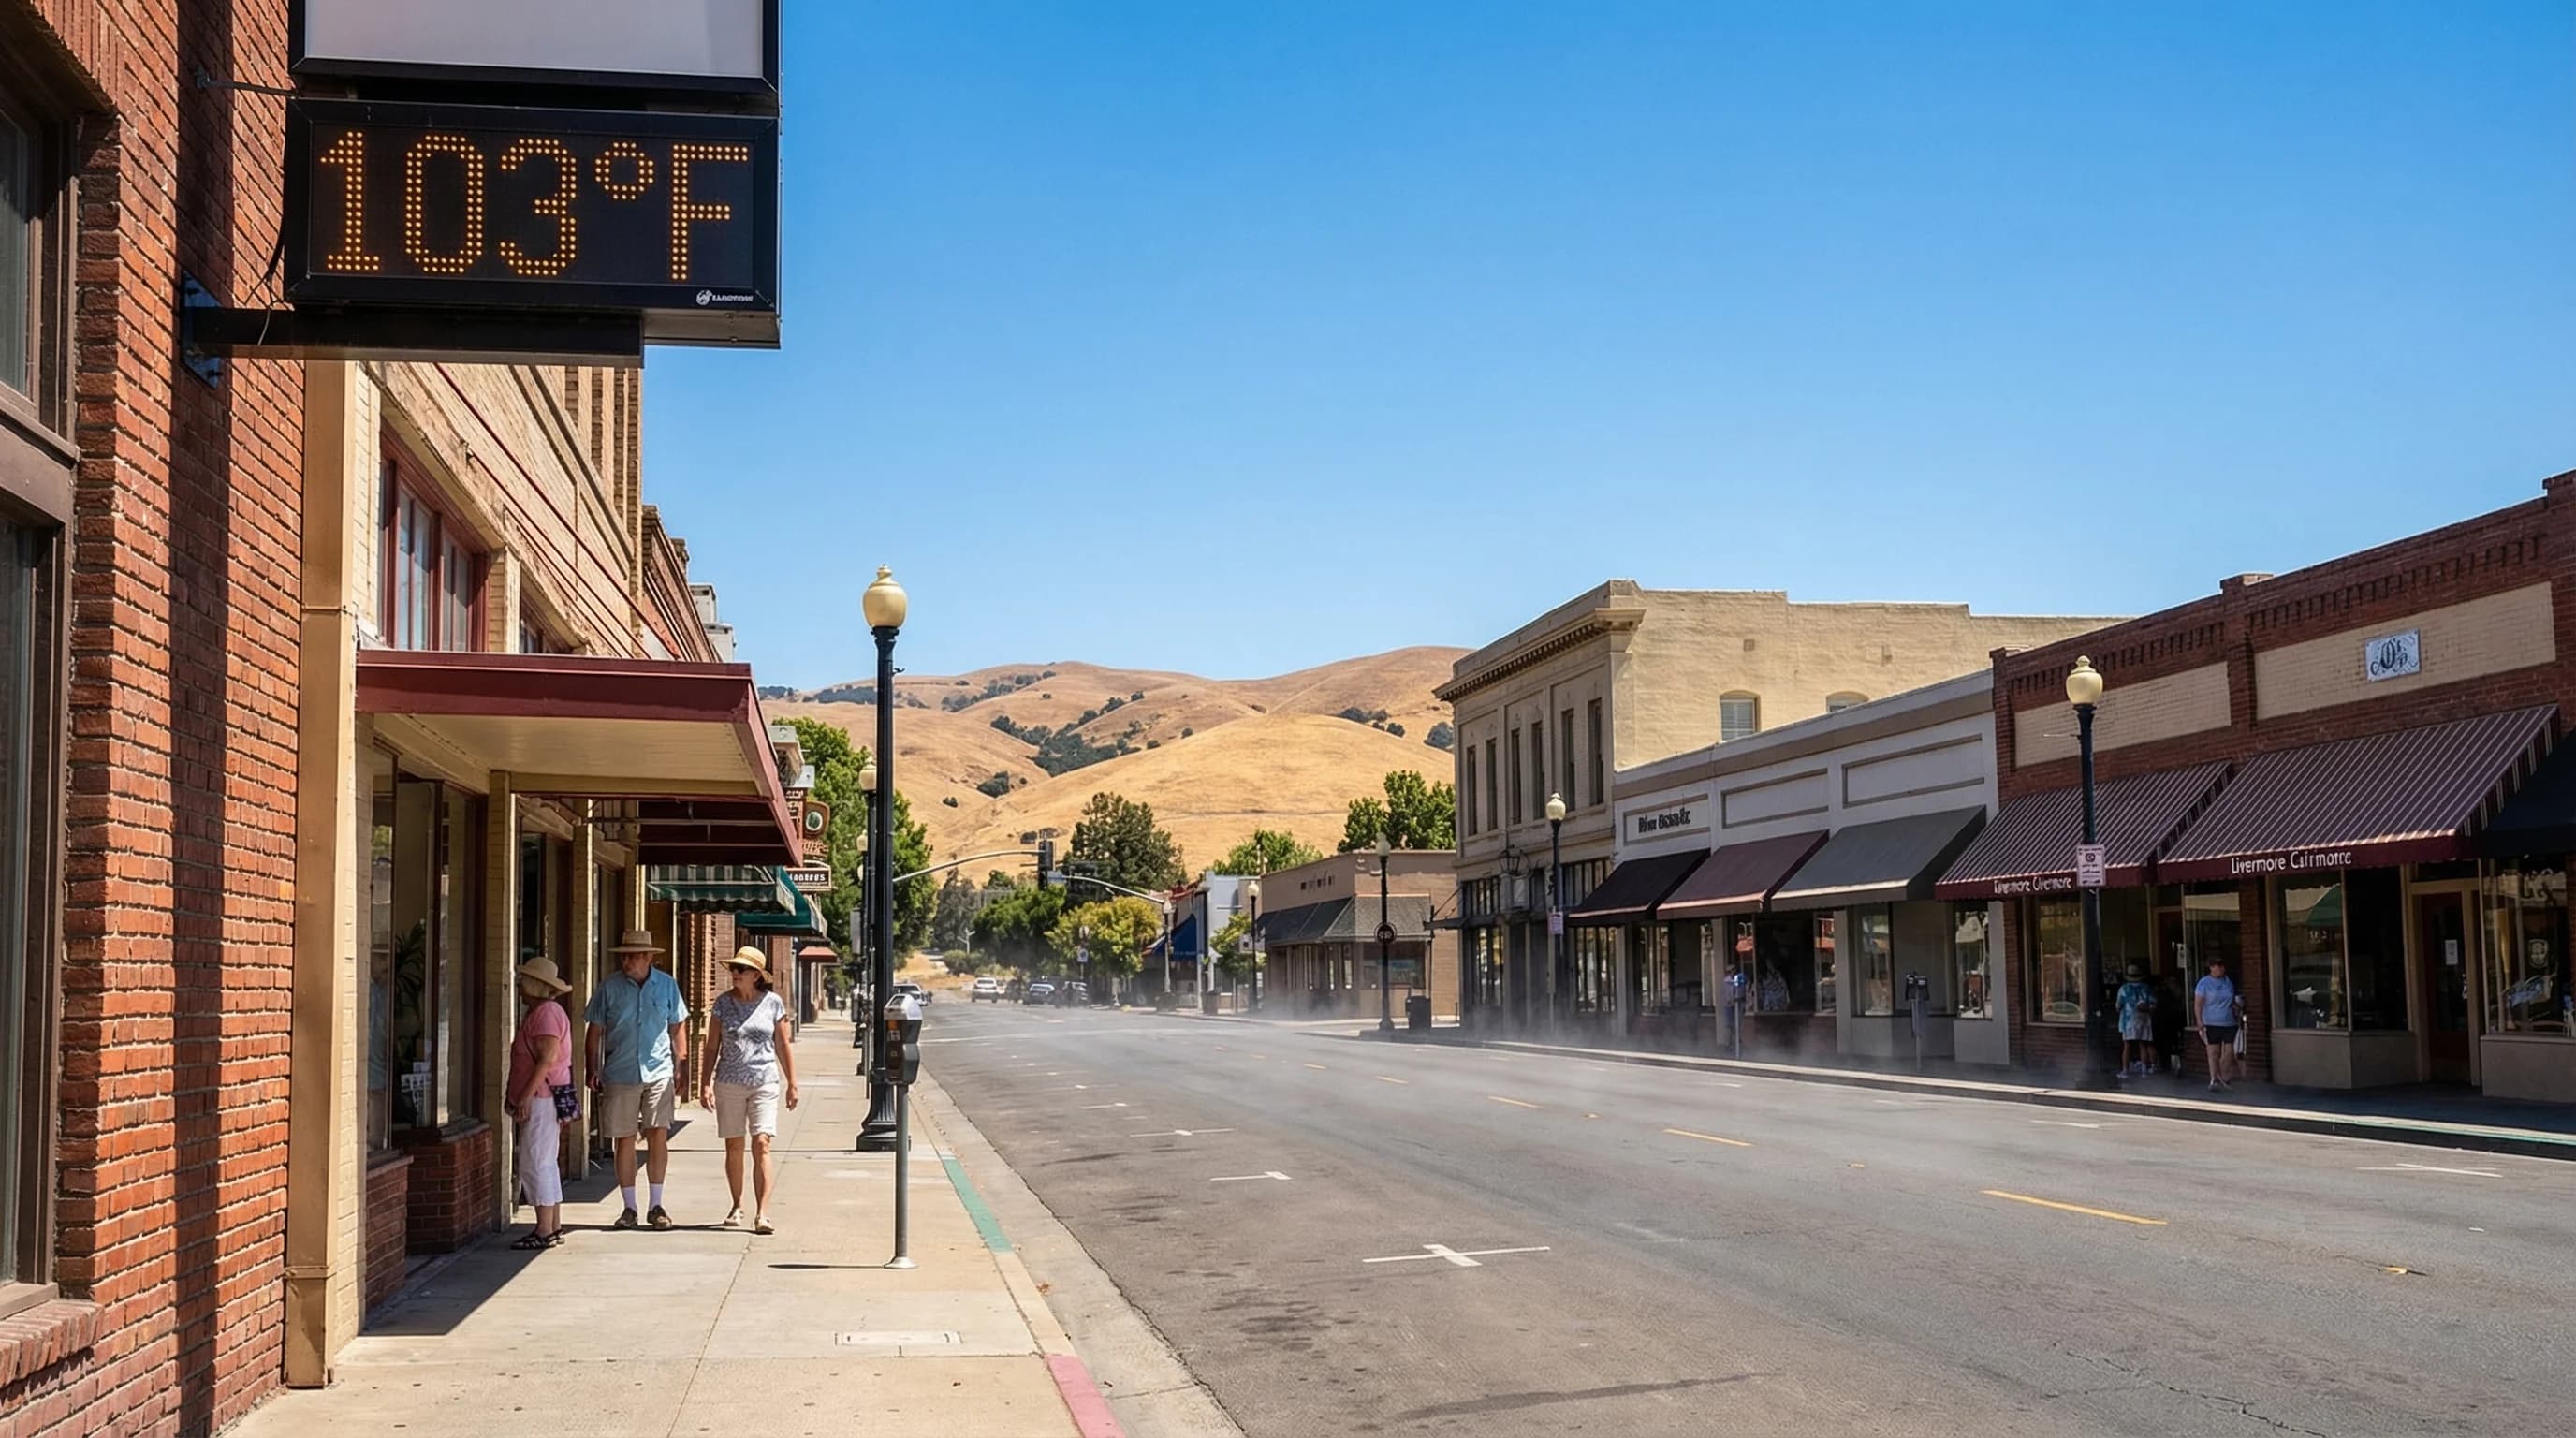
Livermore regularly hits 100-107°F in summer while San Francisco sits at 63°F, 40 miles away. The valley's inland position and Altamont Pass wind pattern make it the Bay Area's most extreme heat zone.
7min read →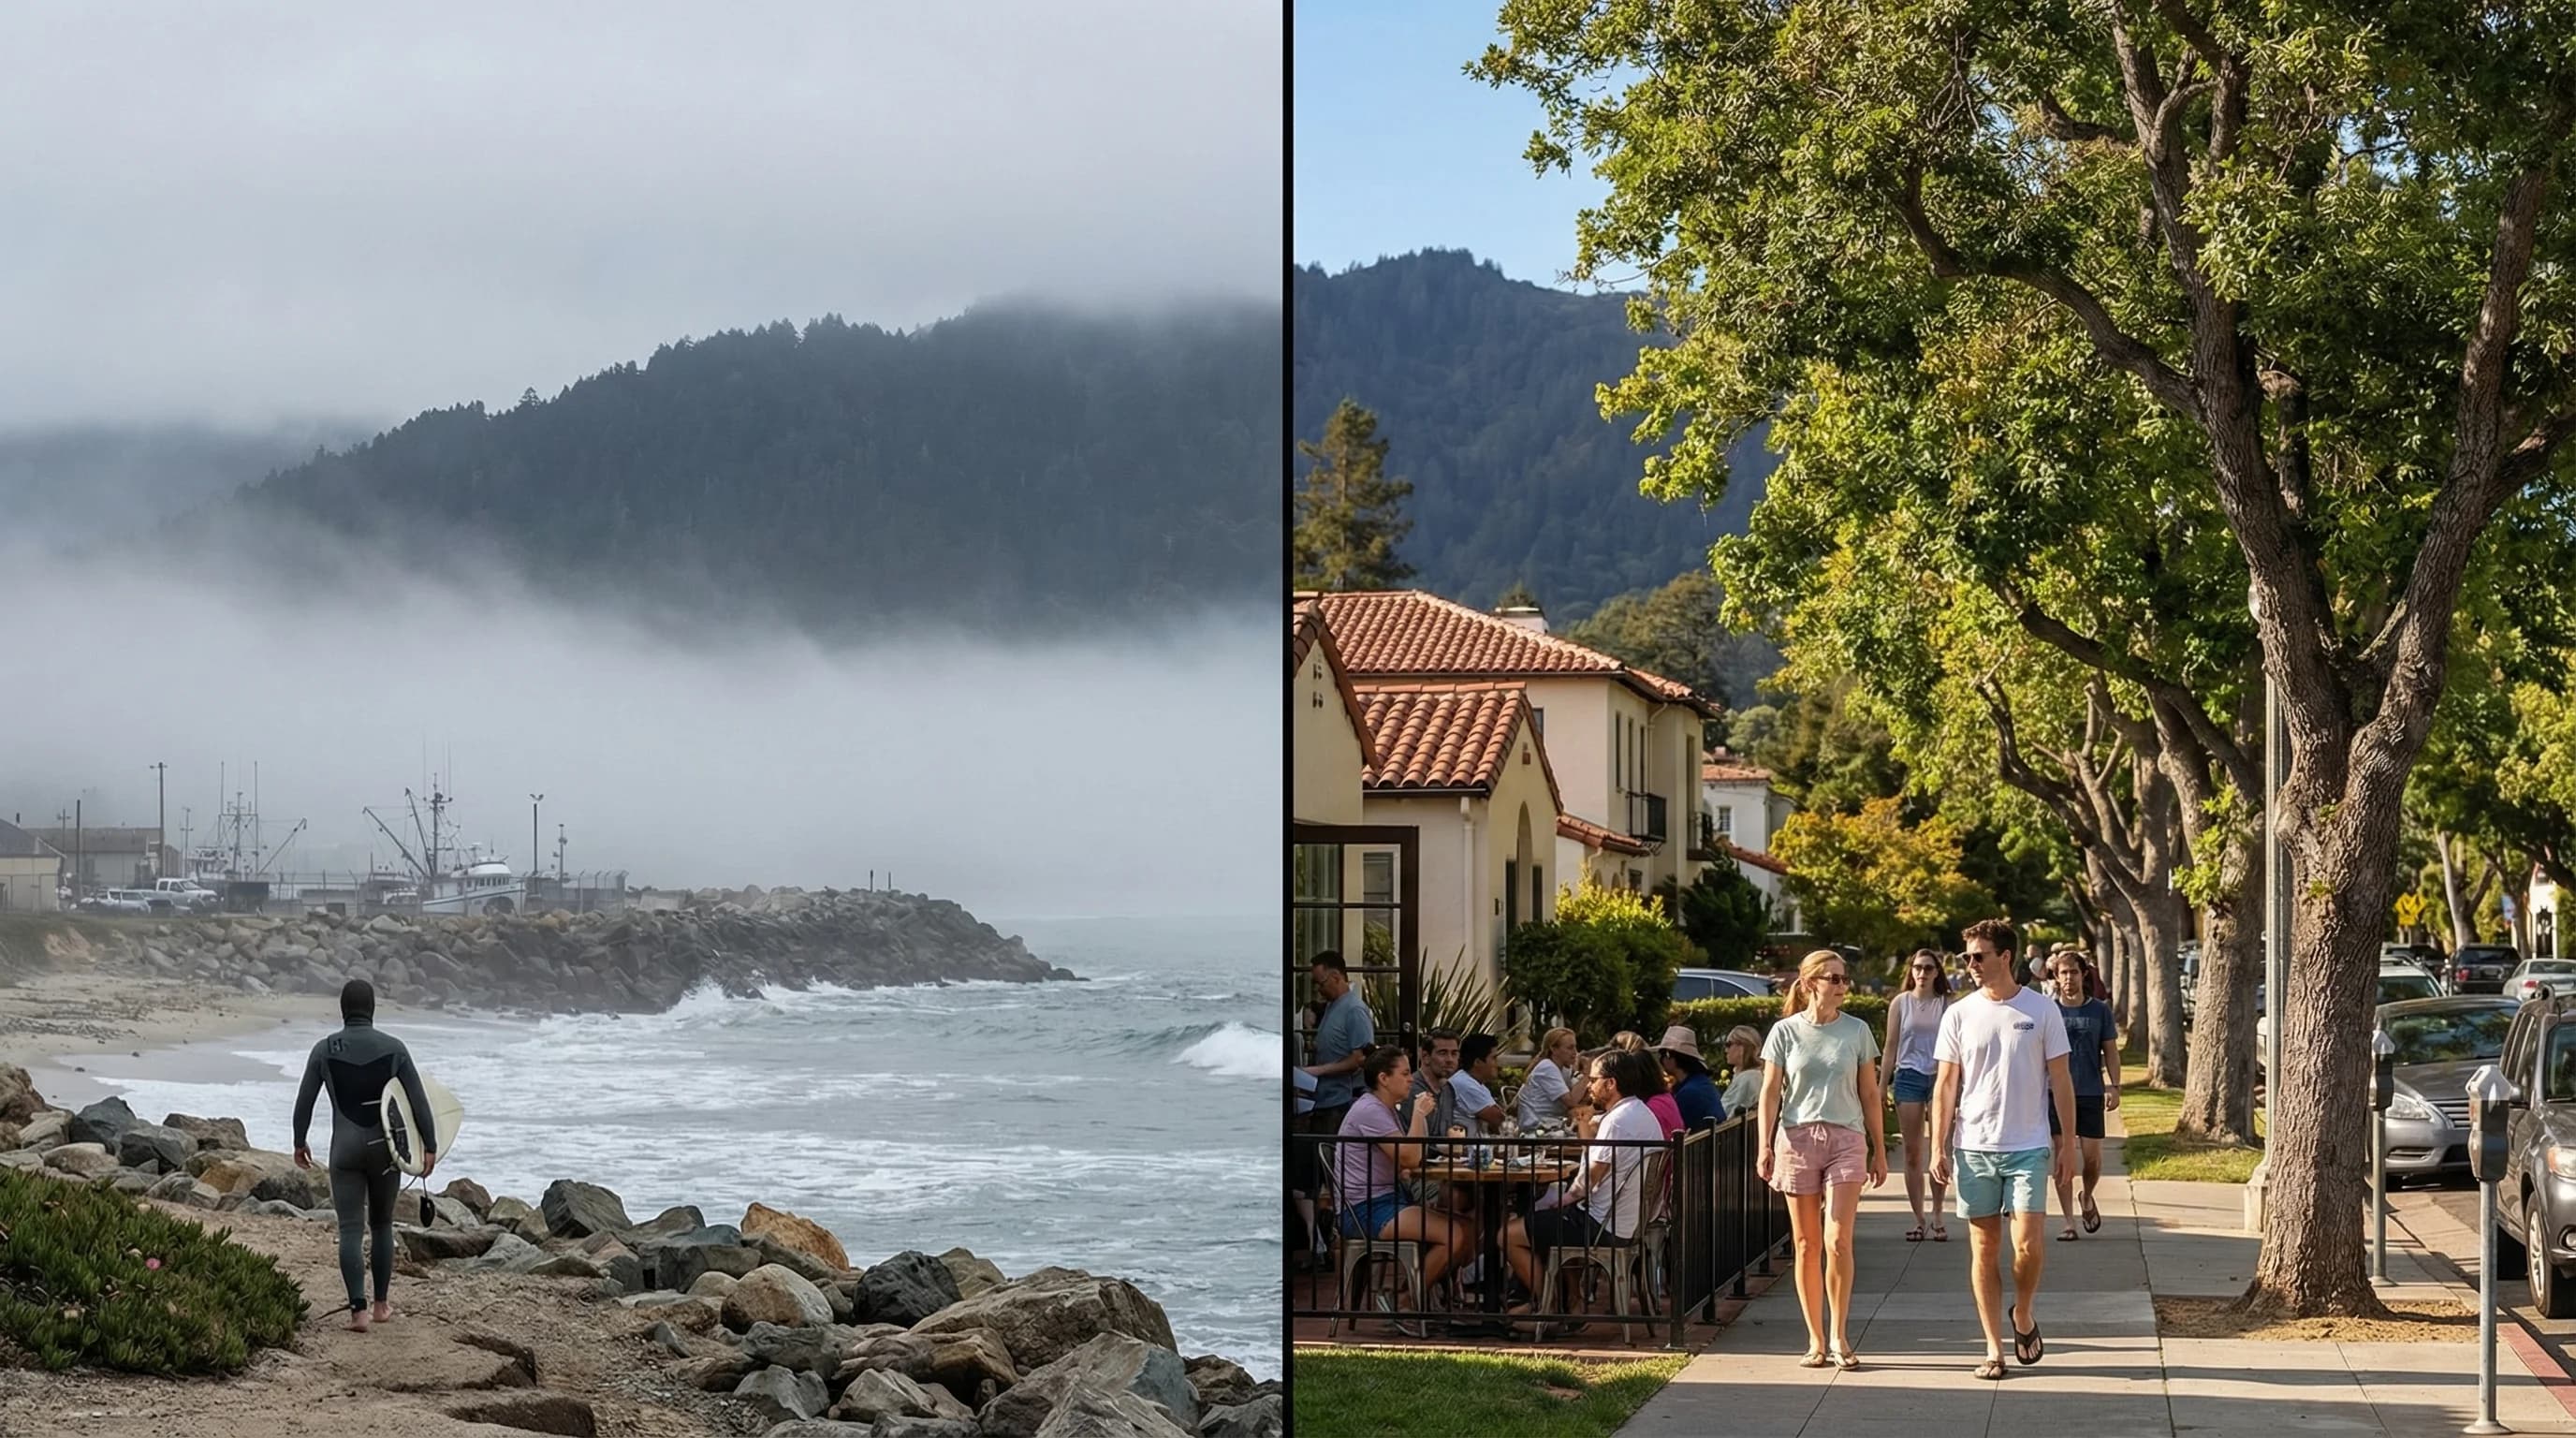
Palo Alto hits 82°F in July while Half Moon Bay, 15 miles away over the mountains, sits at 58°F in fog. The Santa Cruz Mountains divide the Peninsula into two distinct weather worlds.
7min read →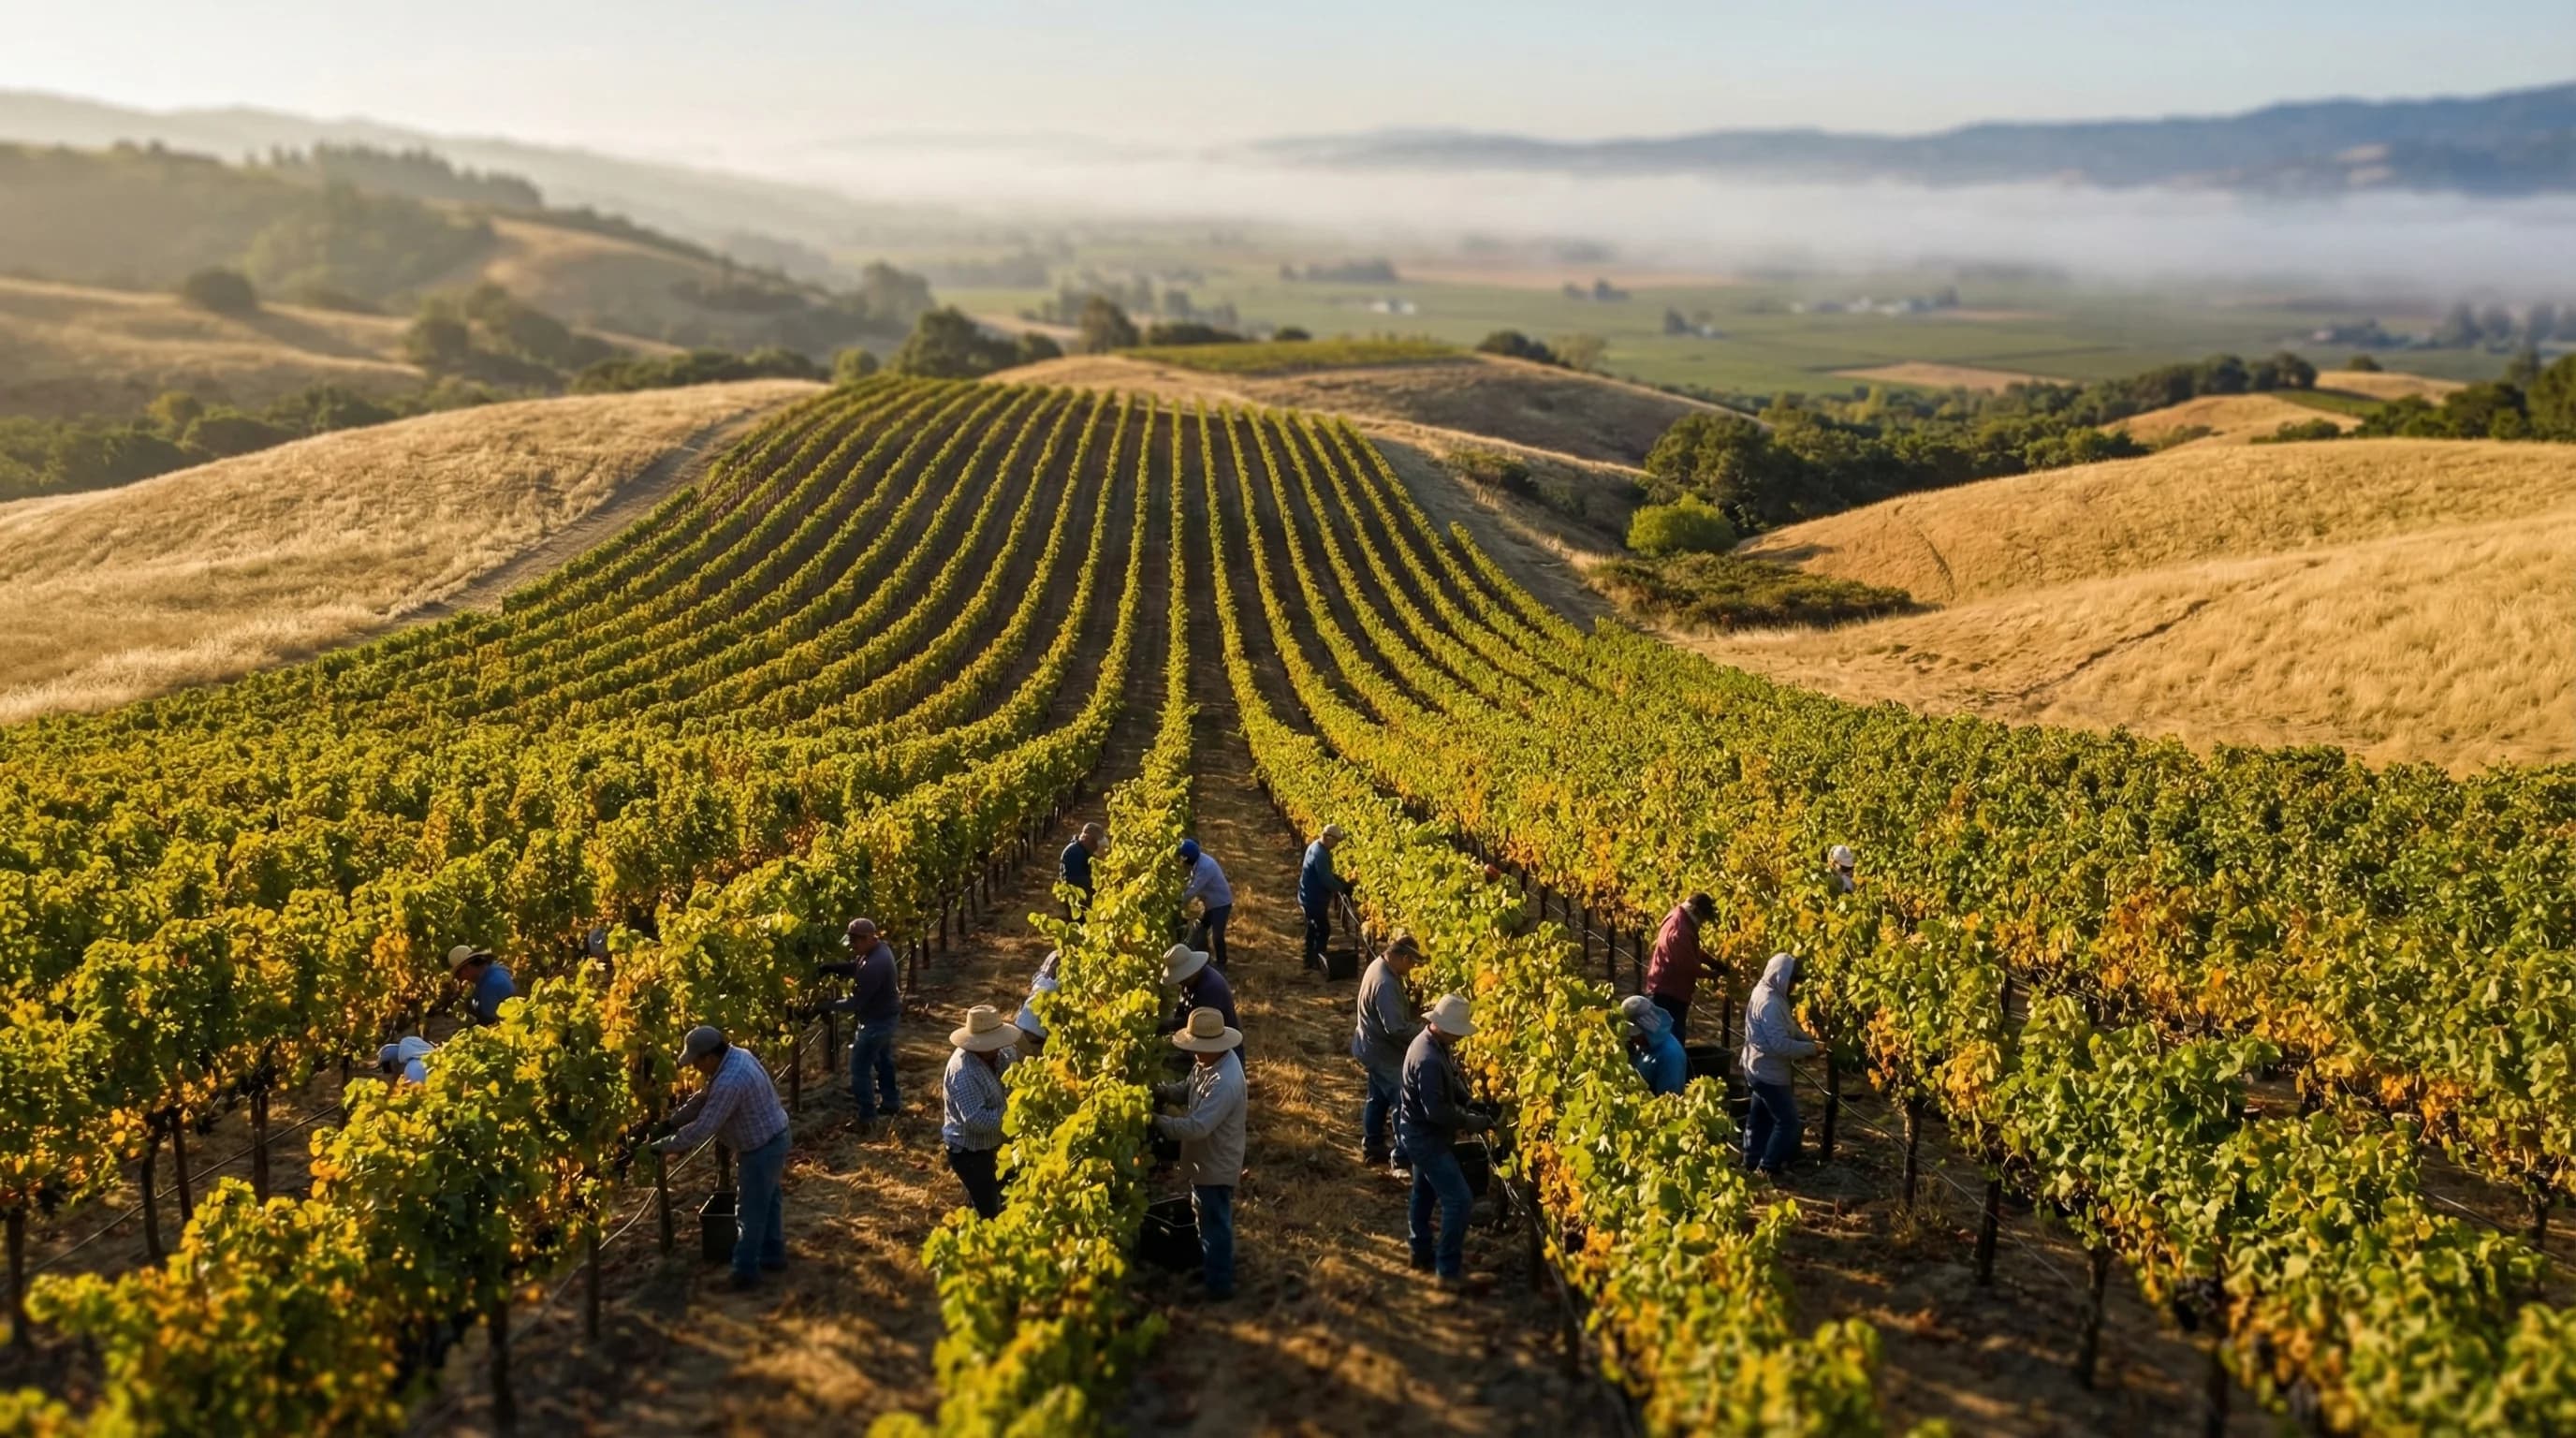
Napa Valley's hot days and cold nights are created by the same marine push that keeps San Francisco foggy. The valley runs from 100°F Calistoga to foggy 65°F Carneros in 30 miles.
8min read →
Half Moon Bay averages 60-63°F in summer under persistent Pacific fog. While Palo Alto hits 82°F, Half Moon Bay sits in thick marine layer 15 miles away. Fall is the best season for sunny visits.
6min read →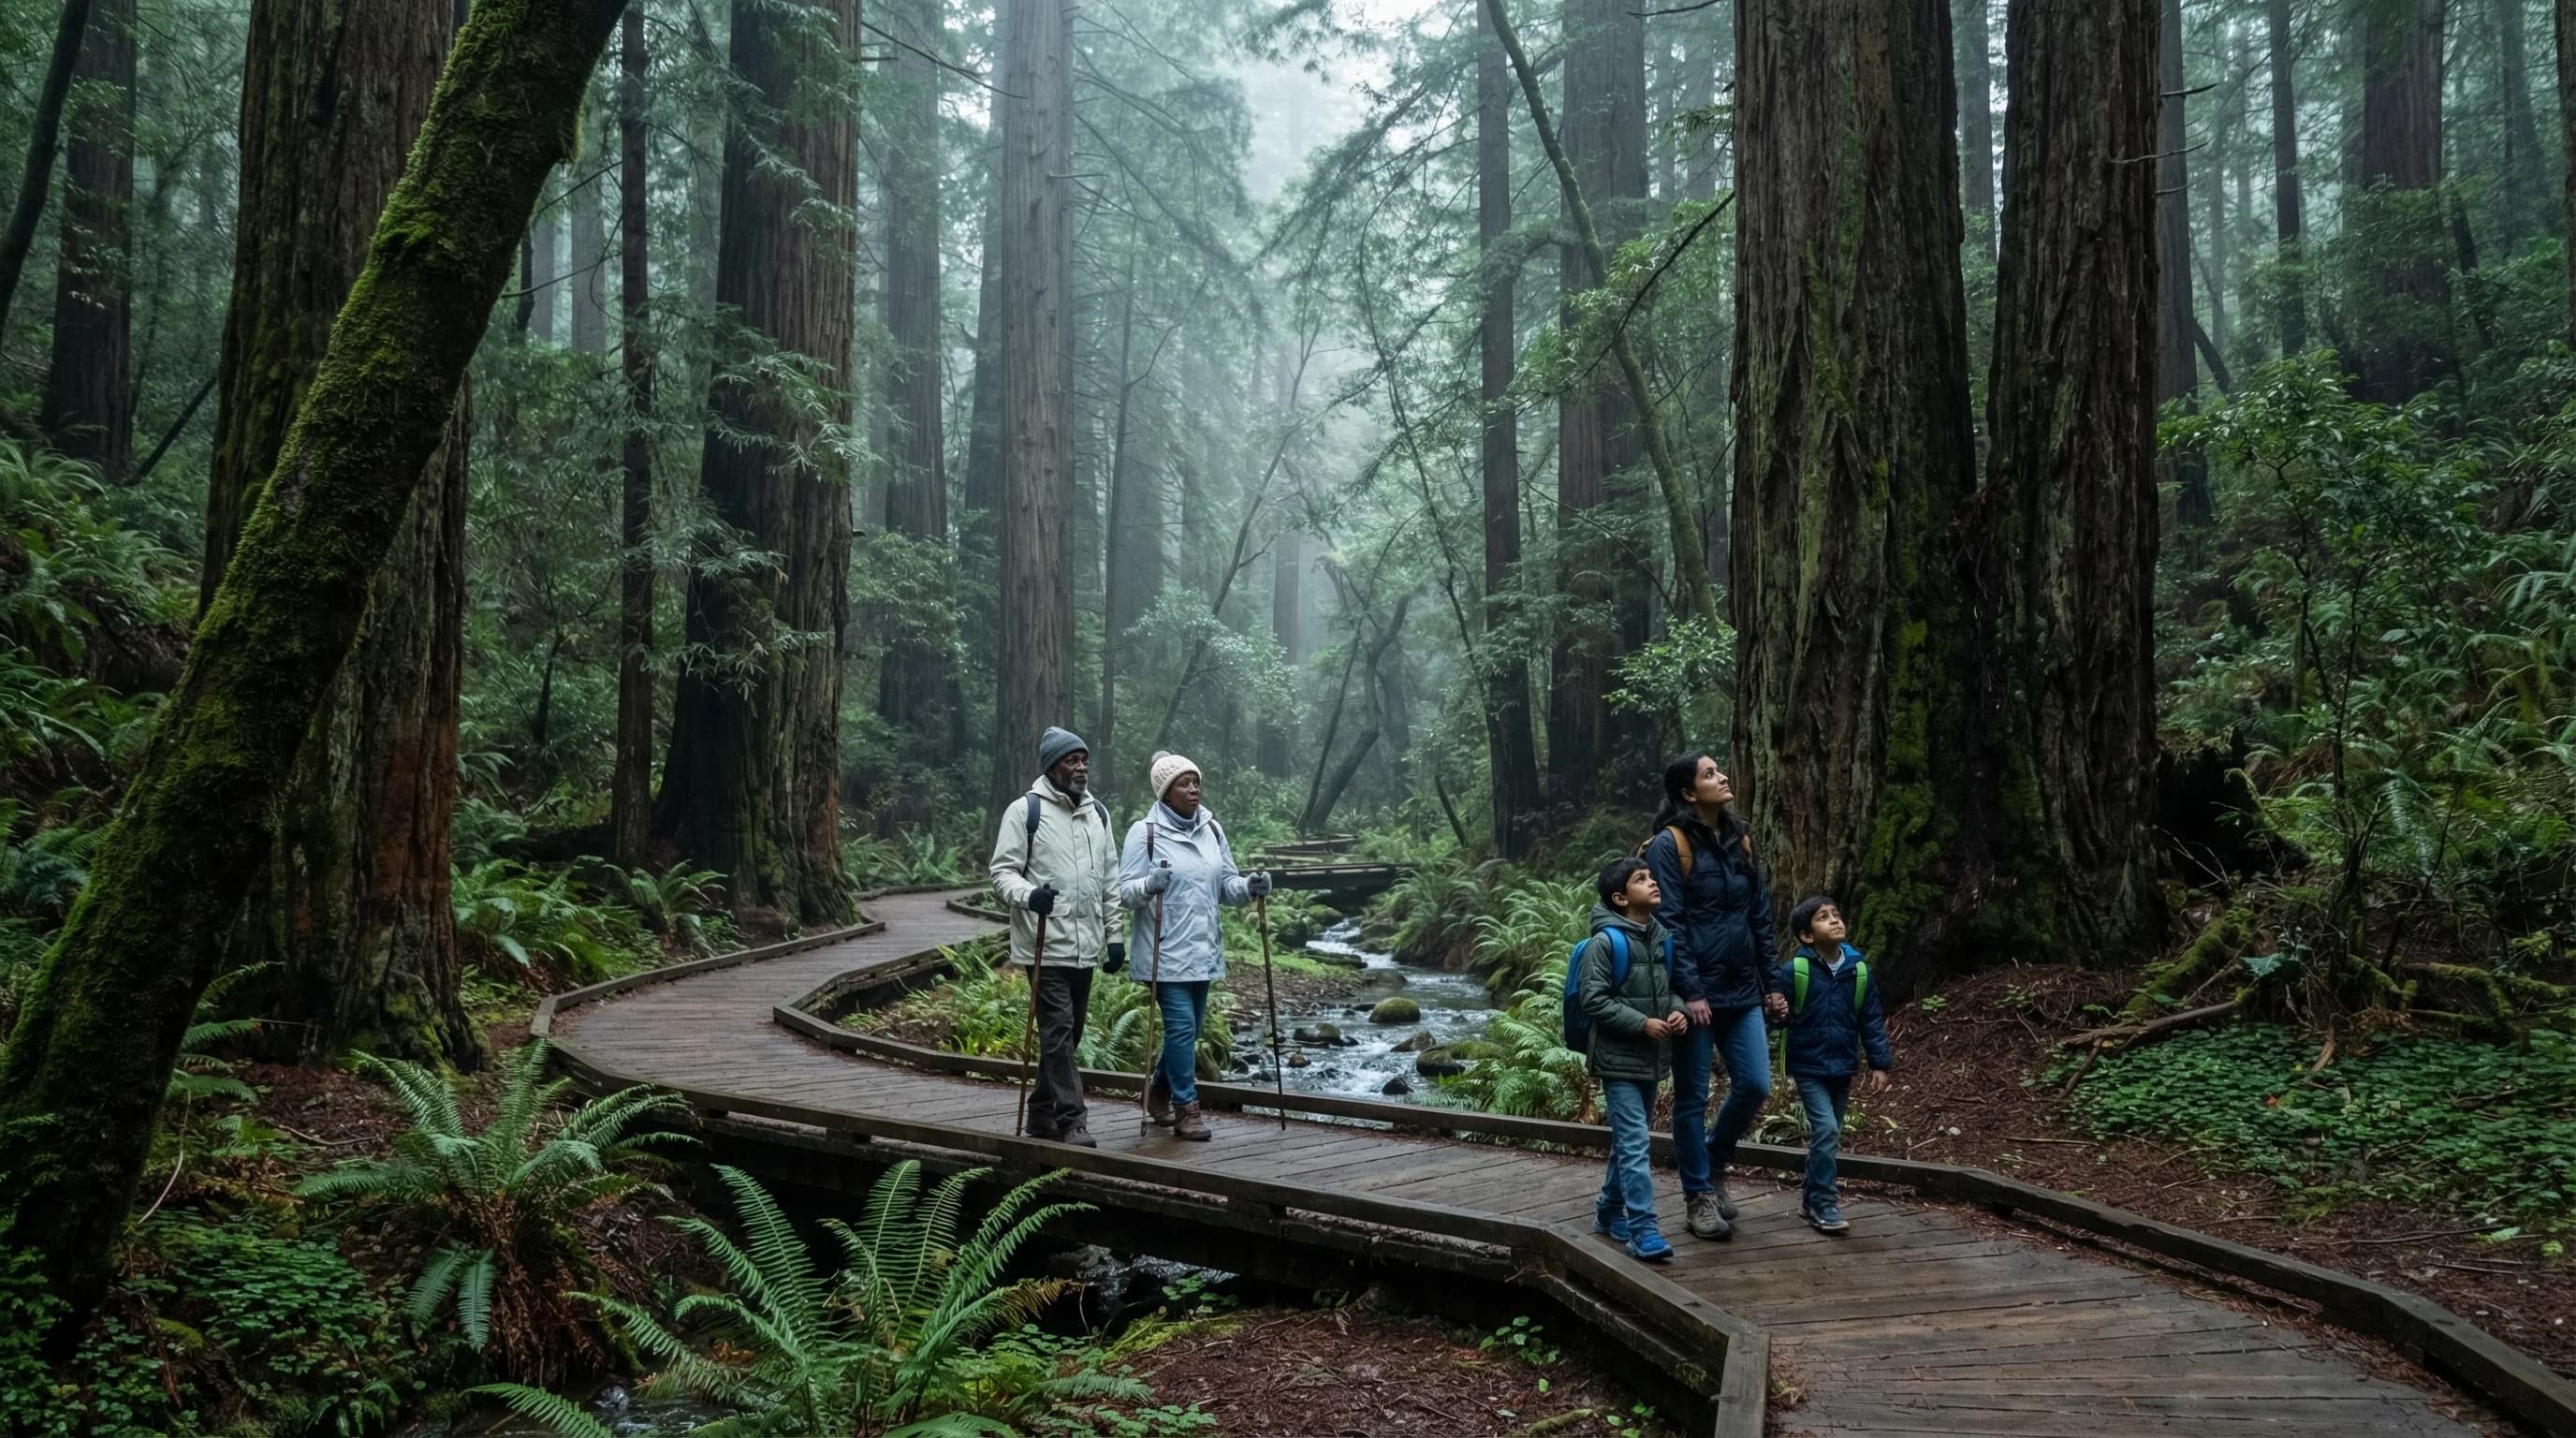
Muir Woods runs 15-20°F cooler than the surrounding Marin hills in summer. The redwood canopy, fog drip, and canyon orientation create a perpetually cool, moist microclimate regardless of what's happening outside.
6min read →
Bay Area heat waves arrive when atmospheric blocking shuts down the marine layer. Livermore can hit 108°F while San Francisco stays at 72°F 40 miles away. These events are brief, intense, and increasingly frequent.
7min read →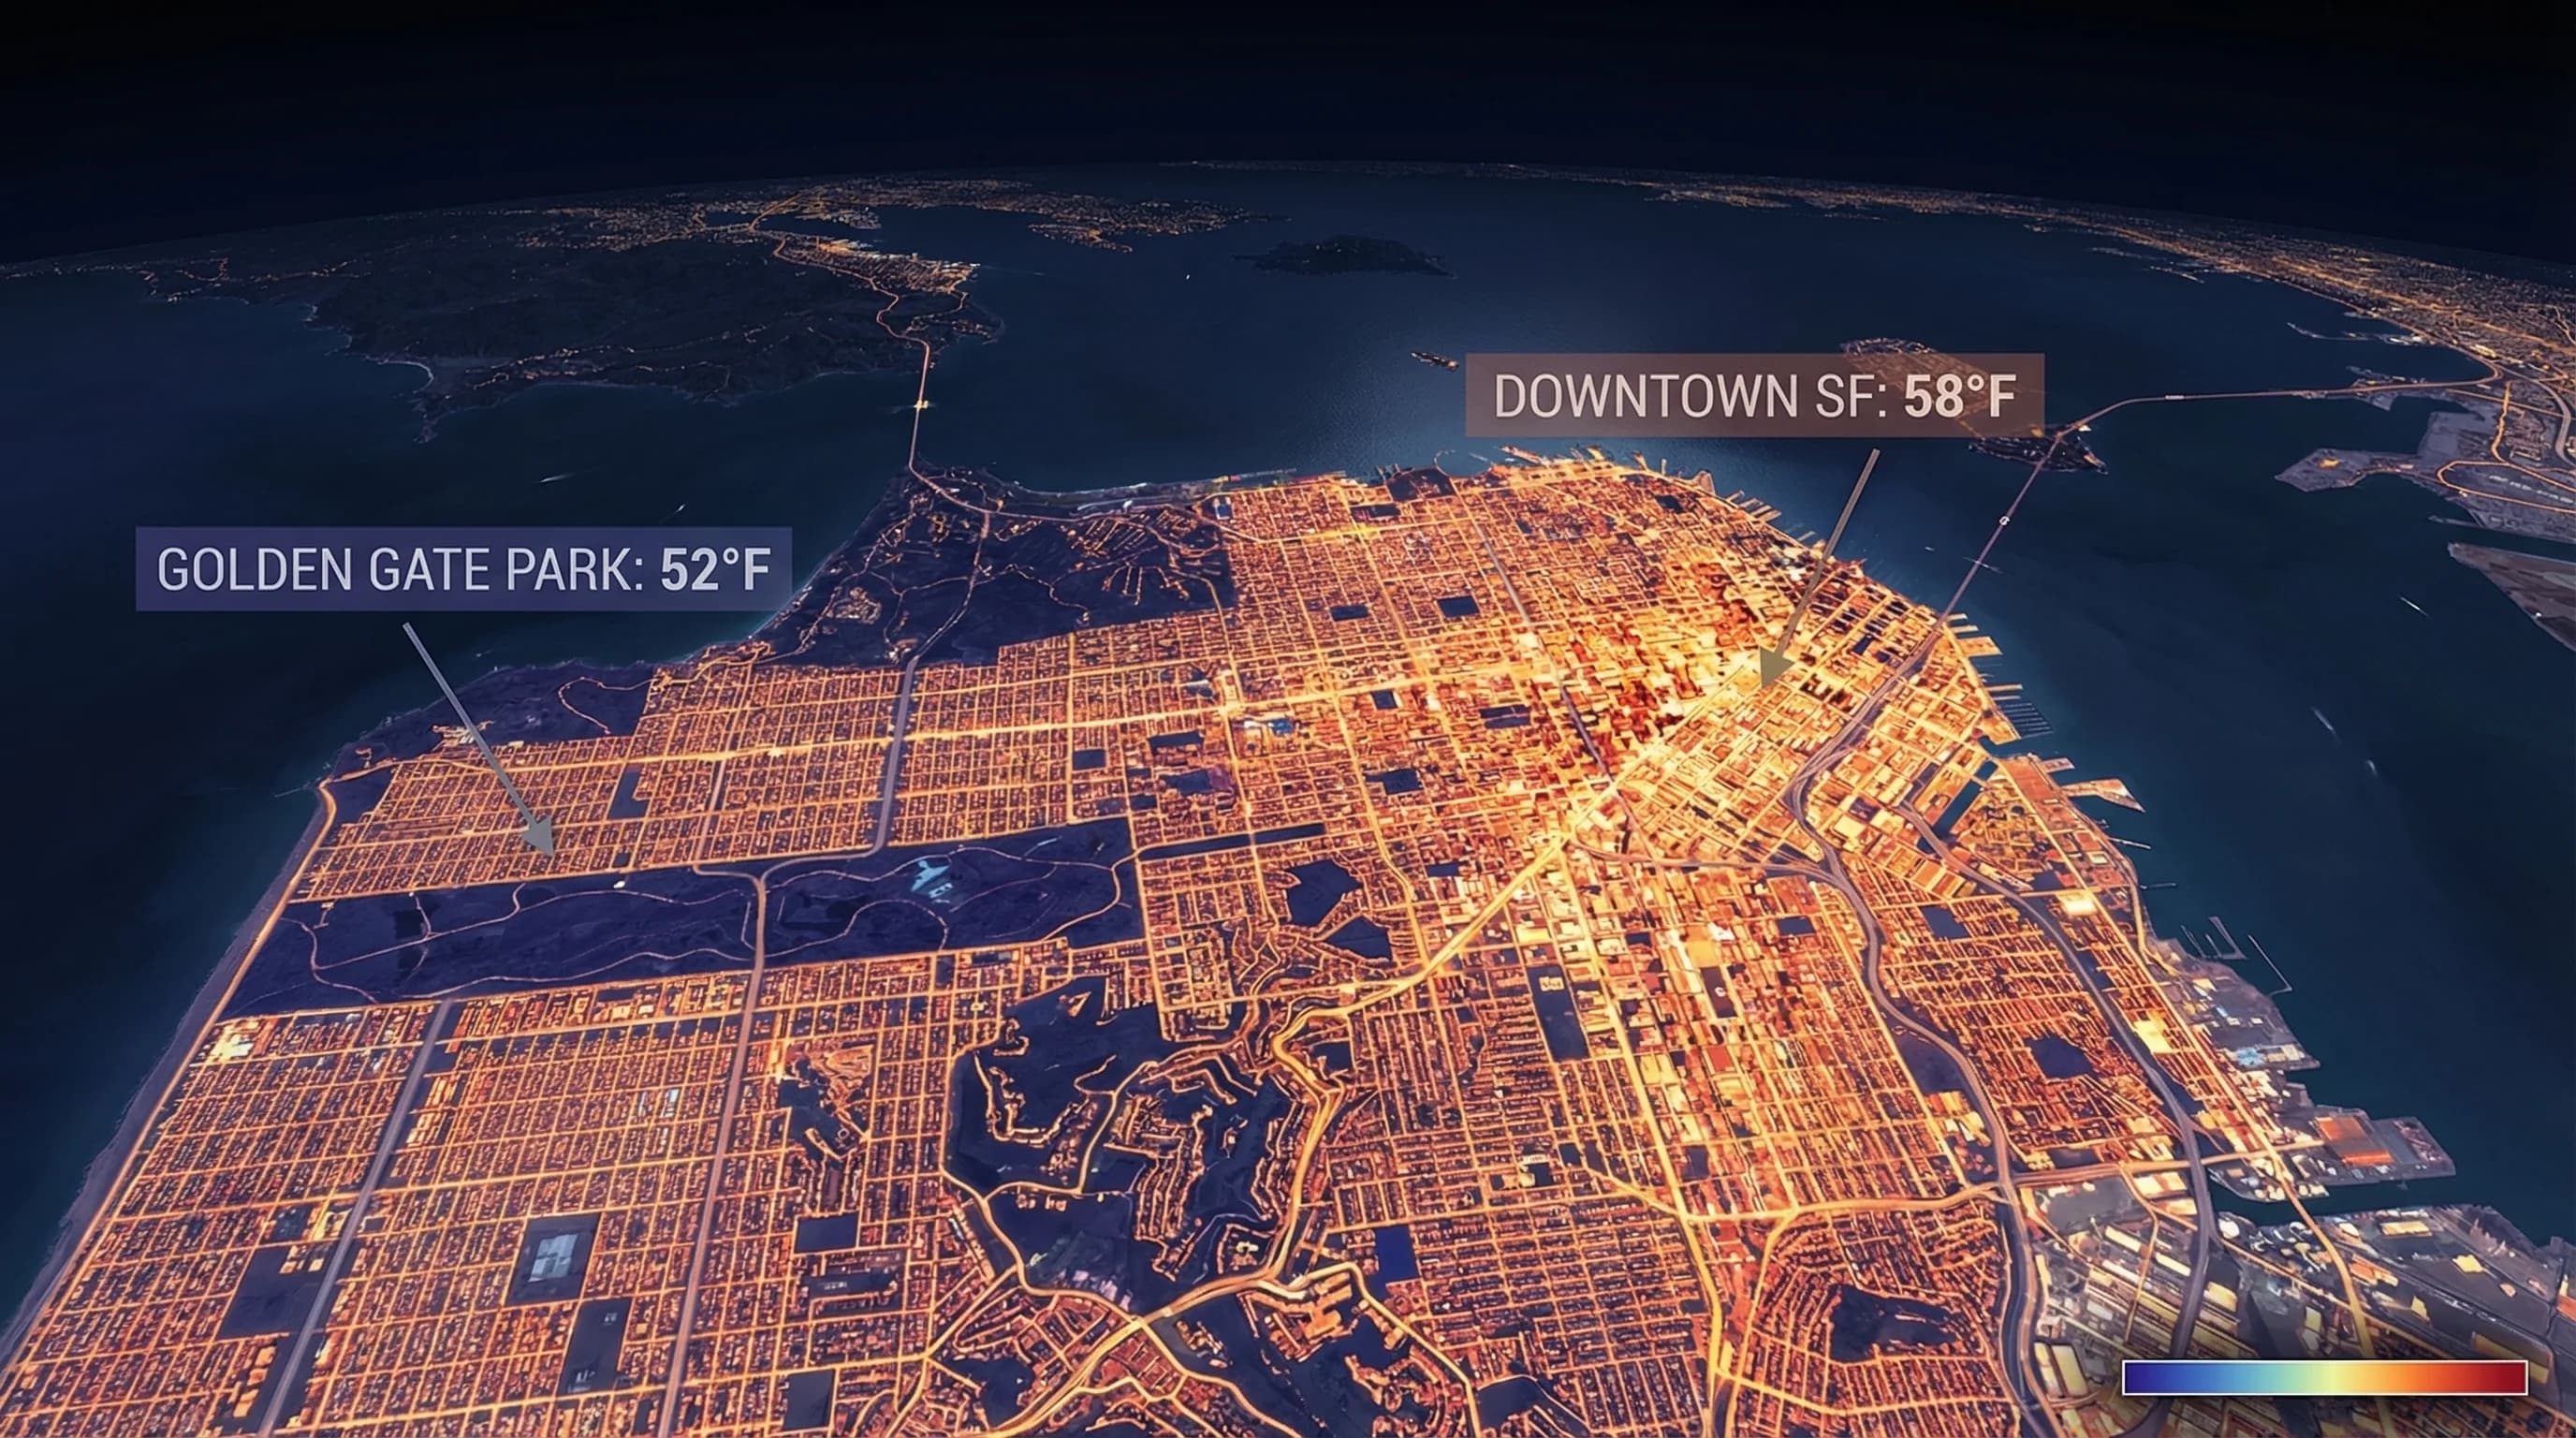
San Francisco's urban heat island is weaker than most cities because the marine layer suppresses both daytime solar heating and nighttime radiative cooling. The effect is clearest on cold, clear winter nights.
6min read →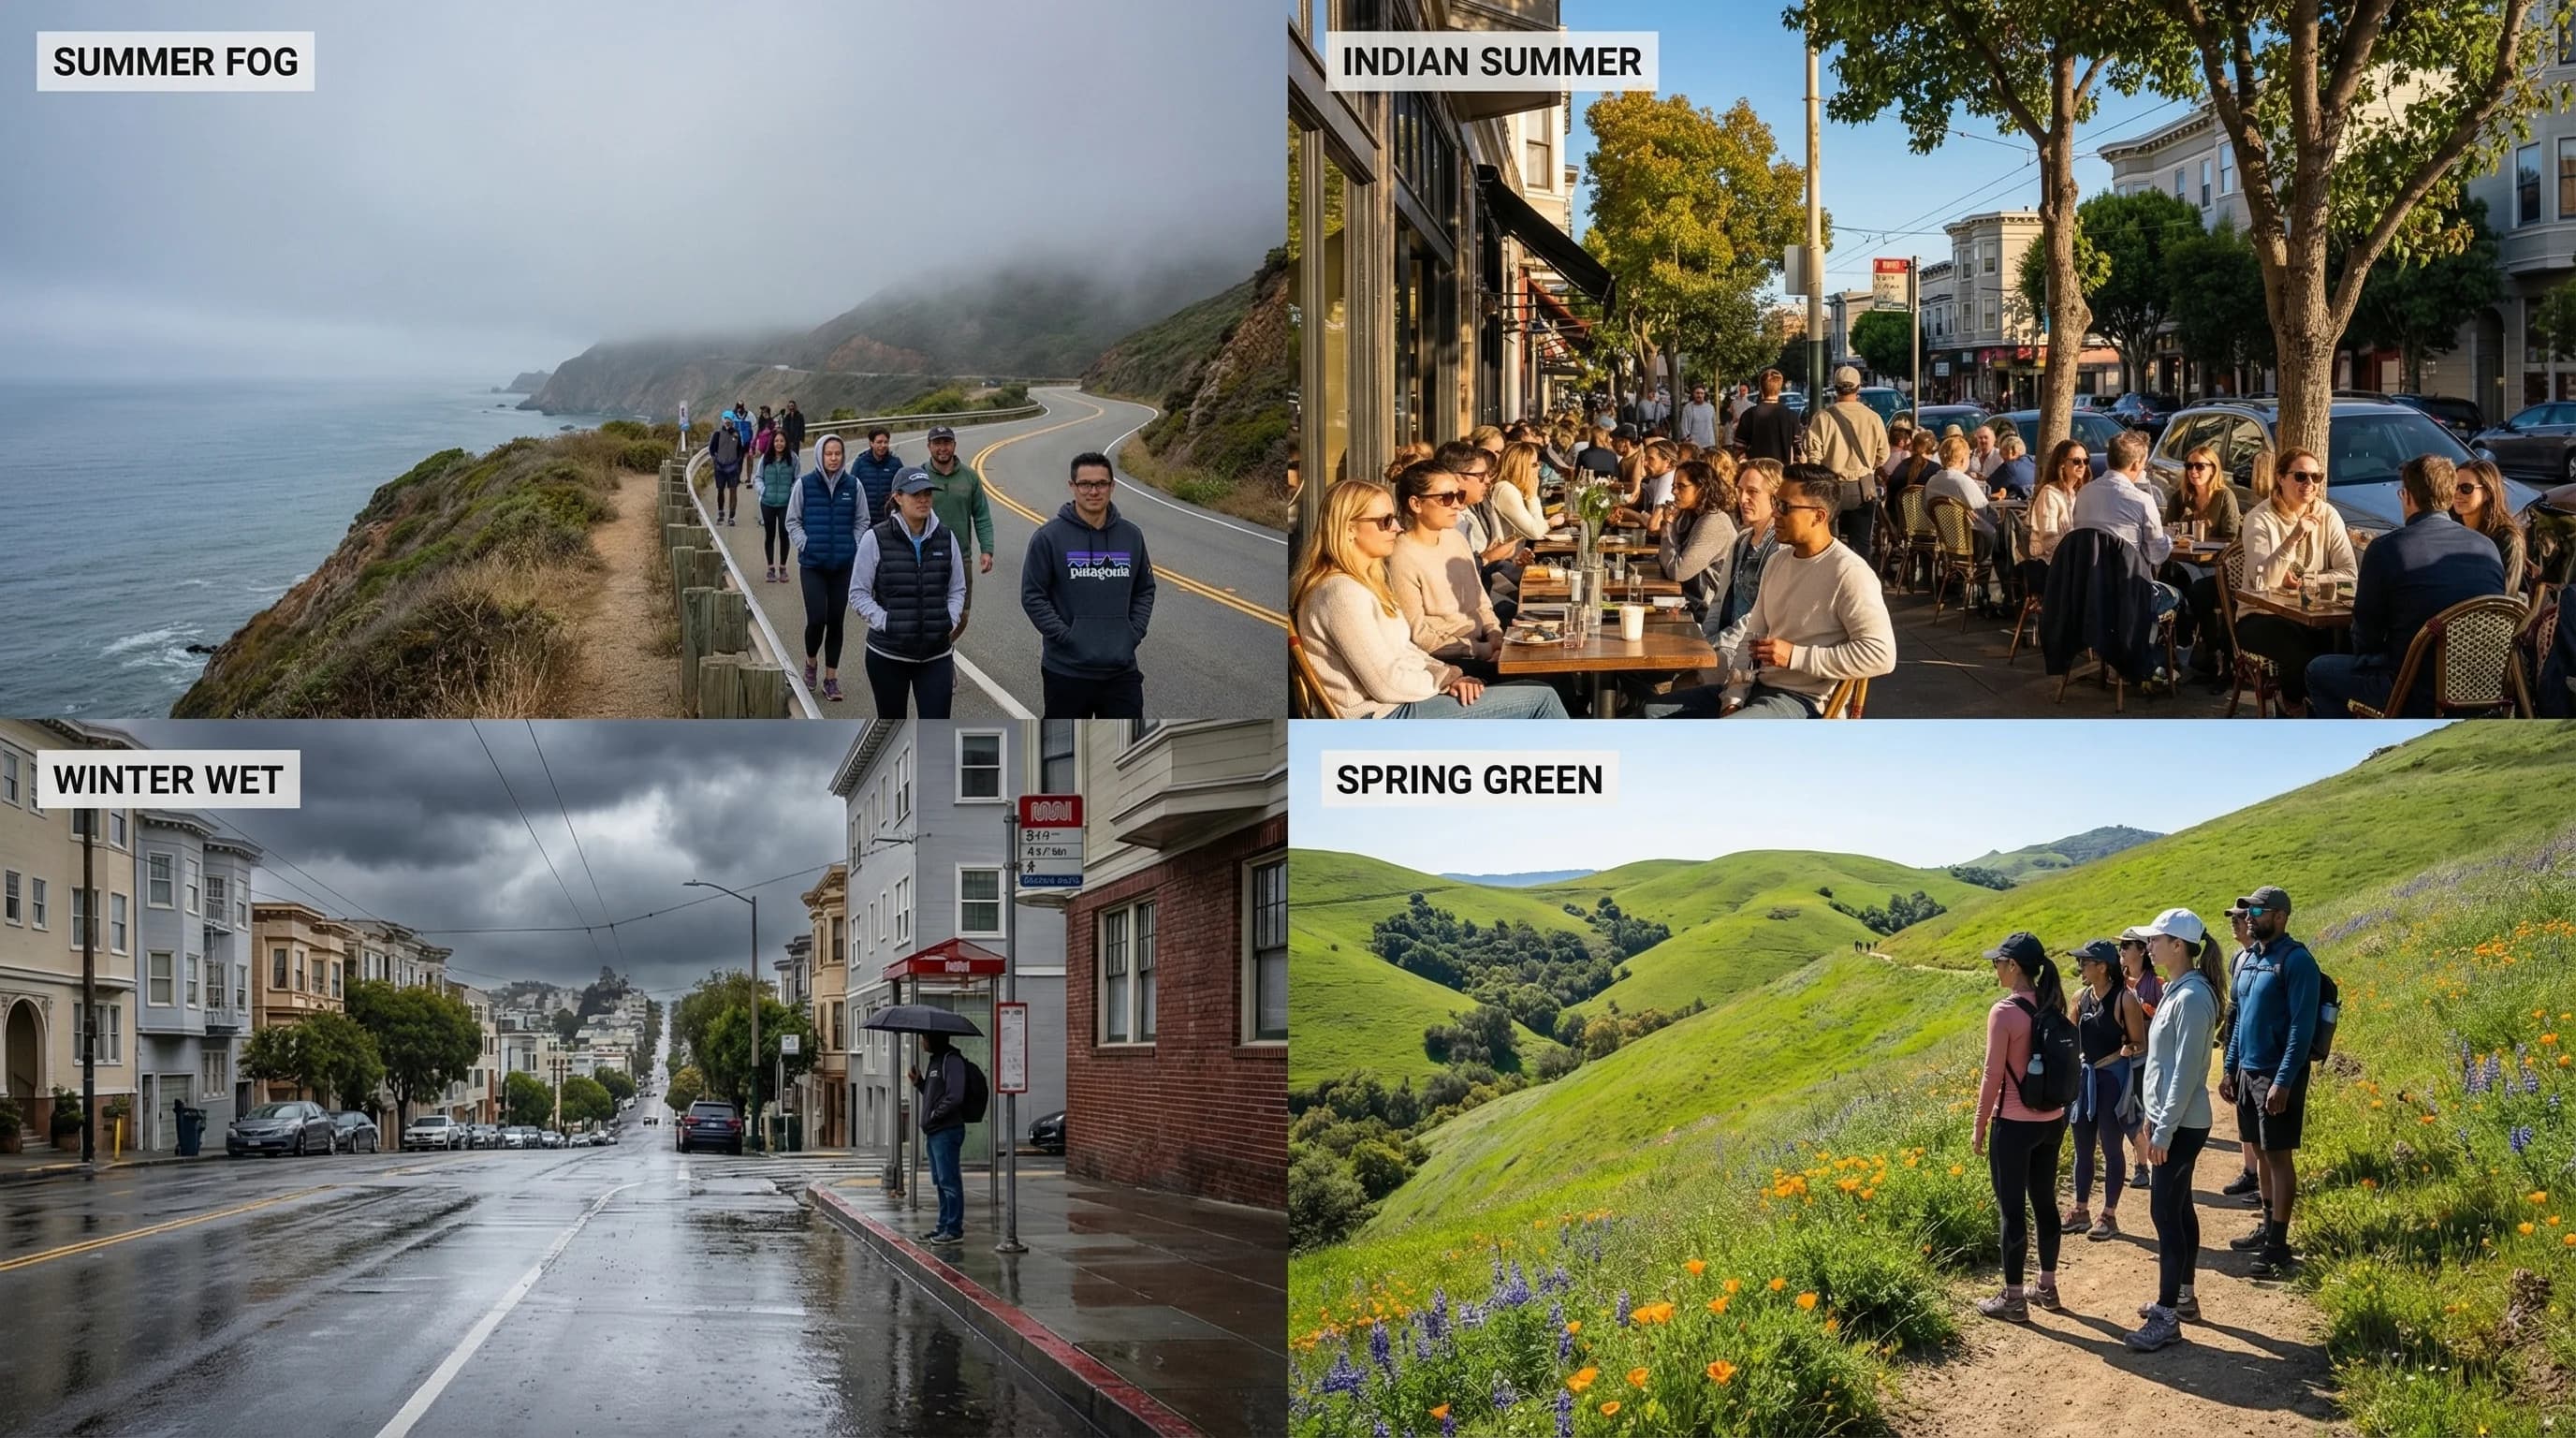
The Bay Area's "seasons" don't follow the calendar. Fog season peaks in July, Indian summer peaks in October, the wet season runs November-March, and the green season follows the first rains.
6min read →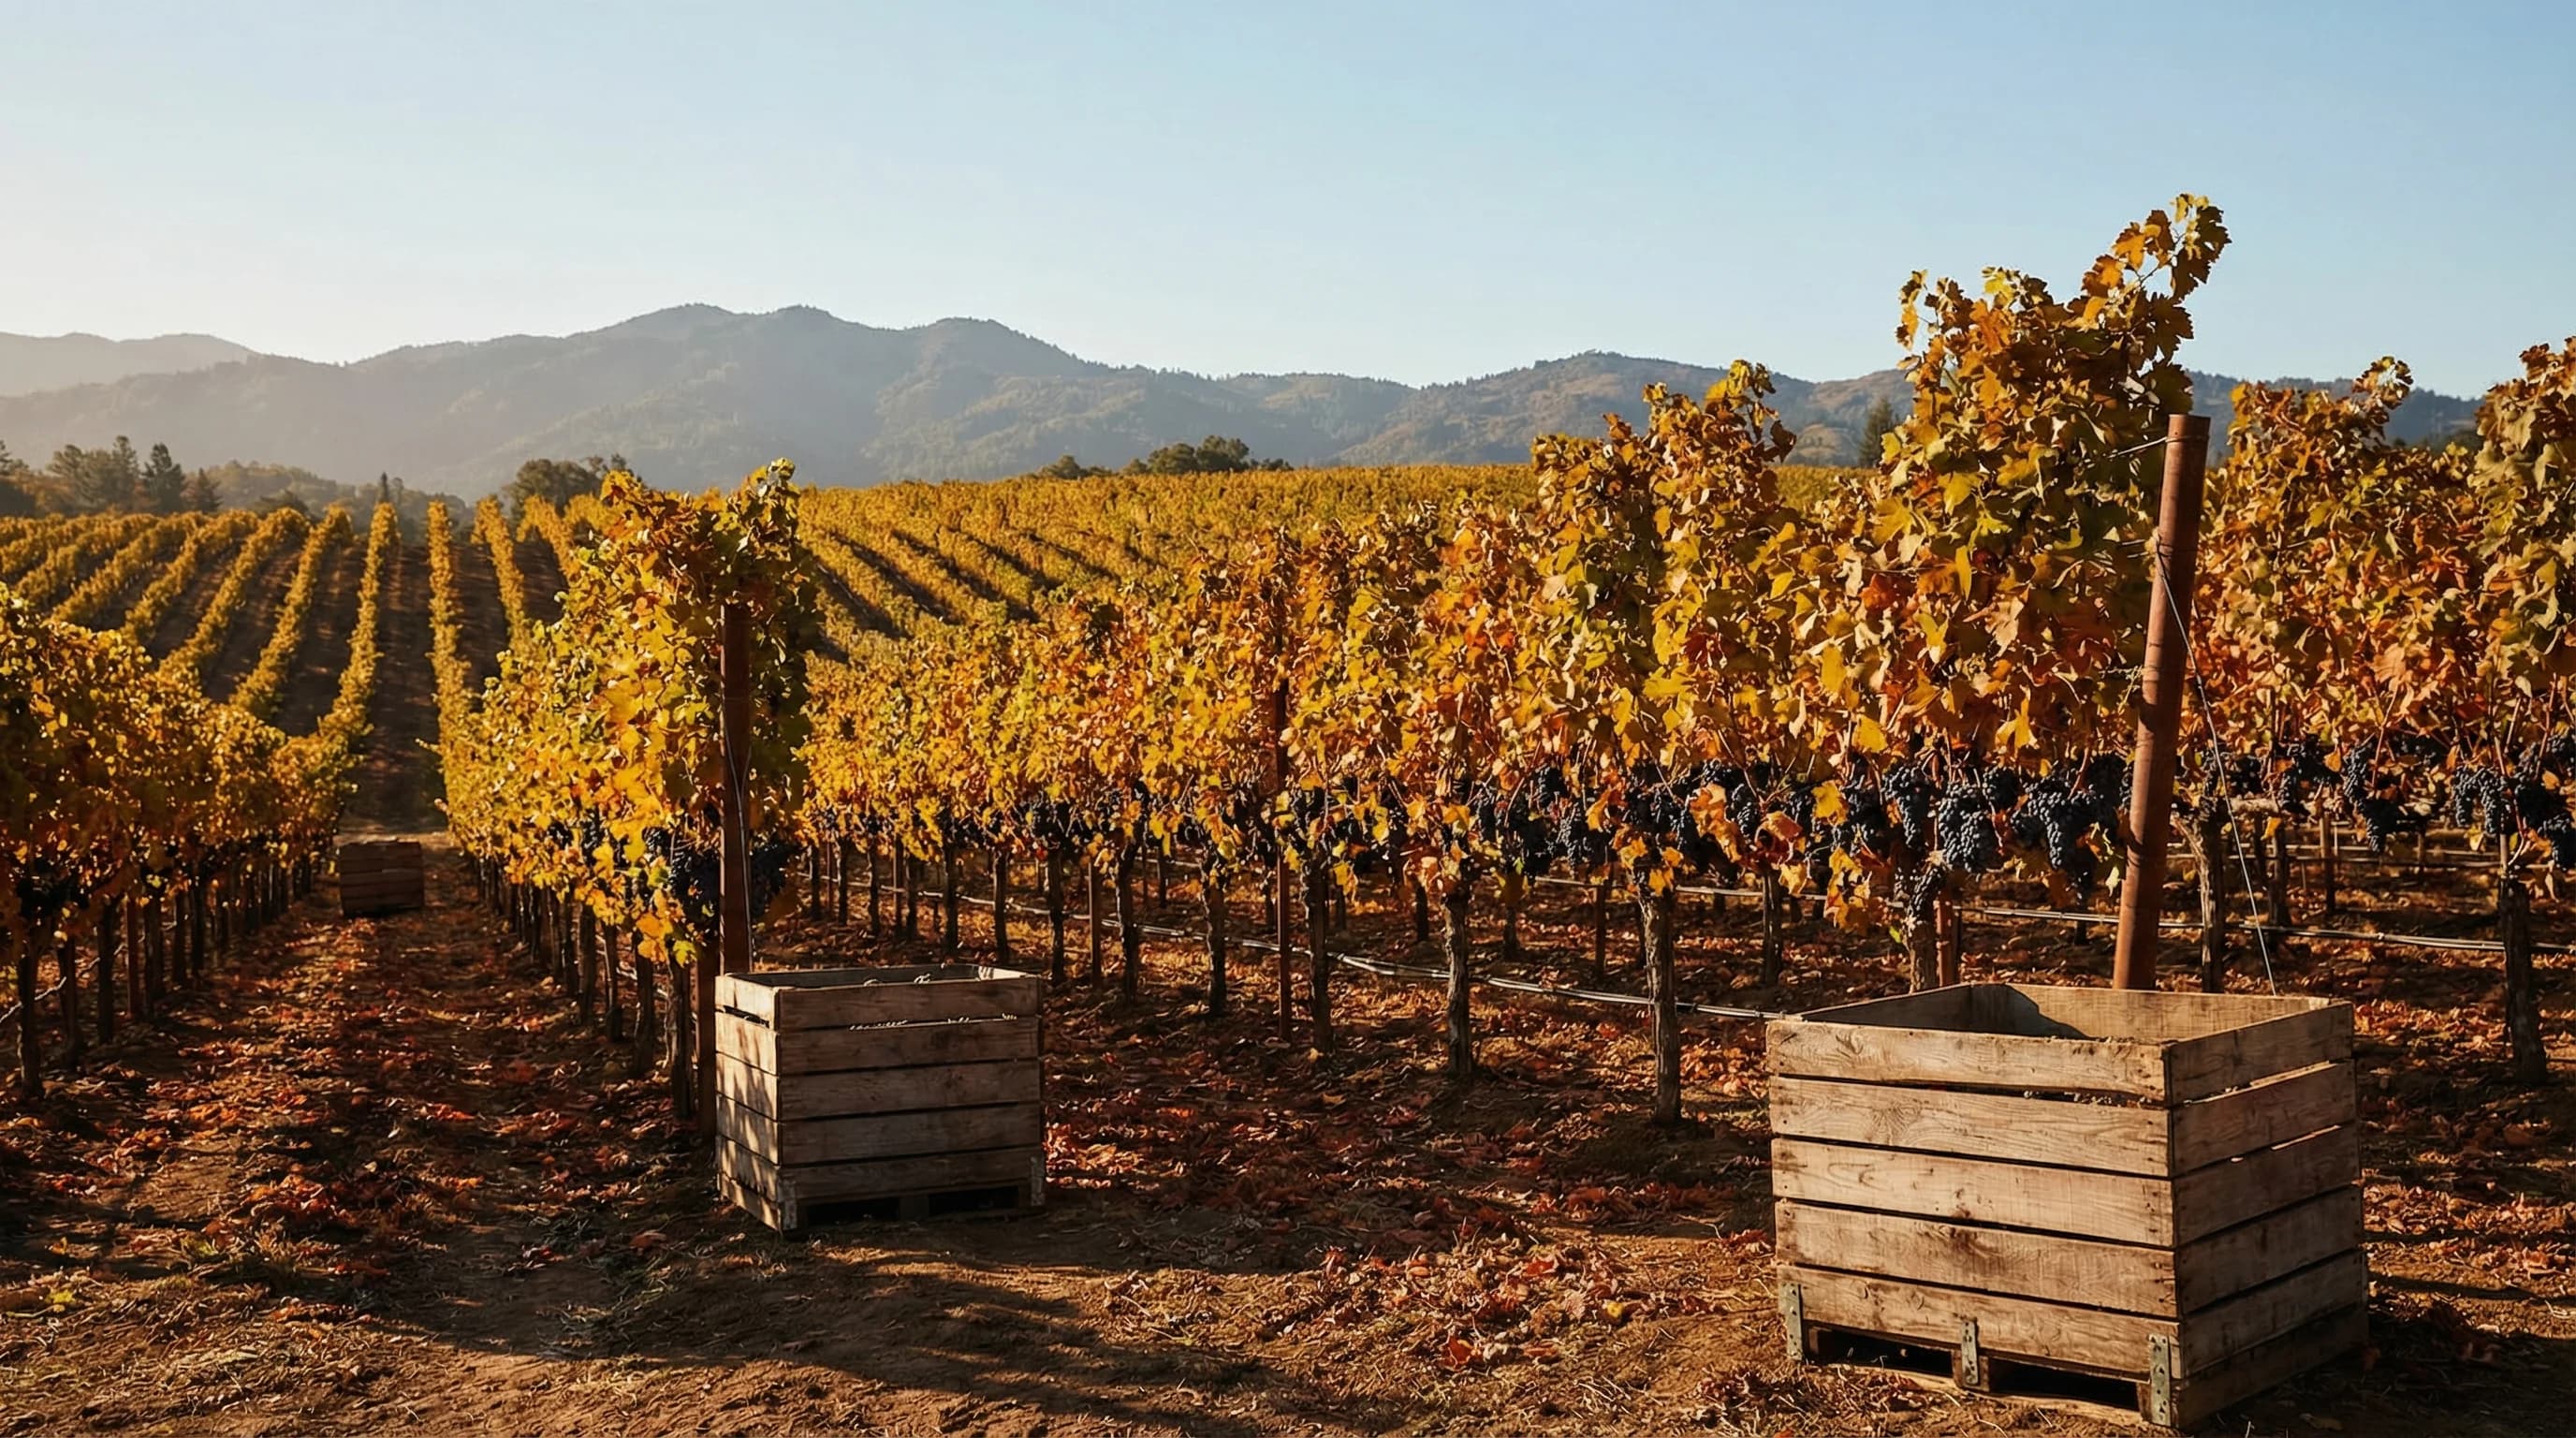
Napa Valley runs from cool rainy winters to 90-95°F summers to the golden October harvest window. Each month has distinct character. Here's what to expect and when to visit for your preferred experience.
7min read →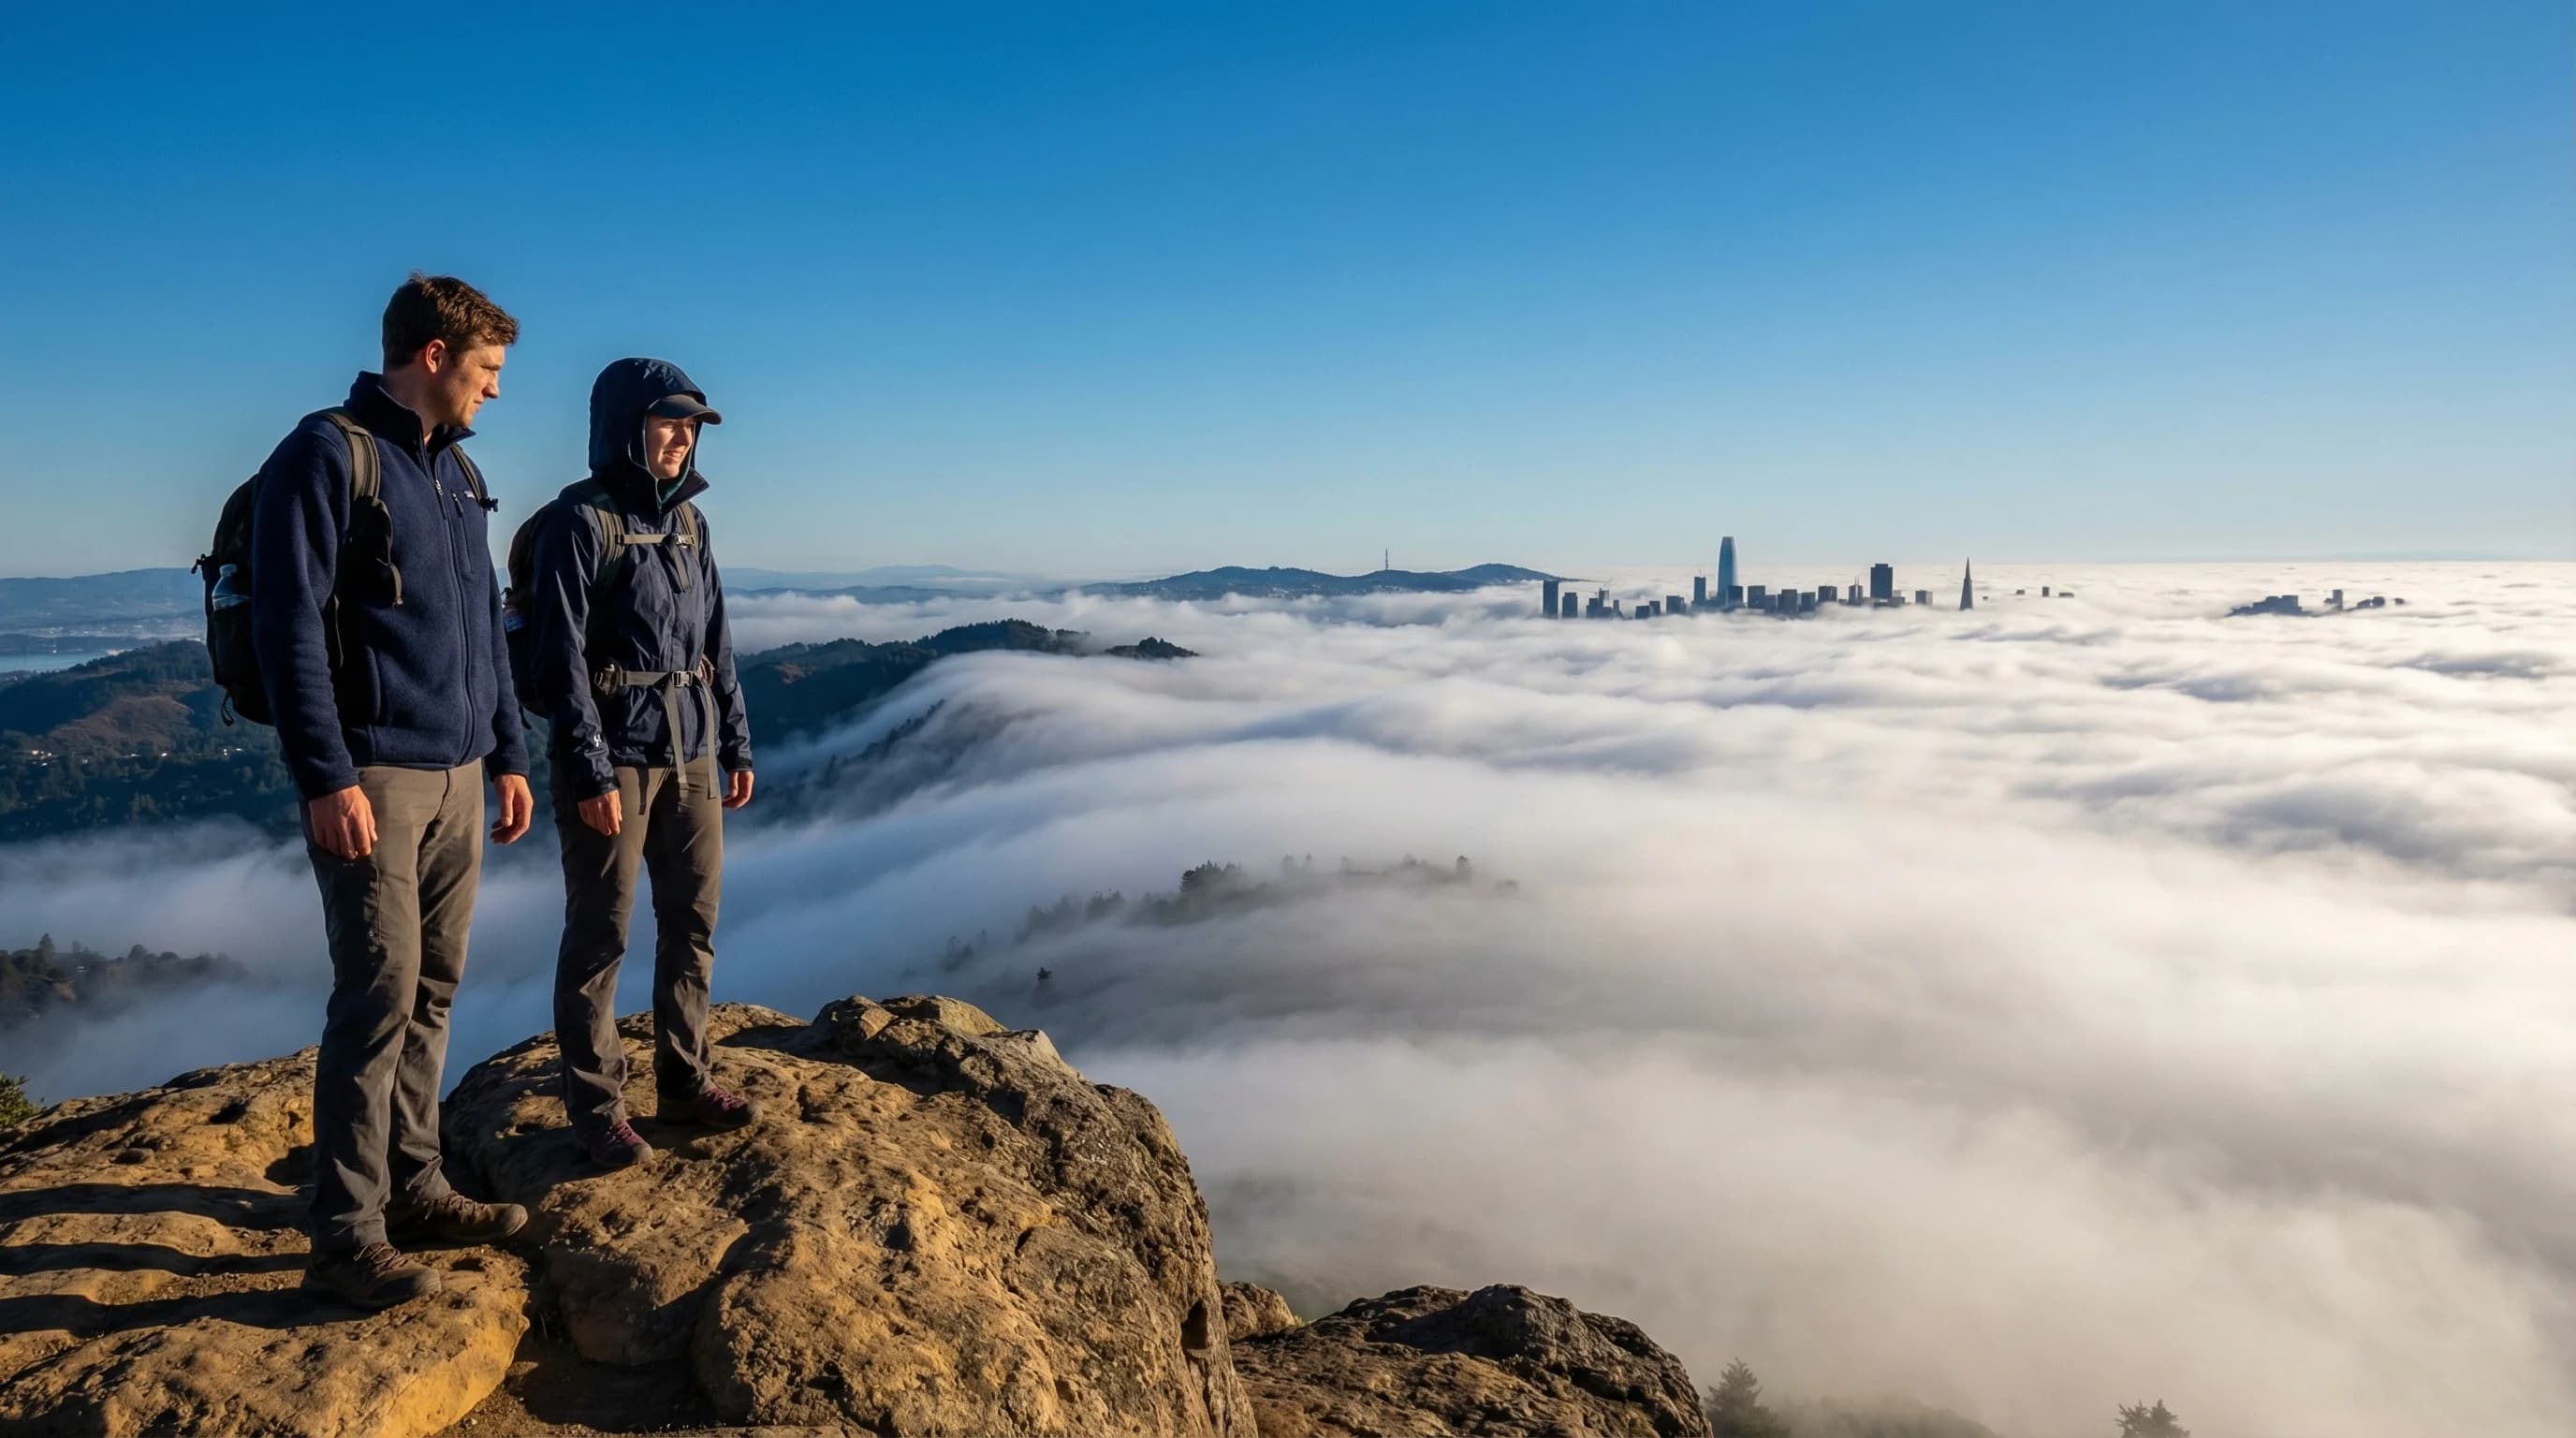
Mount Tamalpais intercepts the marine layer directly. The western slopes are the Bay Area's foggiest terrain, while the summit at 2,574 feet often rises above the fog into sunshine. Always bring a layer.
6min read →
Santa Cruz runs 10-12°F warmer than the Bay Area's Pacific coast in summer, averaging 70-74°F with afternoon fog clearance. It's the closest thing the Bay Area has to a traditional California beach town.
6min read →
Pacific coast beaches stay cold and foggy in summer. East Bay shore beaches reach 72°F. Santa Cruz hits 70-74°F, the Bay Area's best warm-beach option. Here's how to match beach type to weather.
6min read →
The Pacific off San Francisco is genuinely cold year-round, staying 52 to 58°F even in summer. Counterintuitively, fall is the warmest window for ocean swimming as summer's upwelling relaxes. A wetsuit is almost always necessary.
5min read →
Temperature inversions, warm air sitting above cool air, preventing vertical mixing, explains the marine layer's sharp fog ceiling, winter tule fog that persists for days, and the Bay Area's worst air quality episodes.
6min read →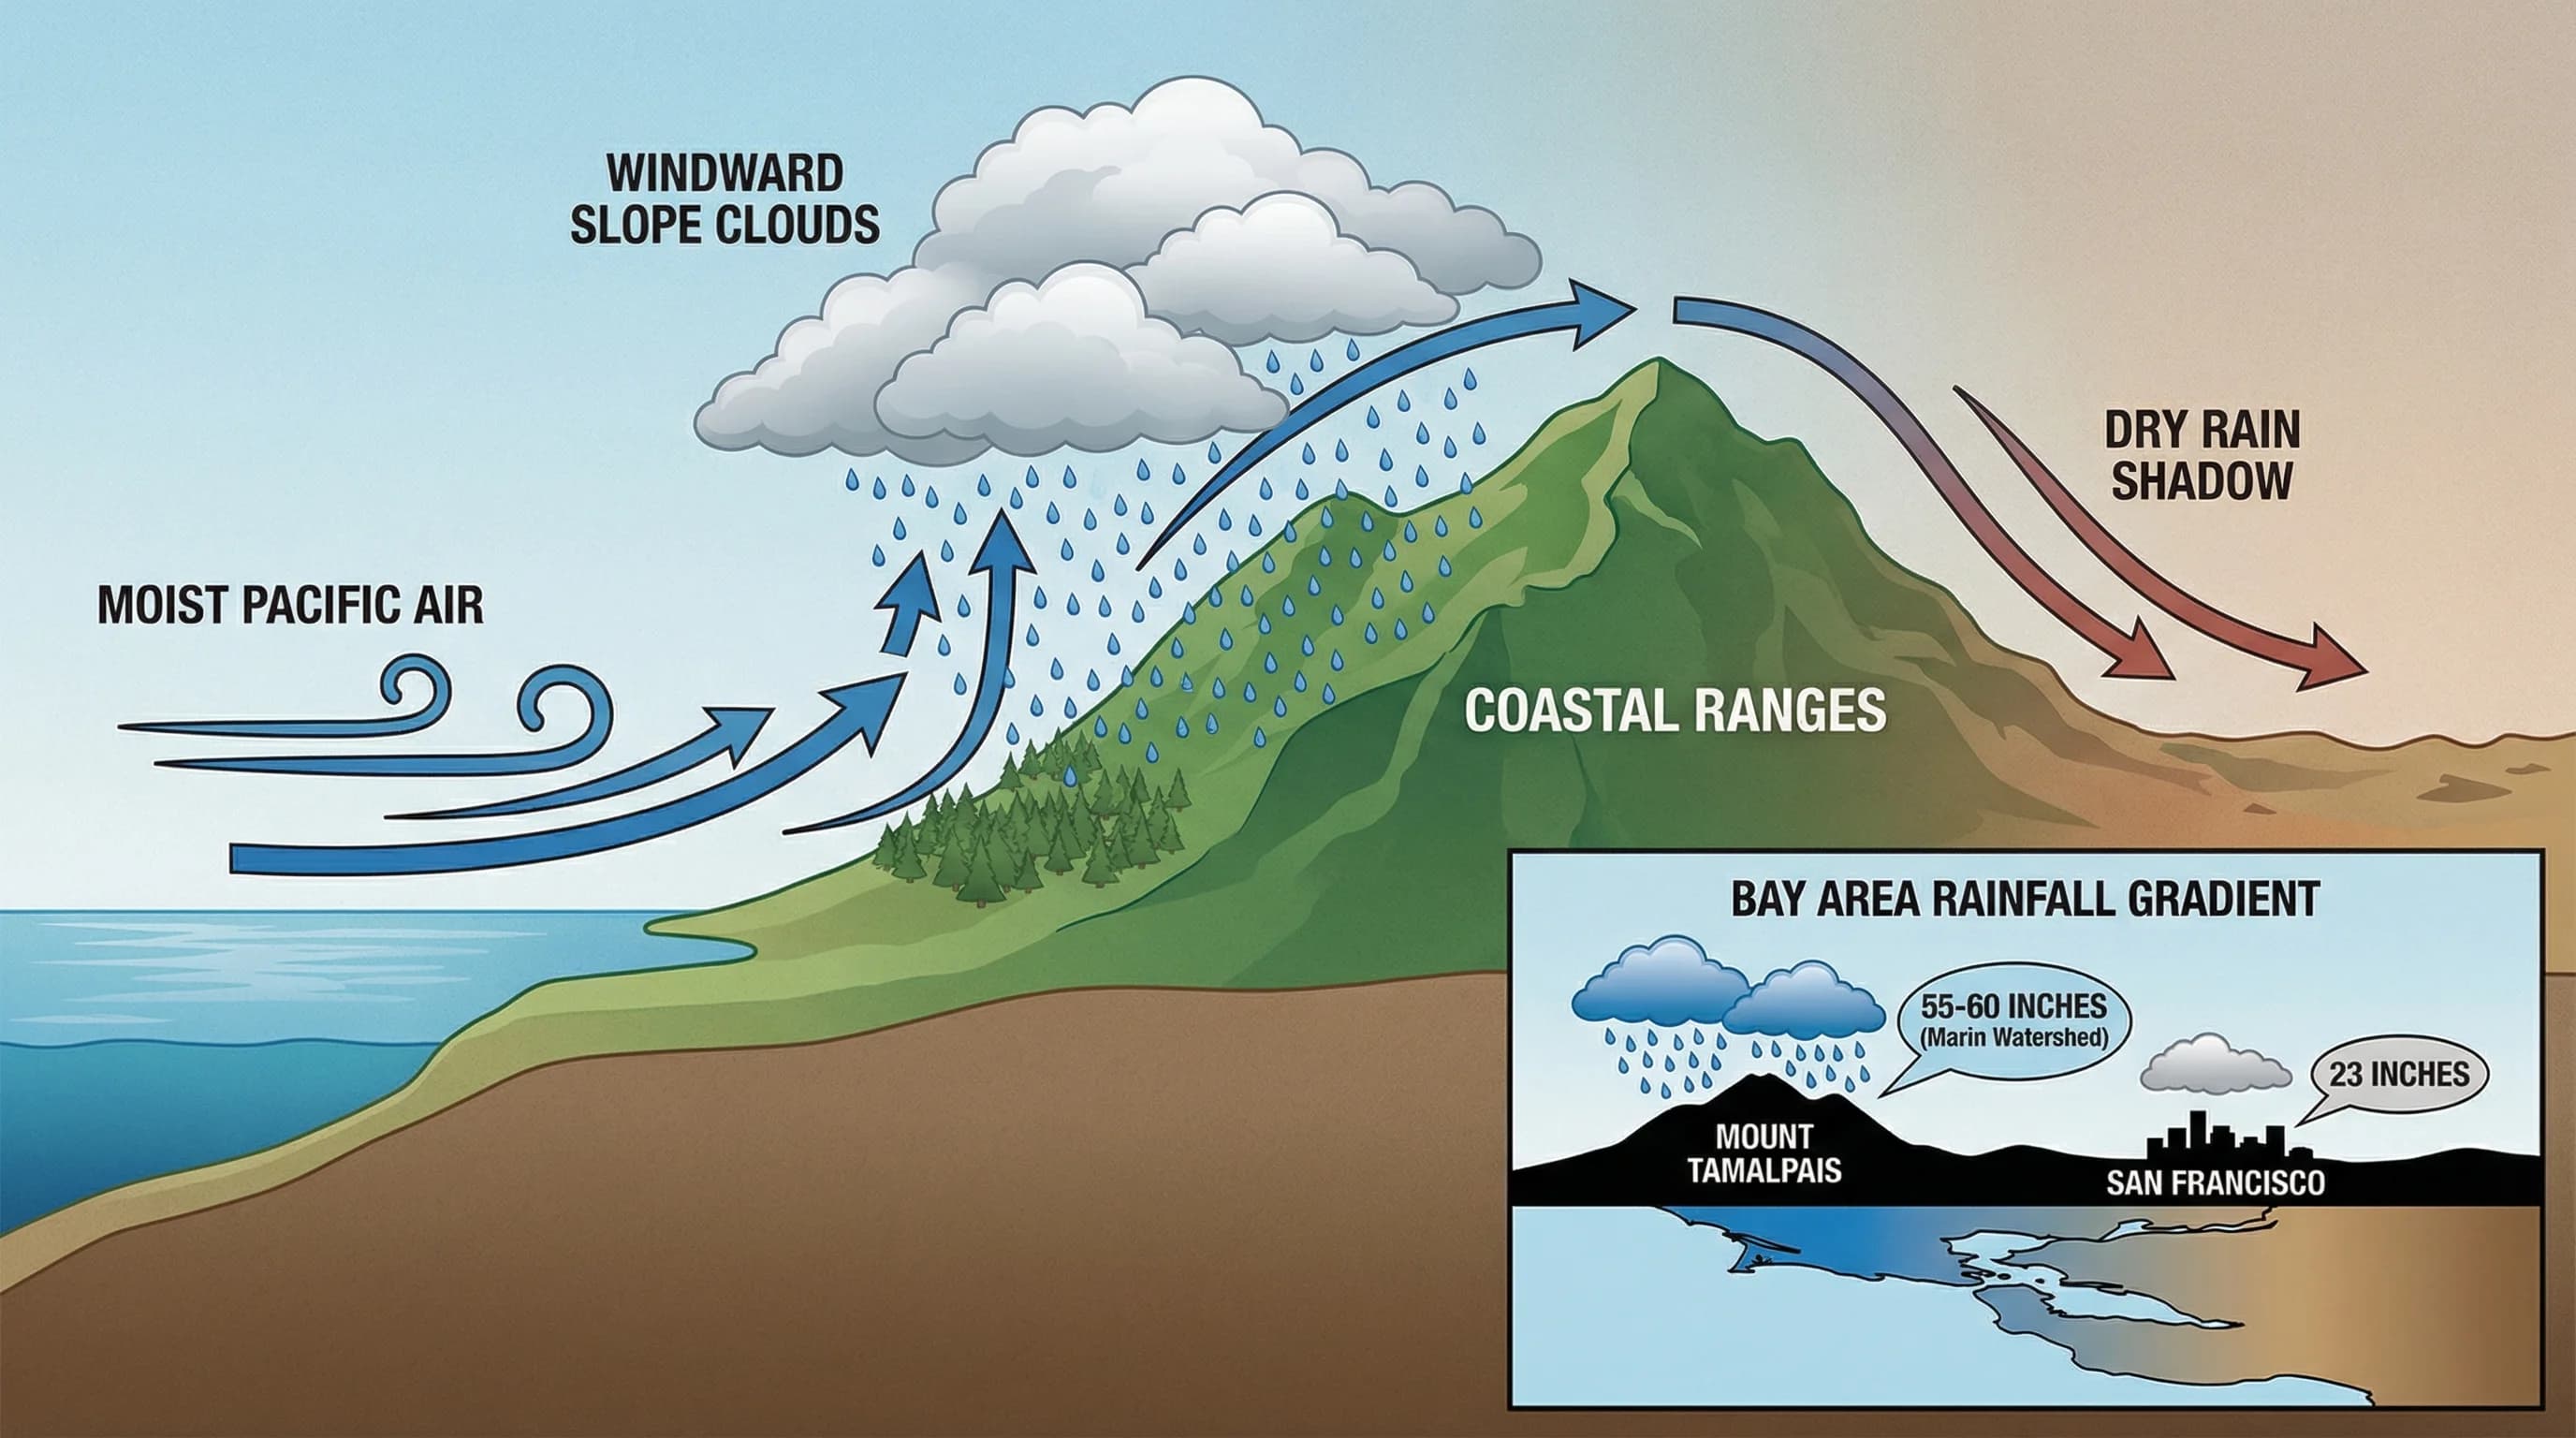
Bay Area rainfall varies from 15 to 60 inches within 30 miles, almost entirely due to orographic enhancement. The hills and mountains force moist Pacific air upward, wringing out rain on windward slopes that flat areas never receive.
6min read →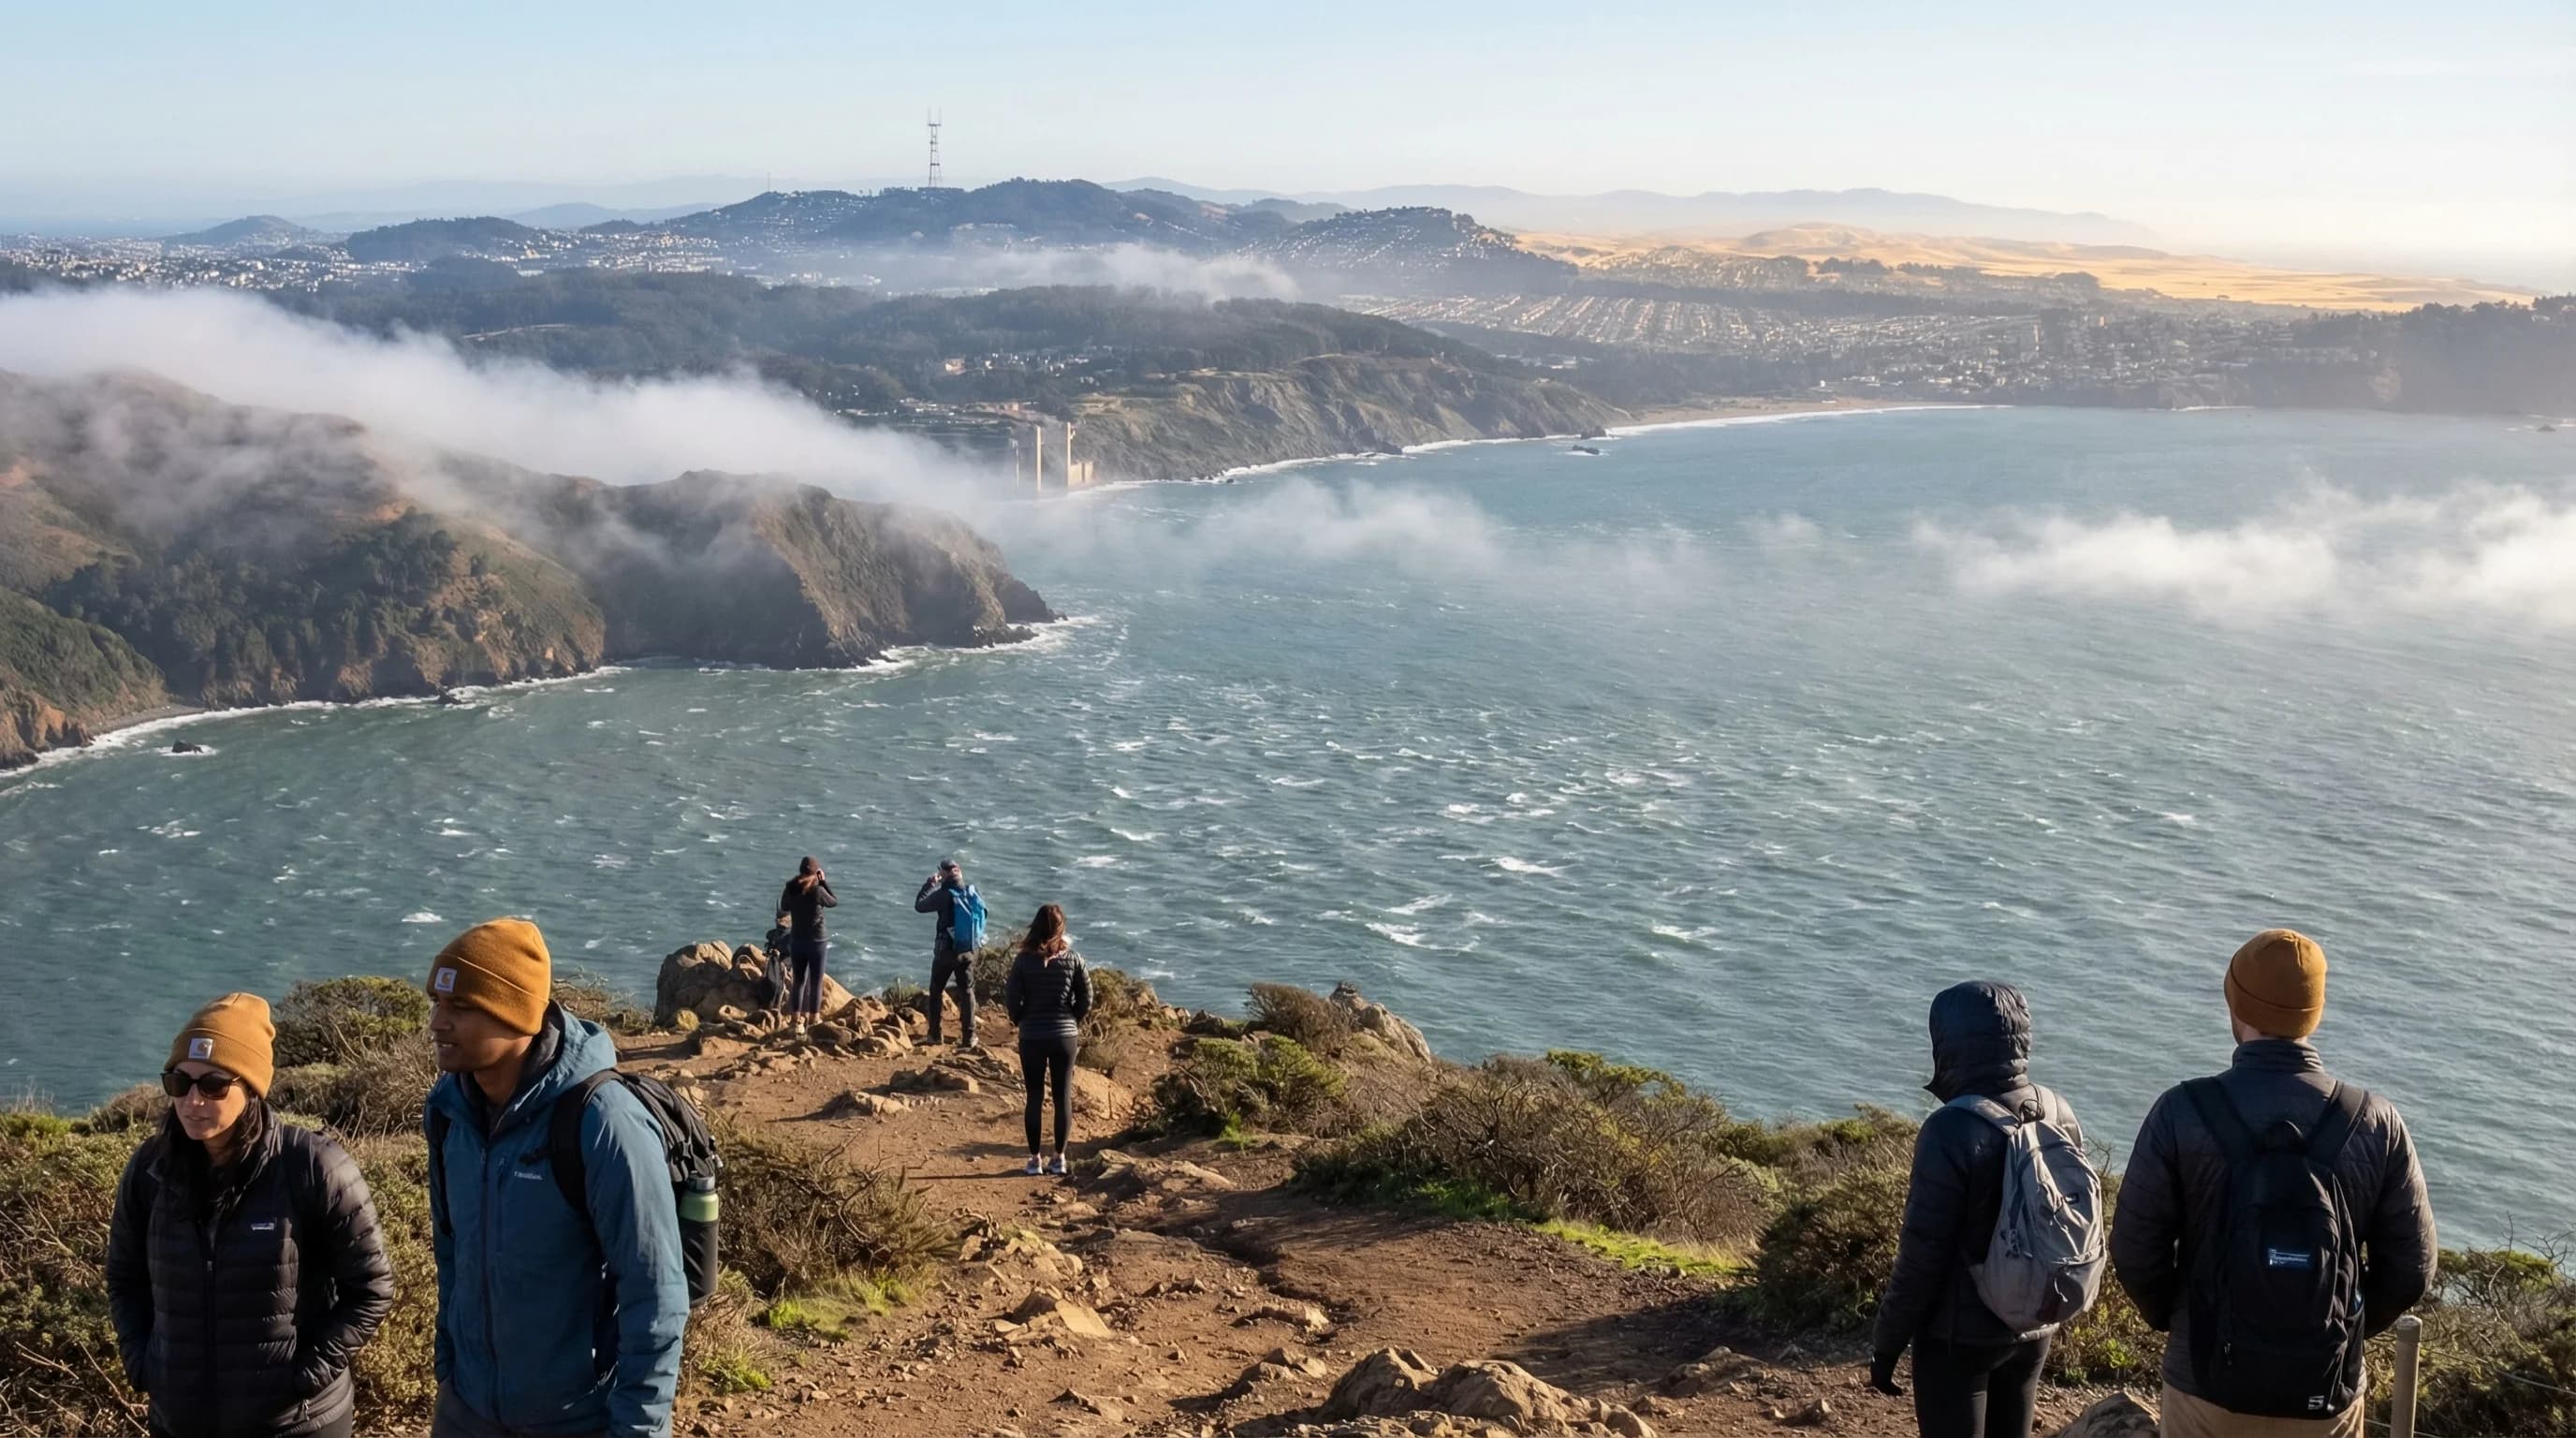
The Bay Area sea breeze is the region's most important summer weather mechanism, Pacific marine air flows through the Golden Gate, across the Bay, and into the Central Valley, cooling inland valleys 15-20°F in an hour.
6min read →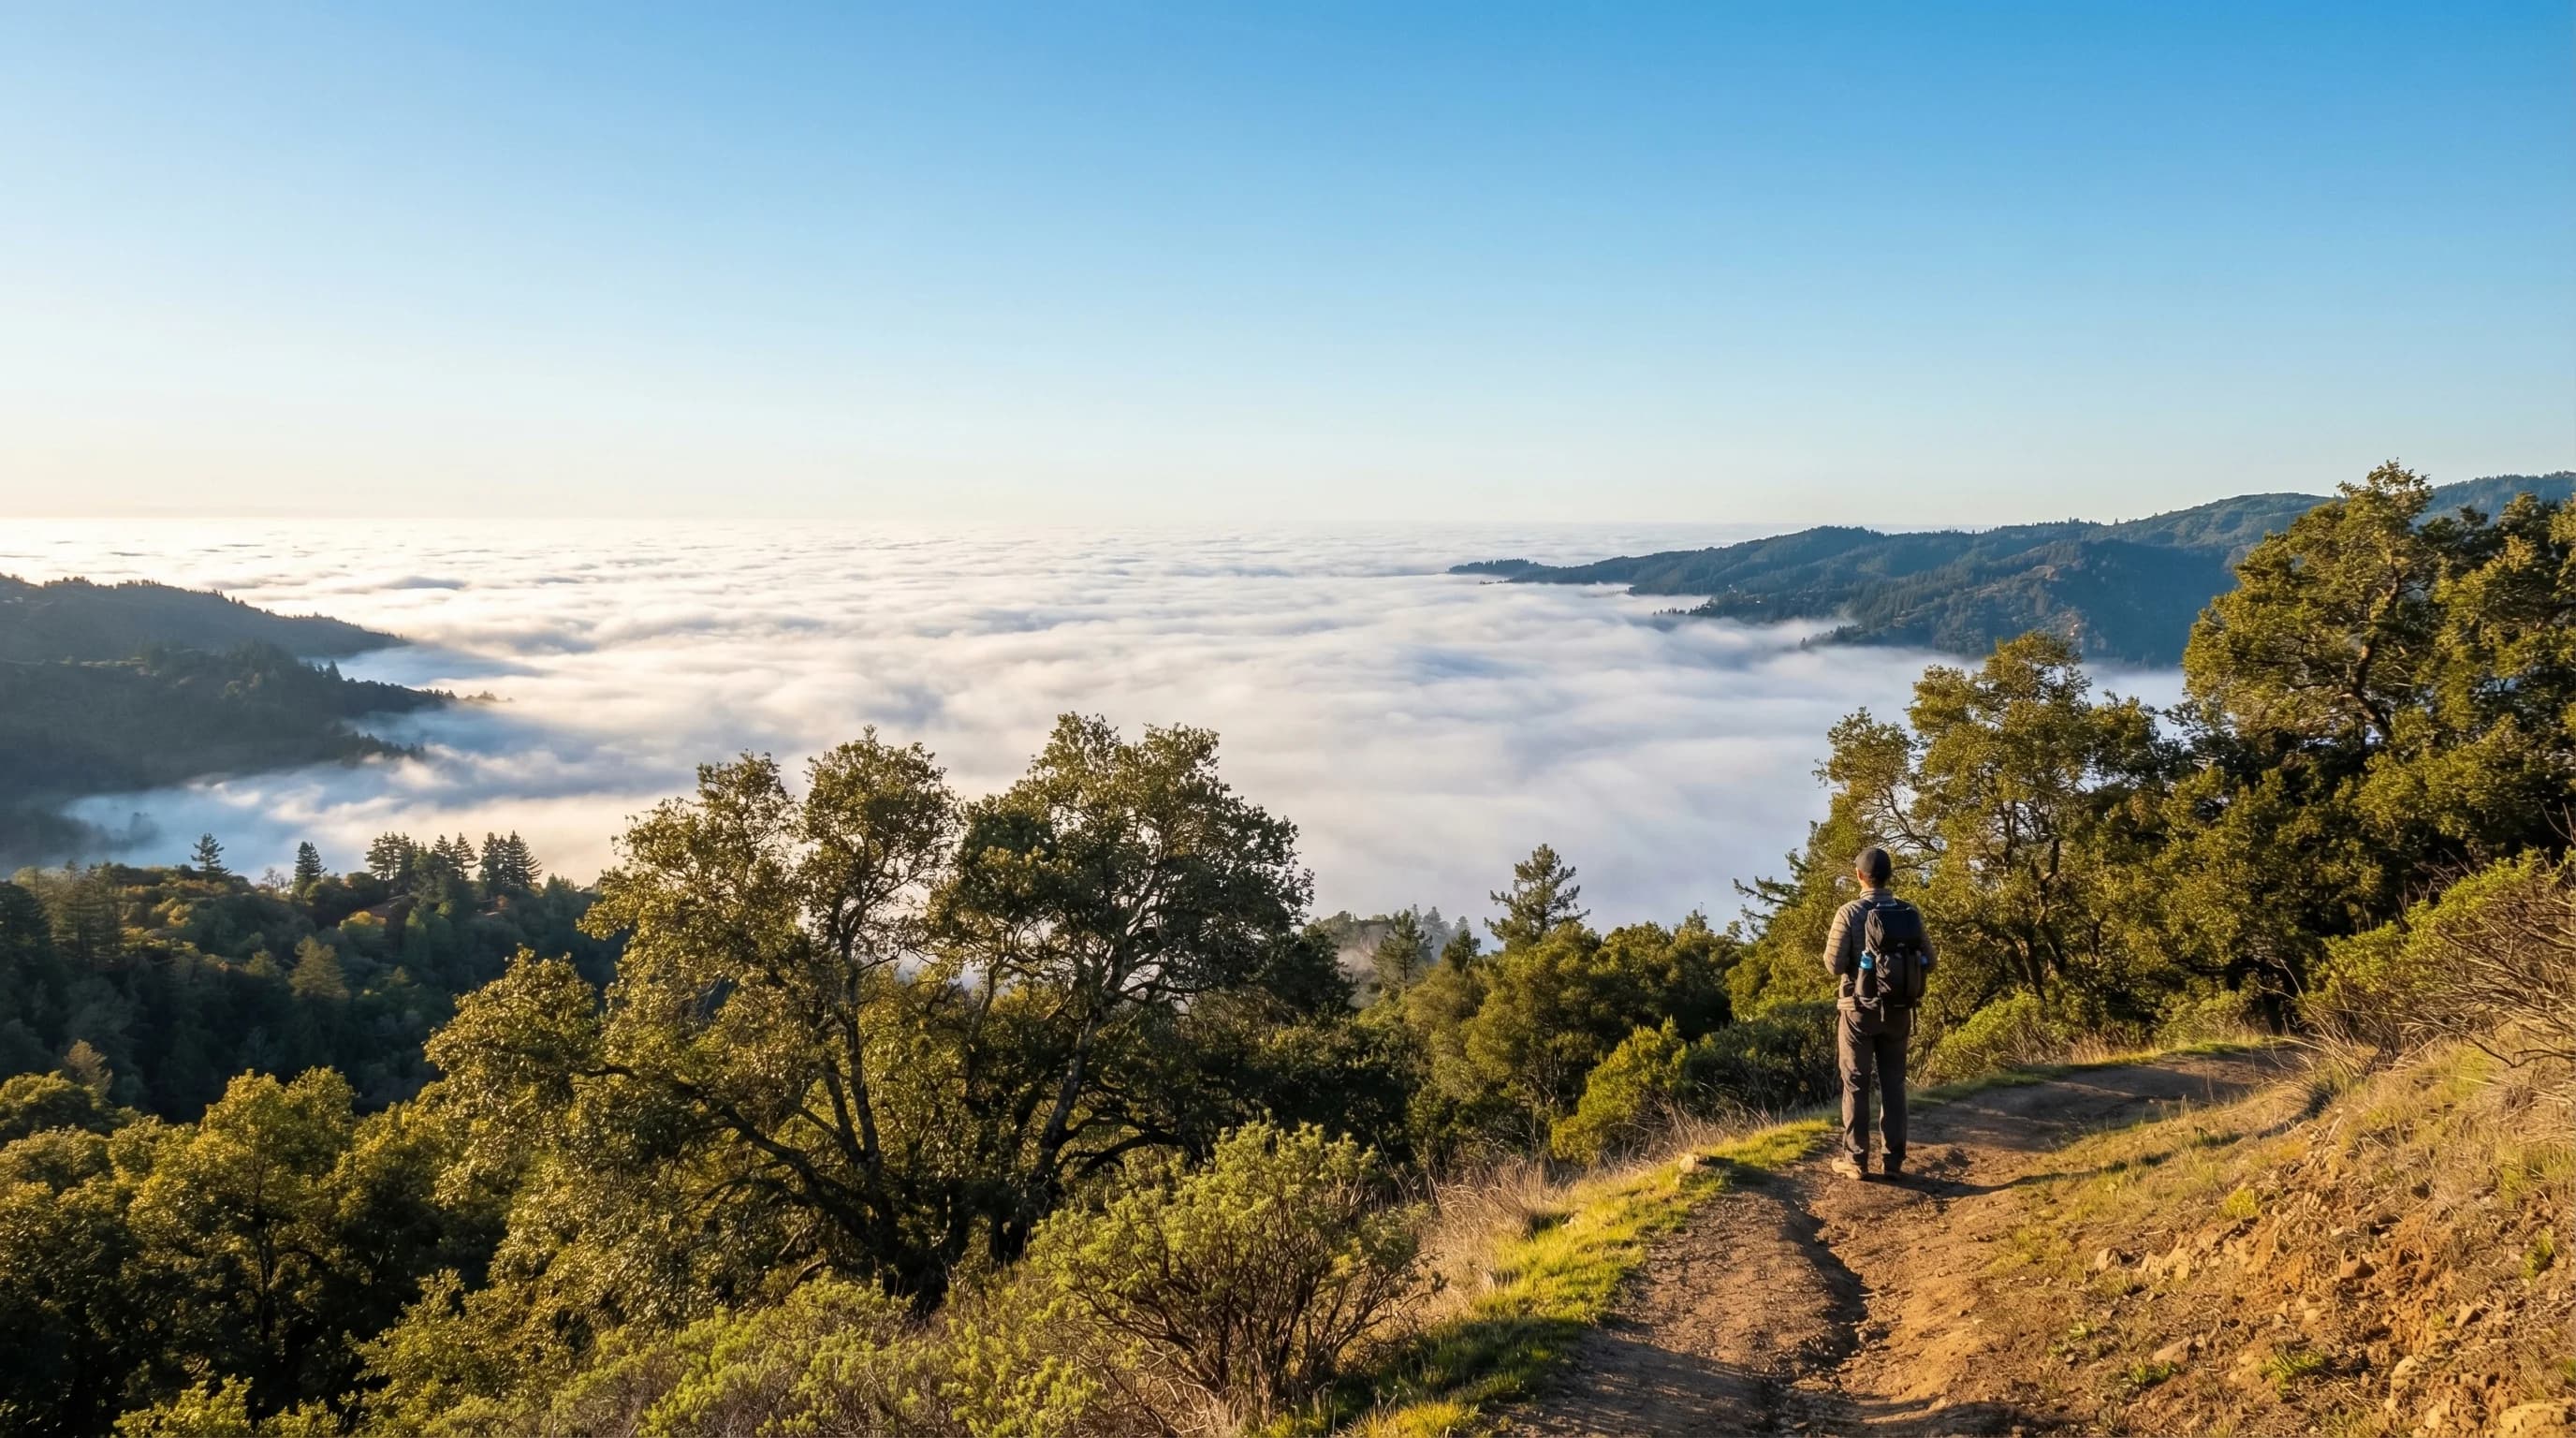
The marine layer fog has a ceiling set by the temperature inversion base. Hillside neighborhoods above that line, typically 800-1,500 feet, can sit in sunshine while the flatlands below are completely socked in, sometimes with a 20°F temperature difference.
6min read →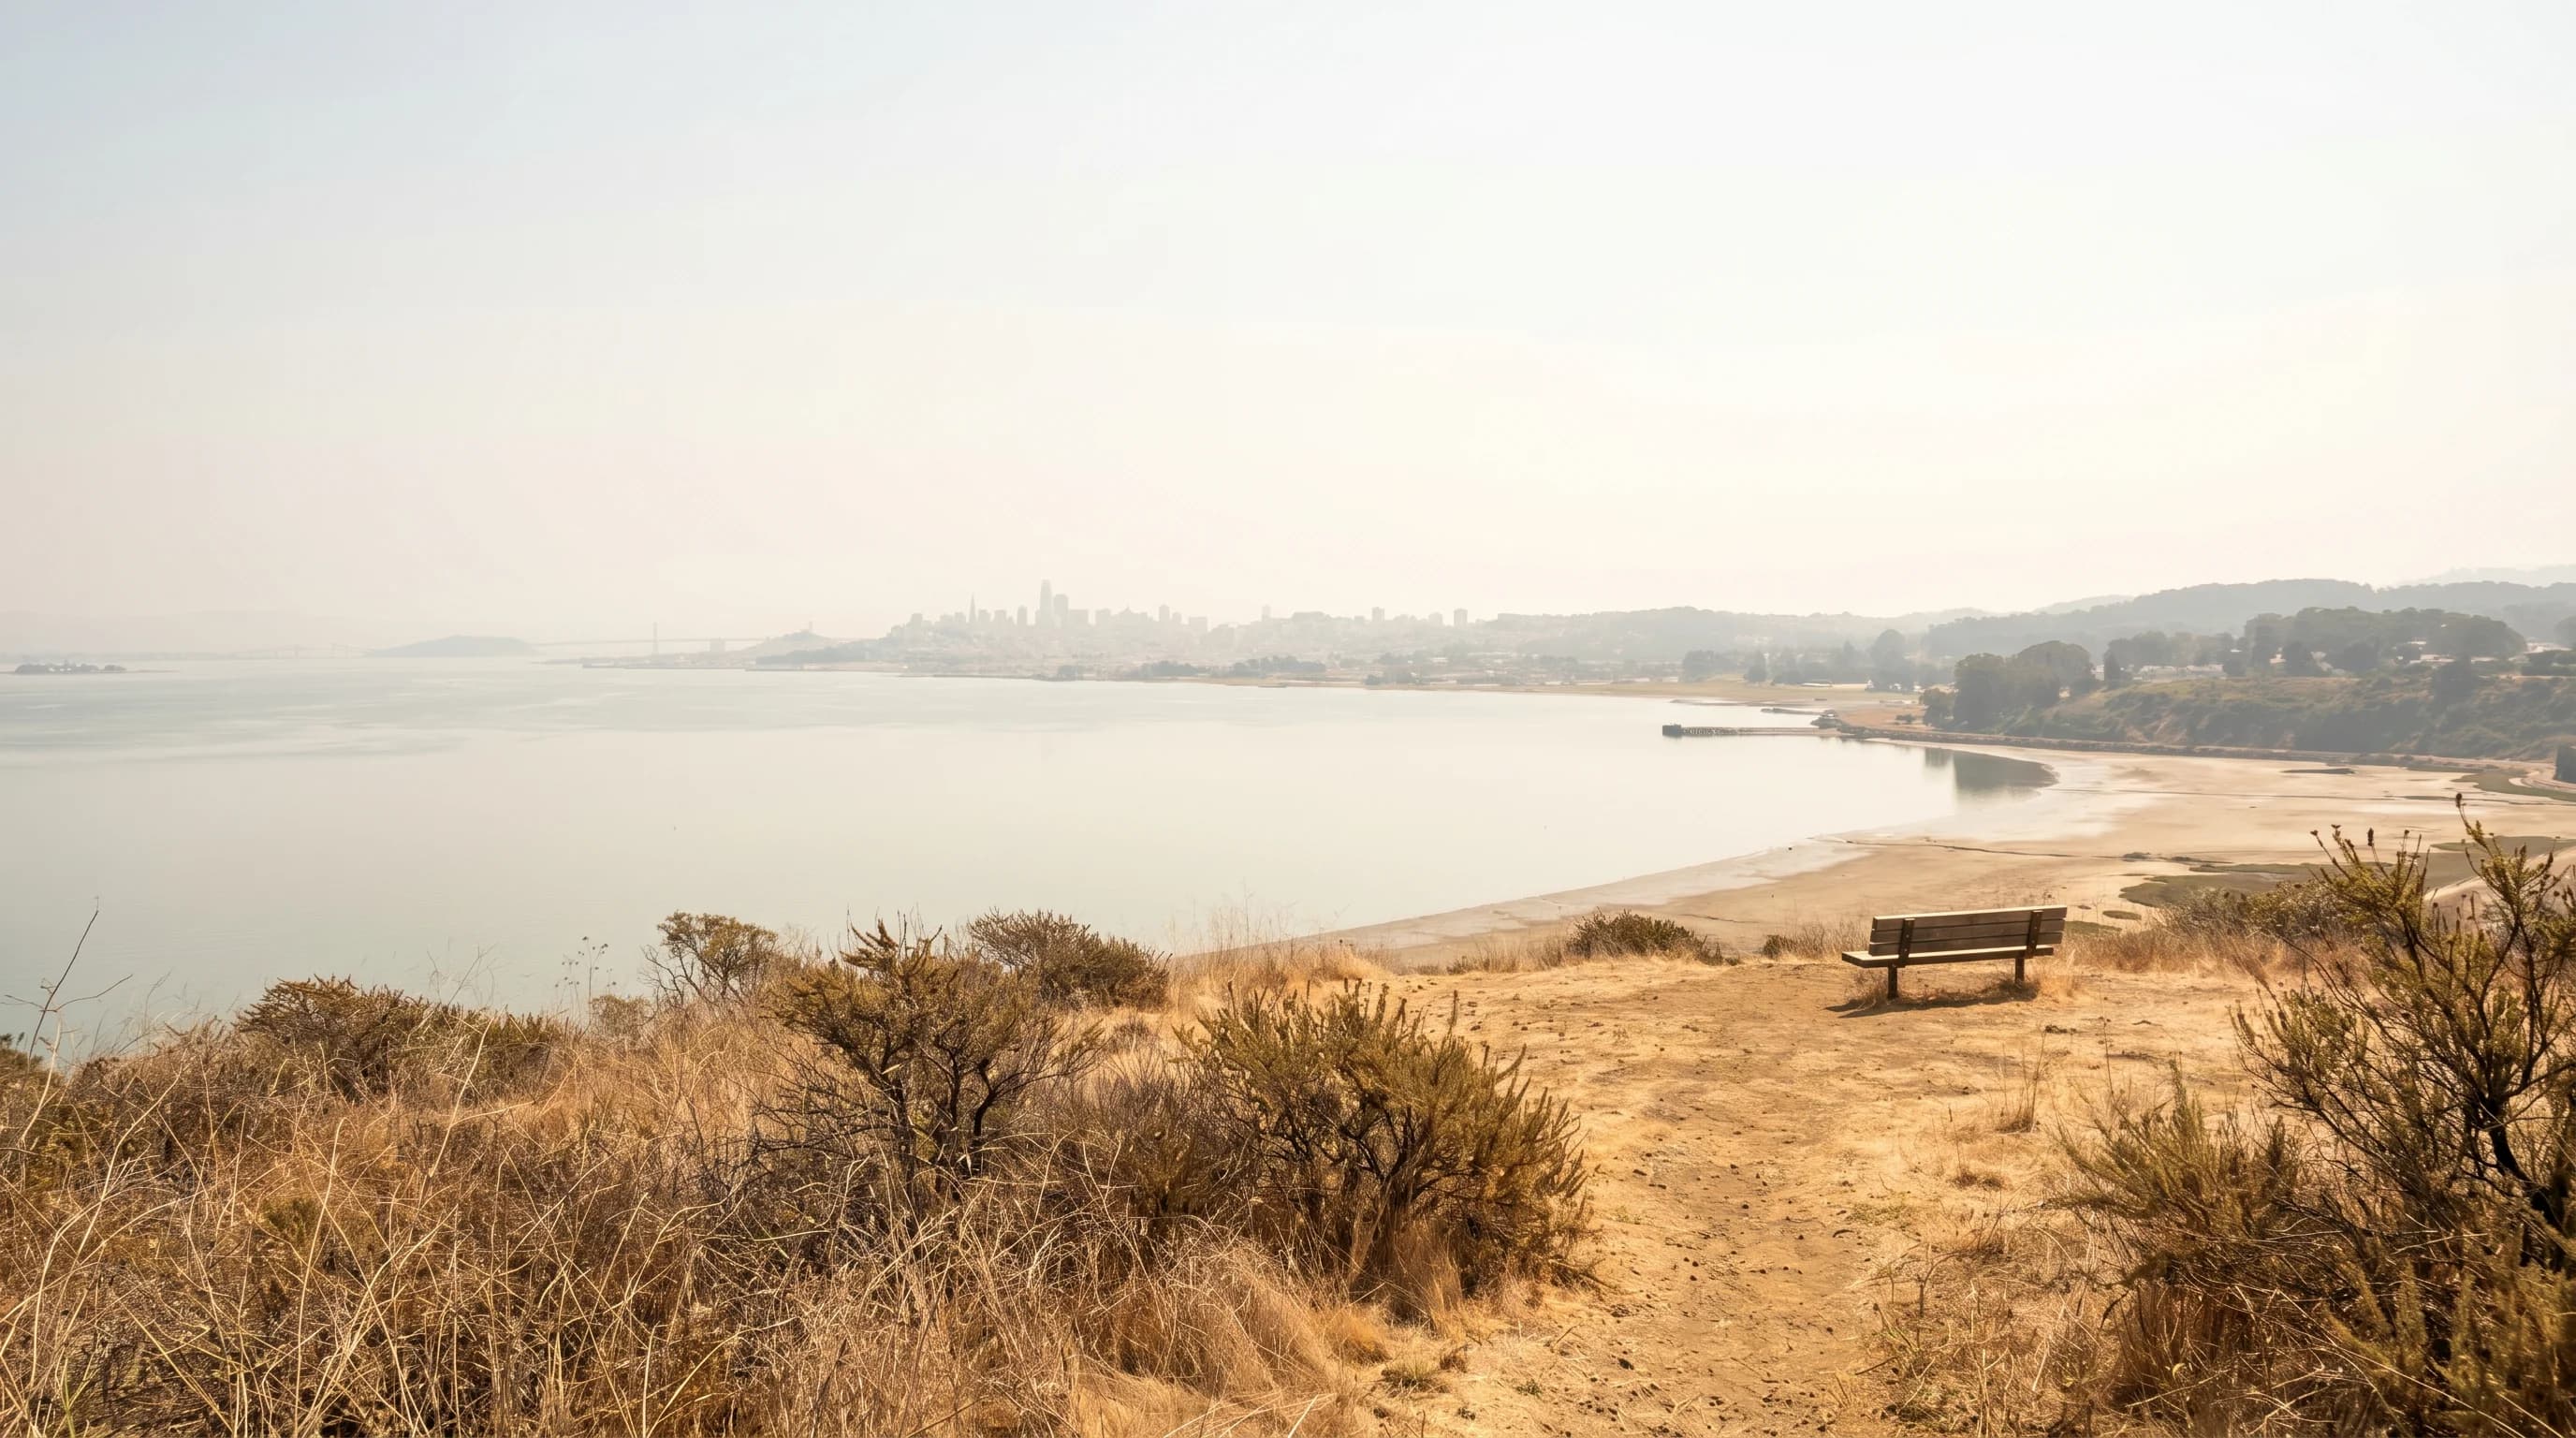
A heat dome forms when a high-pressure ridge stalls over California, suppressing the marine layer and allowing the ground to heat progressively over multiple days. Events that push normally mild Bay Area cities above 100°F are increasing in frequency.
6min read →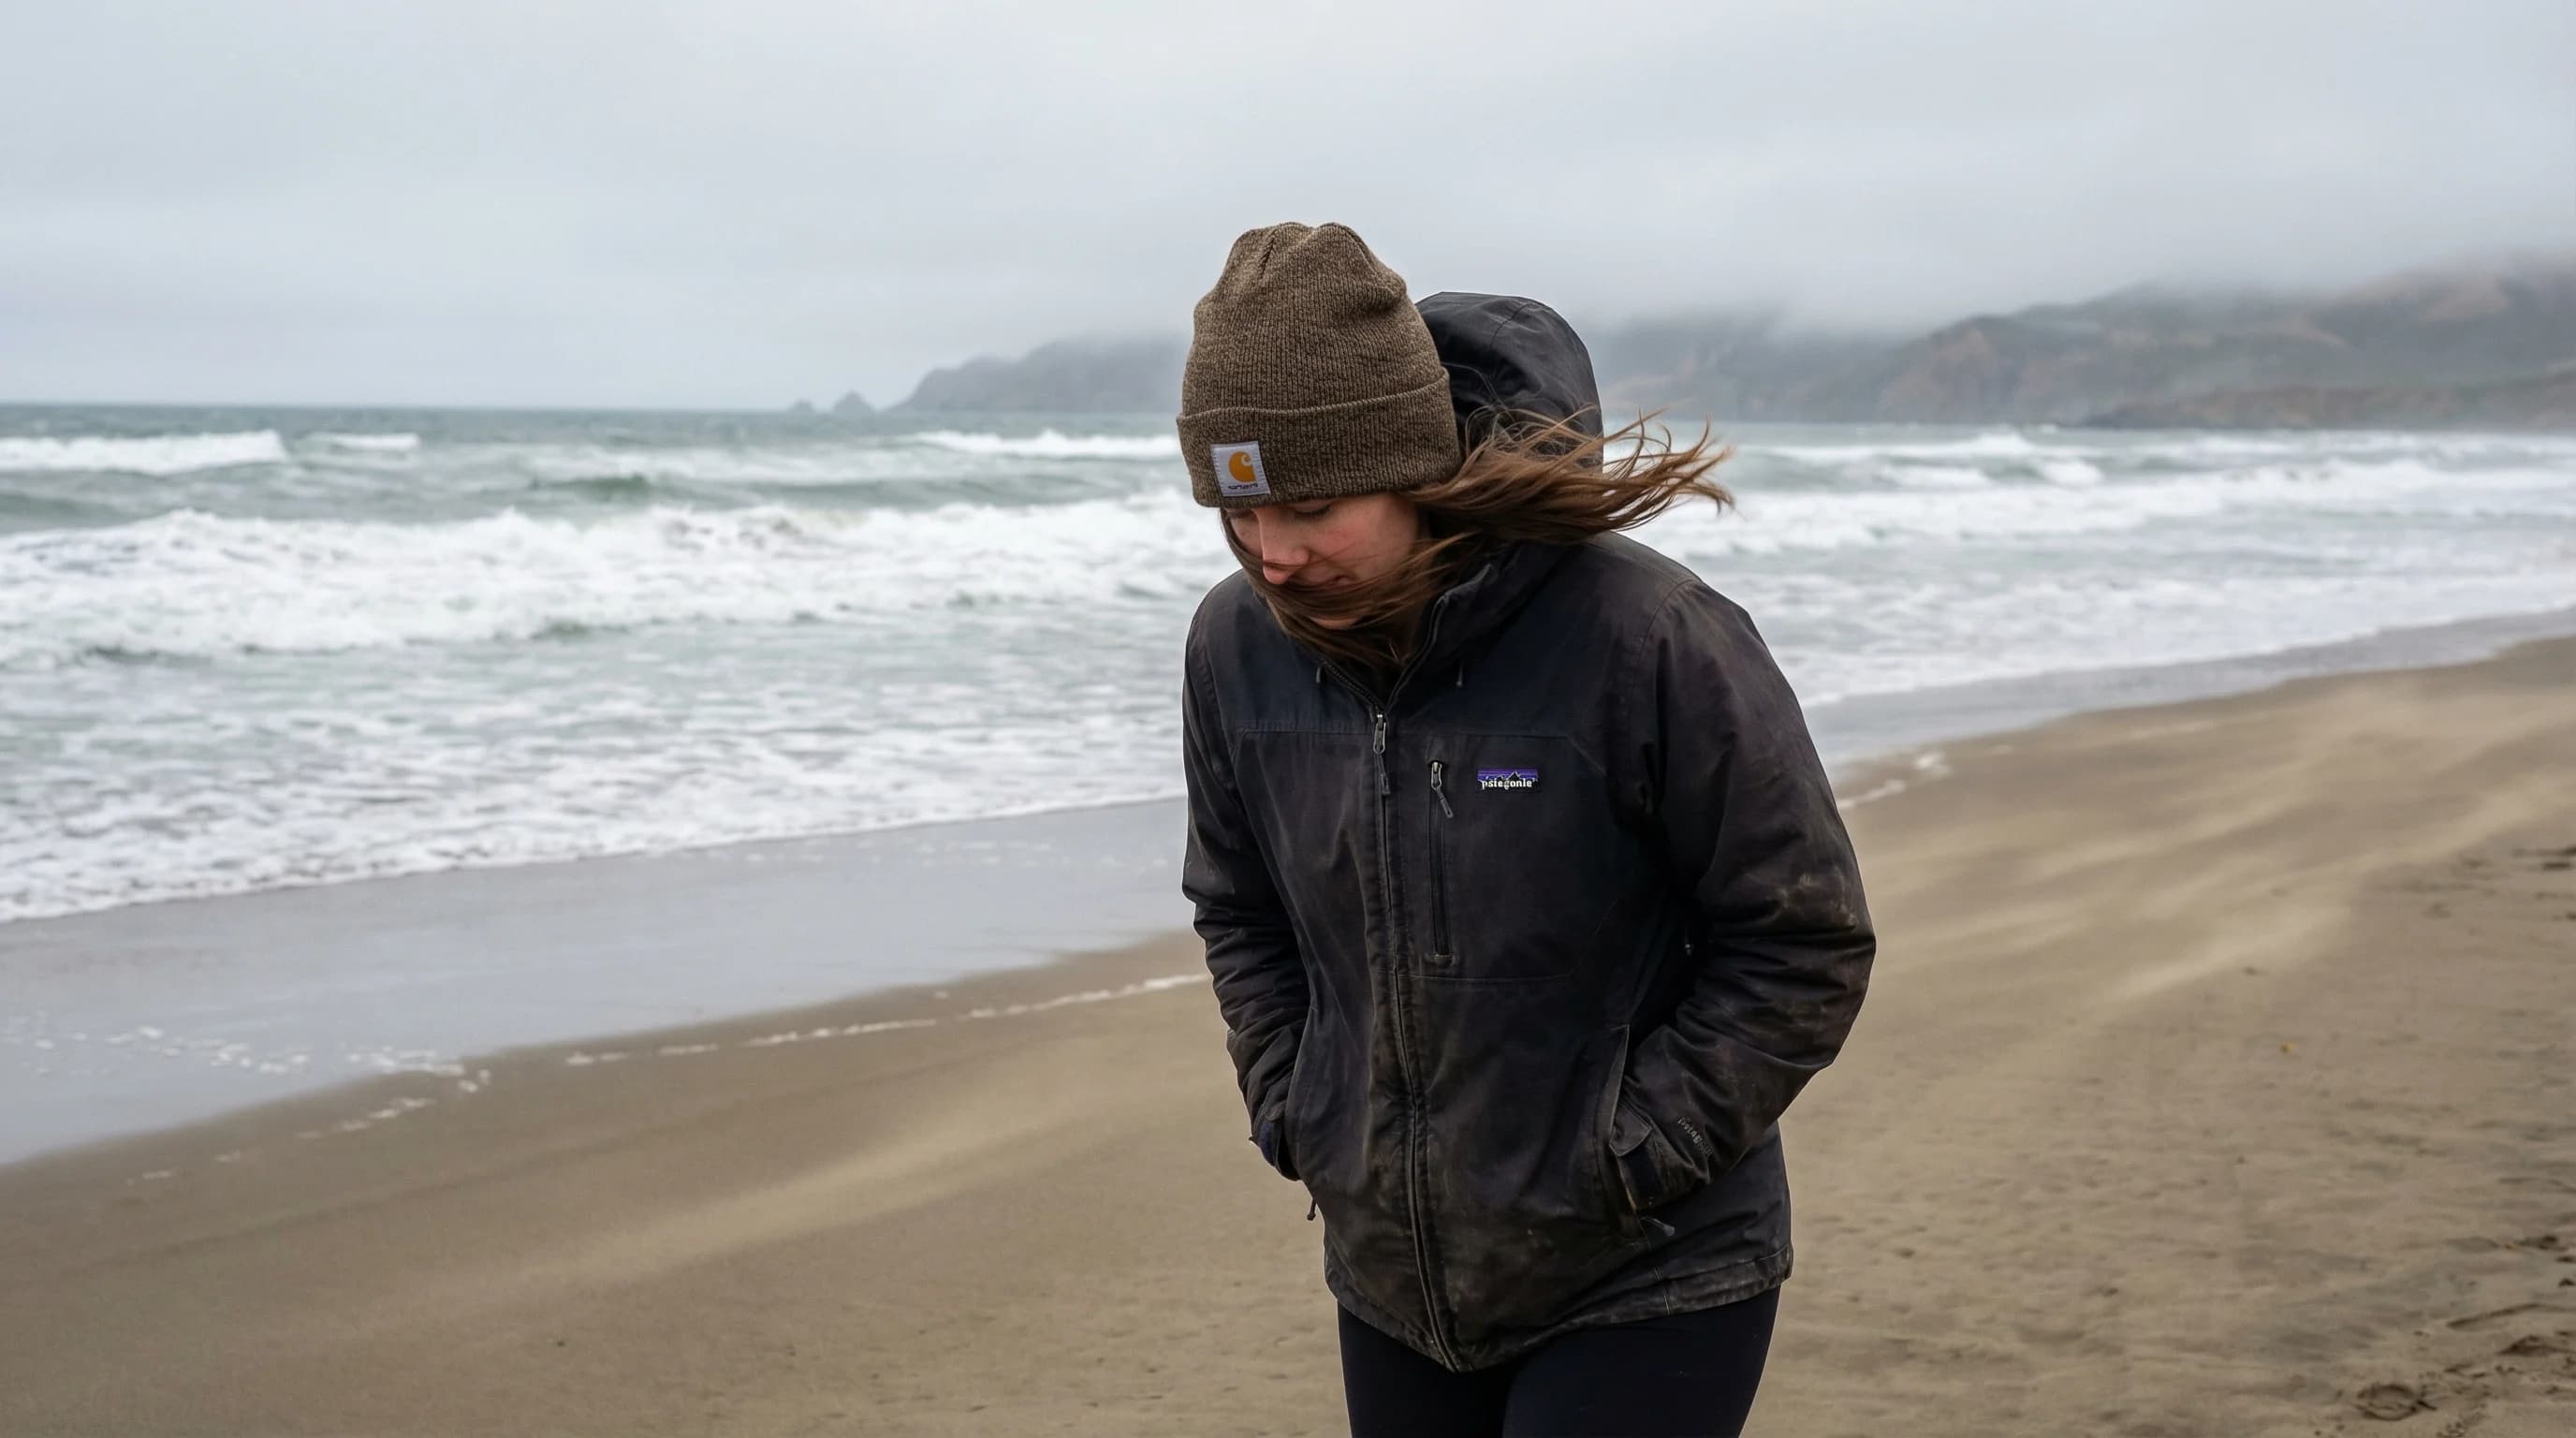
Wind chill operates in temperature ranges most people consider mild, which is why July visitors to Ocean Beach are consistently underdressed. A 60°F day with 25 mph coastal winds feels like 48°F, and fog adds even more cooling beyond the standard formula.
5min read →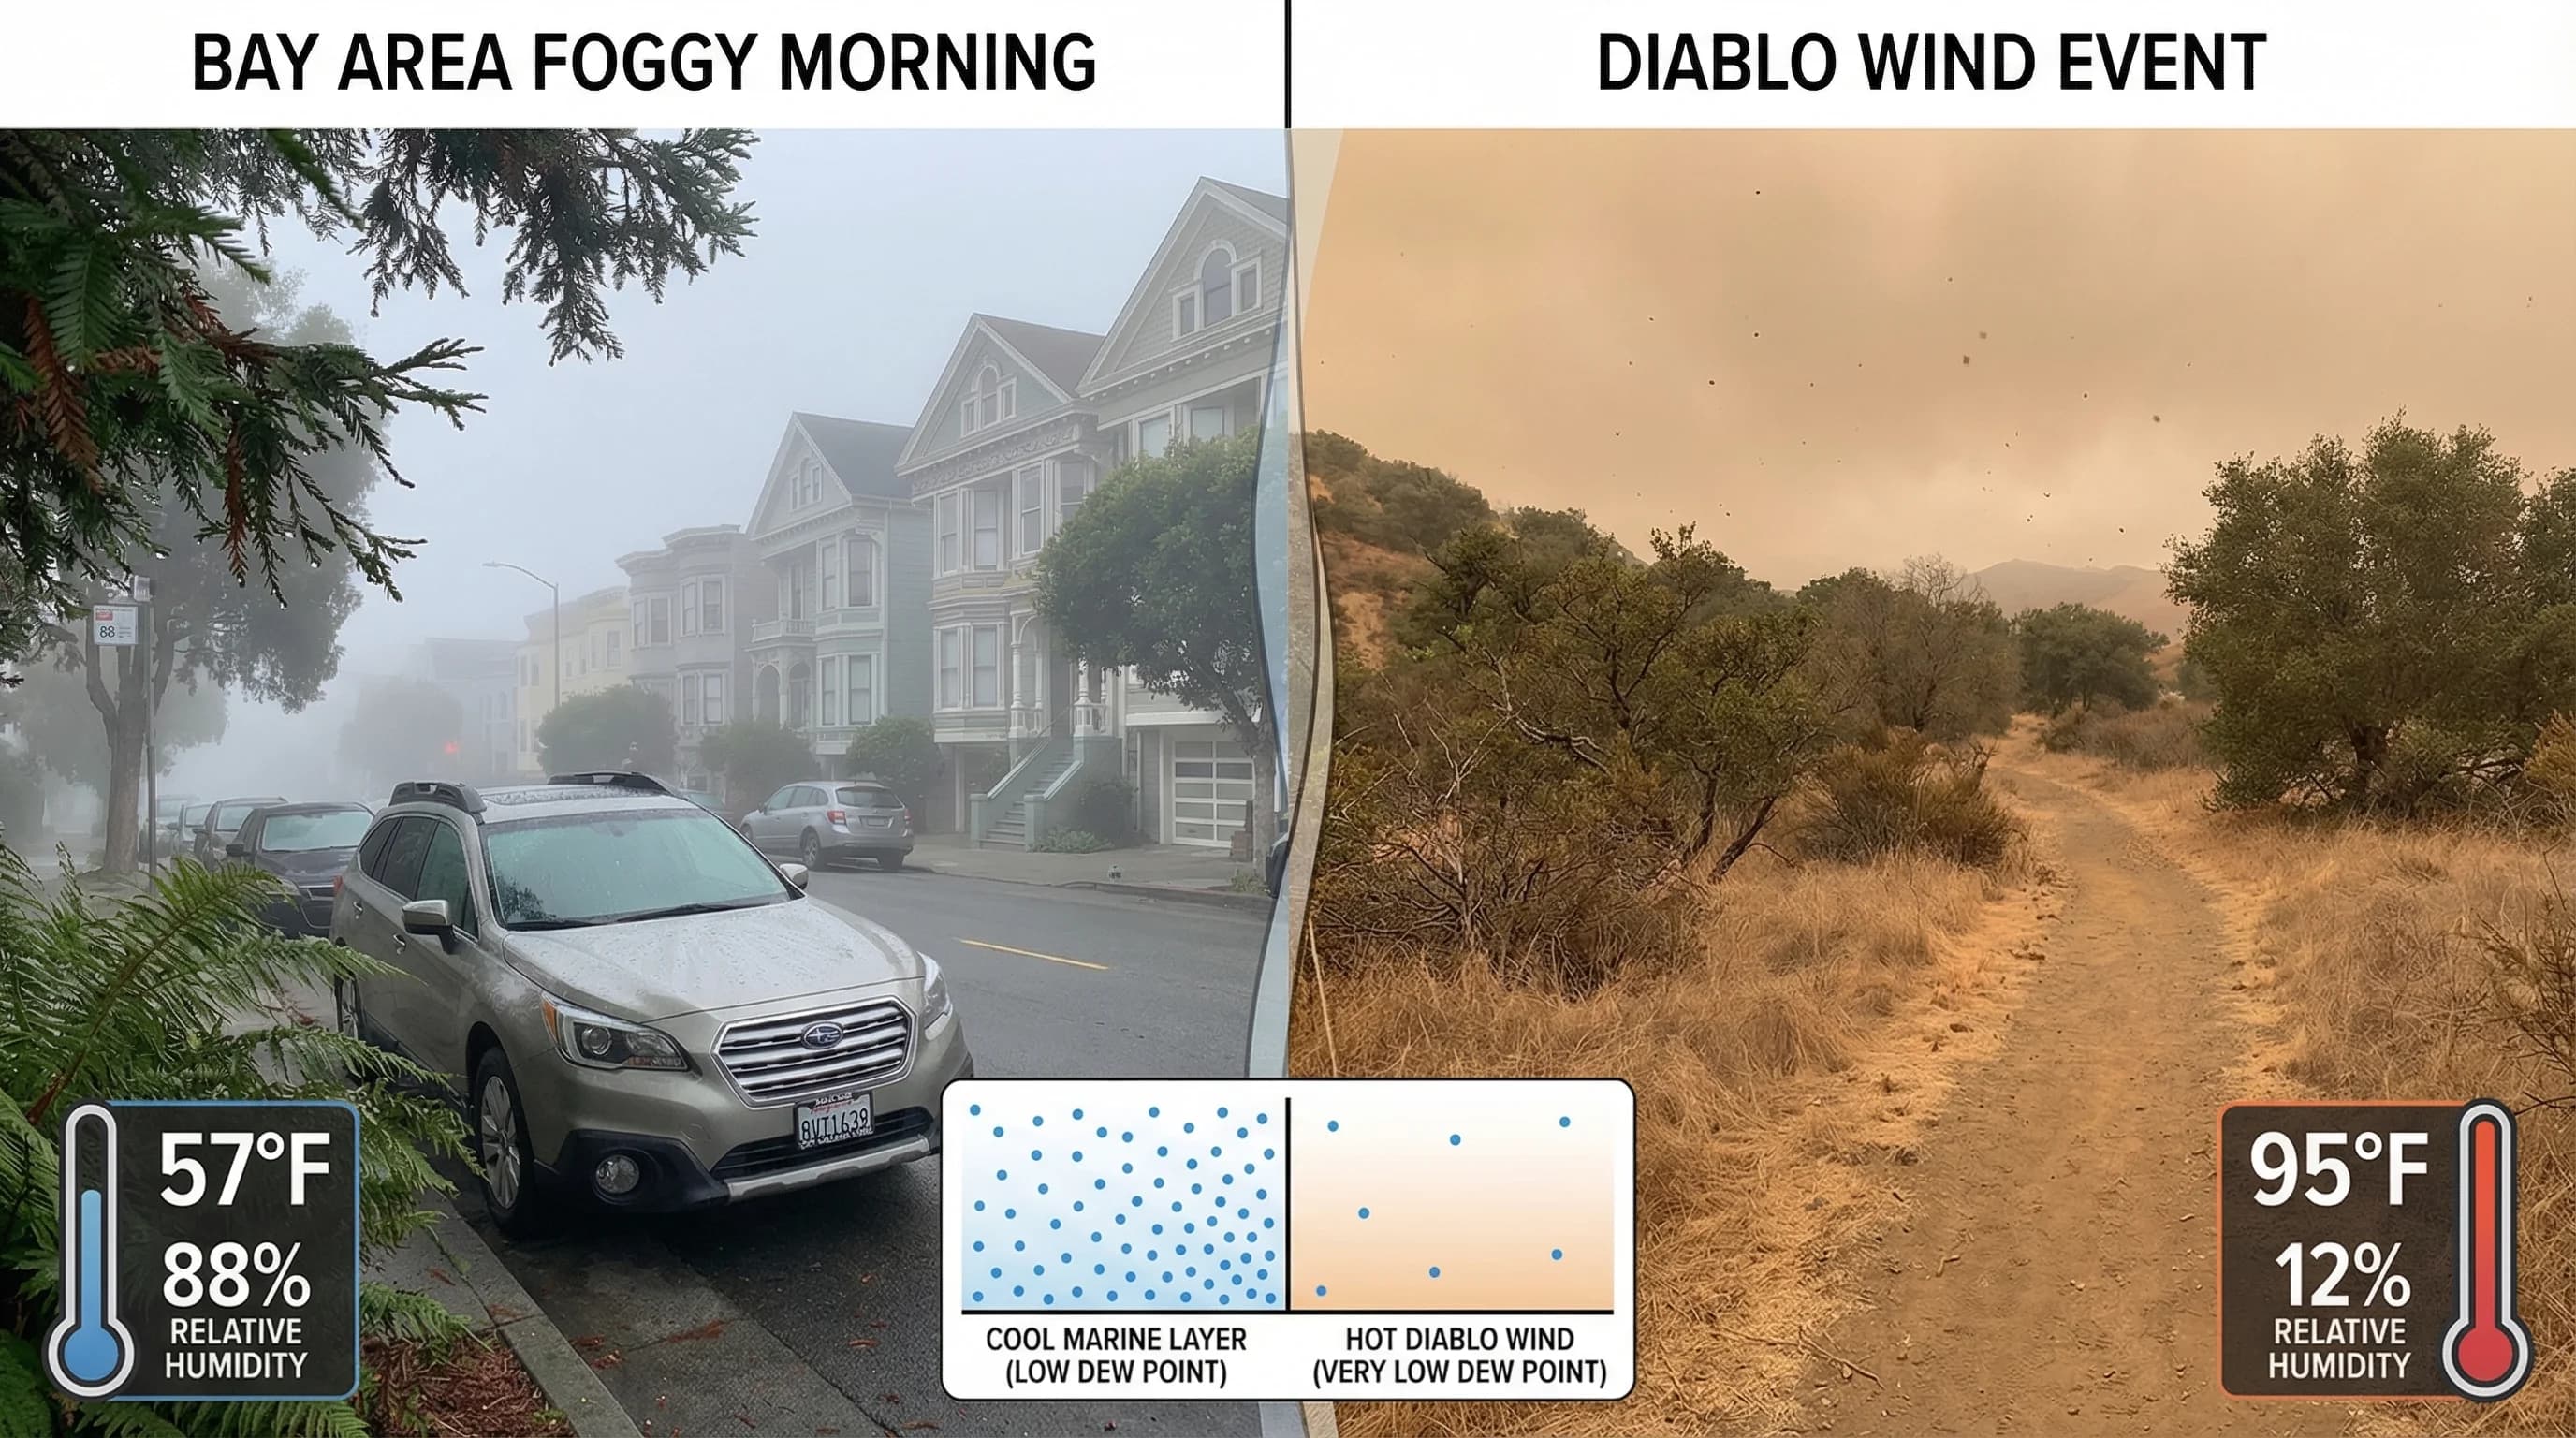
Bay Area fog can read 90% relative humidity without feeling muggy, because the dew point is only 50-55°F, modest by global standards. During Diablo wind events, dew point crashes below 30°F, creating genuinely desiccating conditions.
5min read →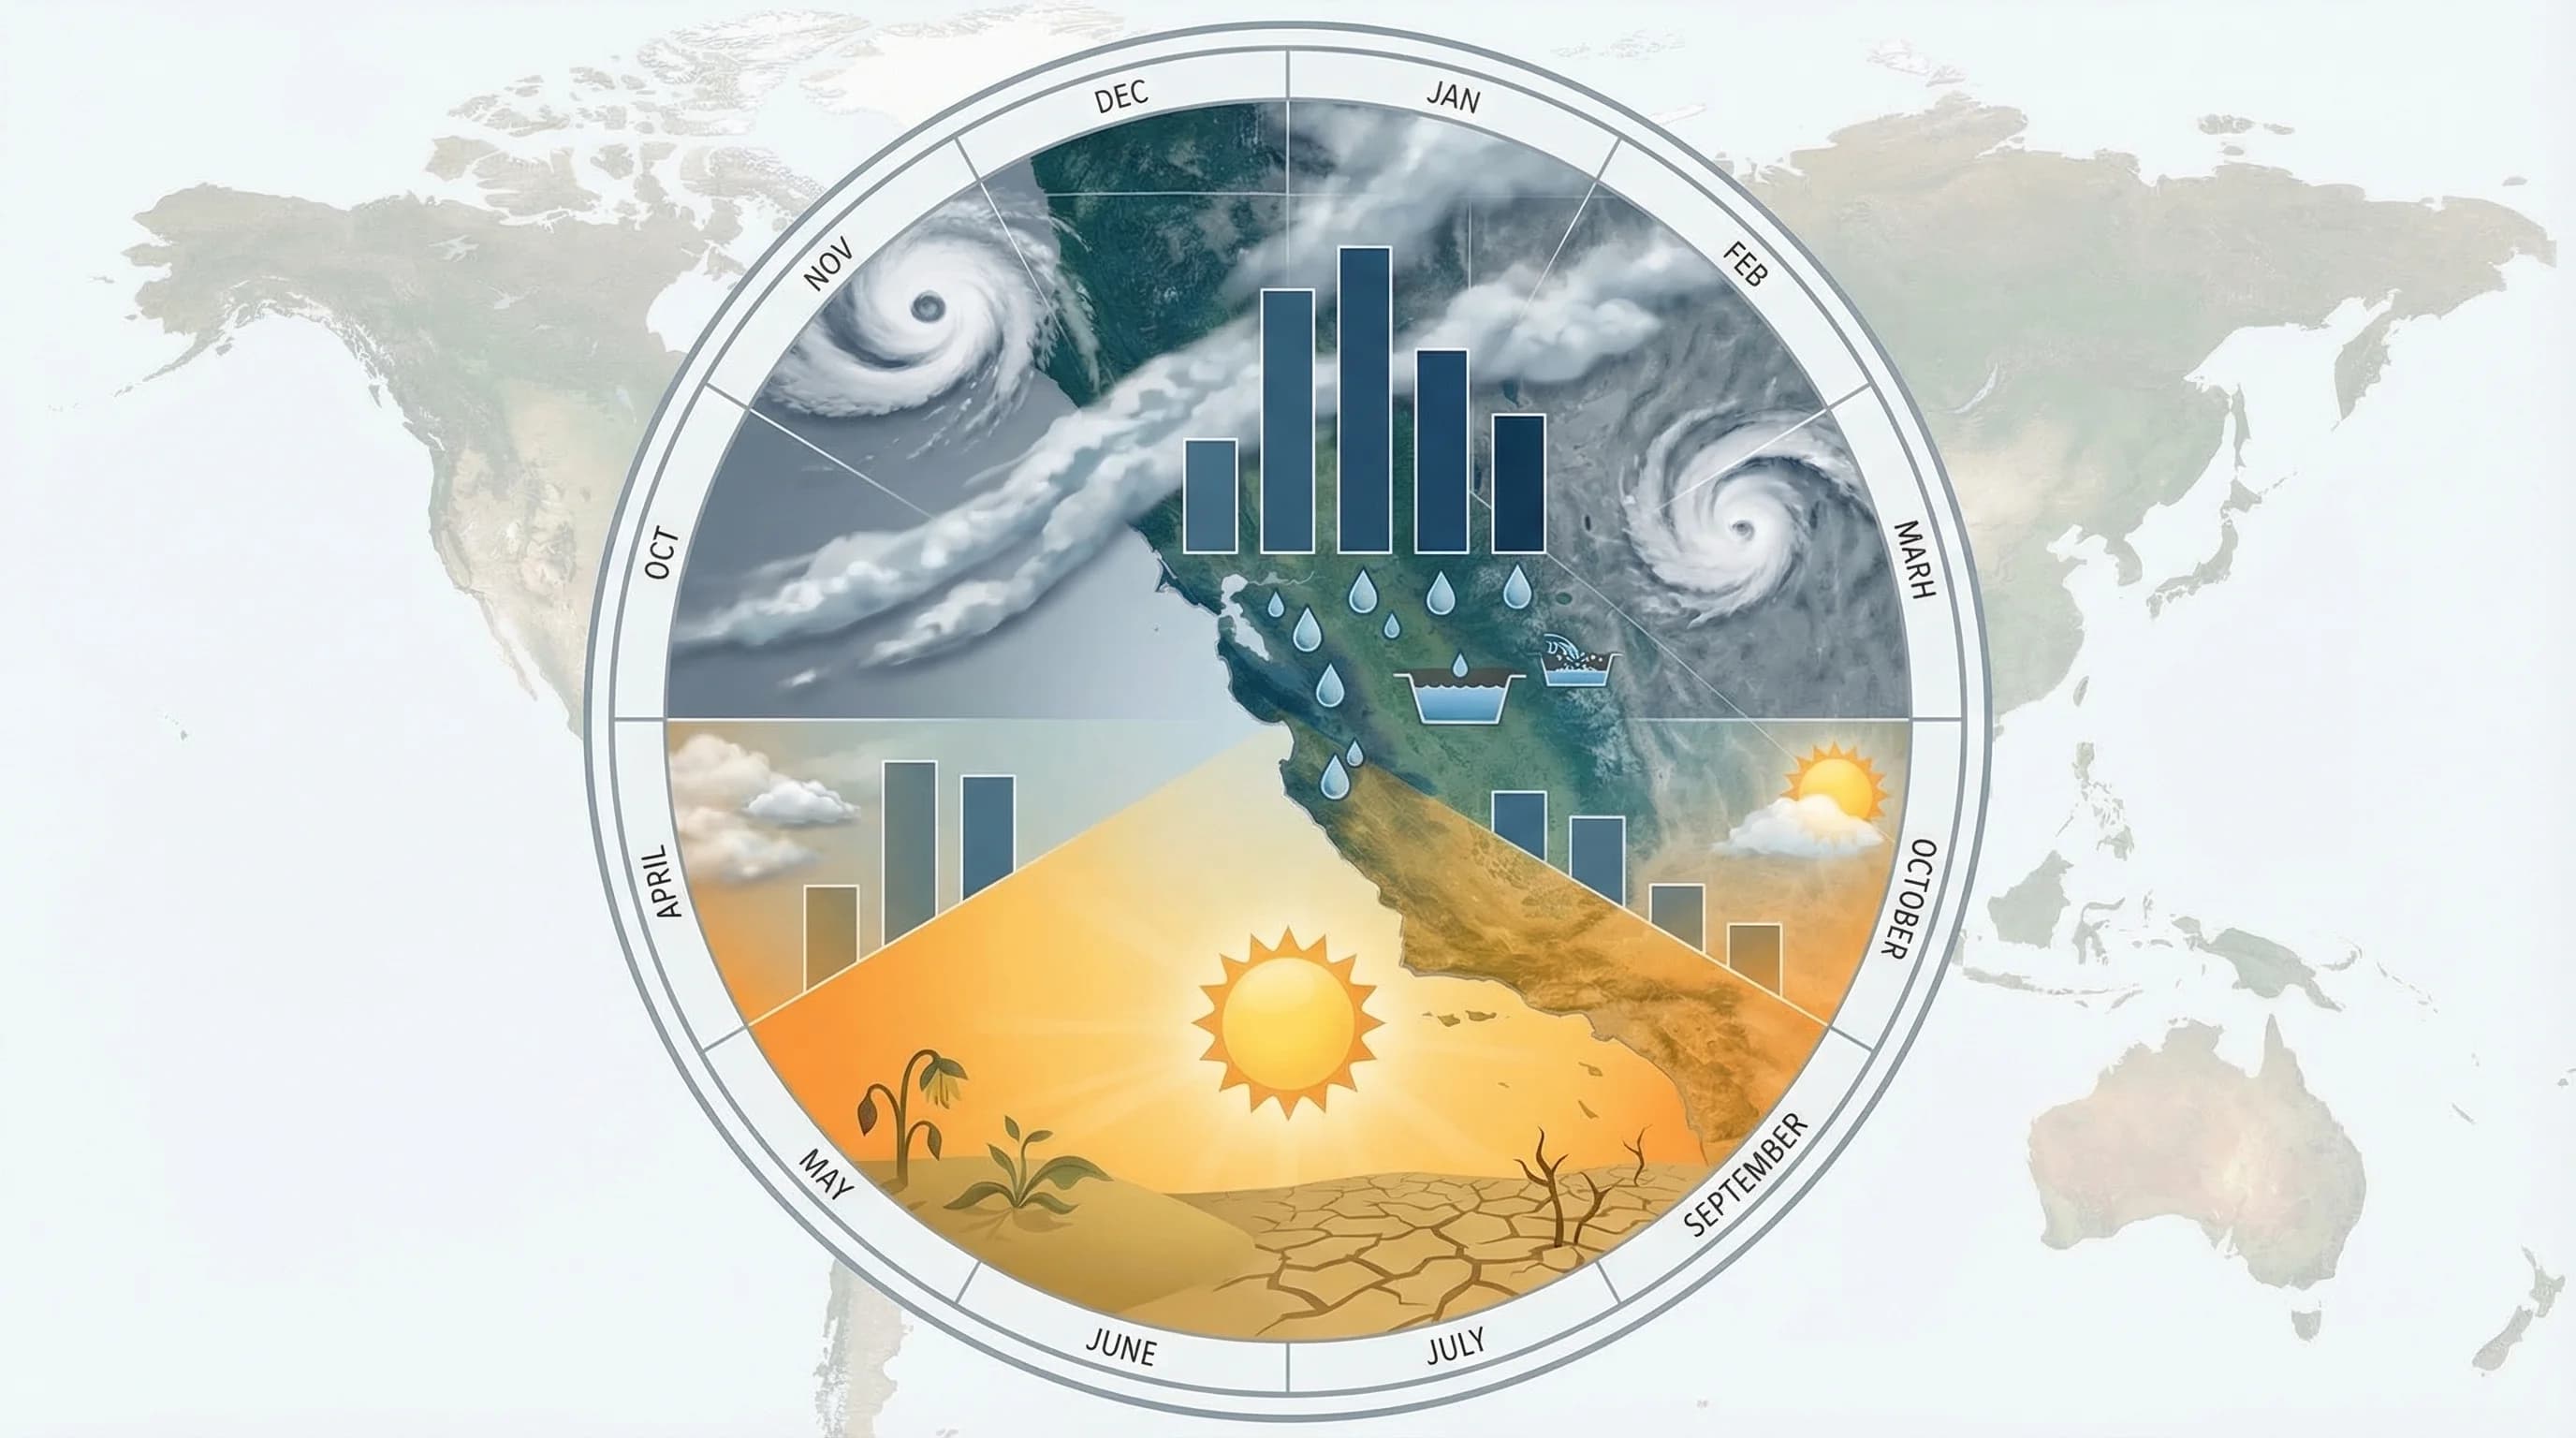
Bay Area rainy season runs from November through March, with December and January as the wettest months. June through September are virtually rainless.
5min read →
September and October are the Bay Area's warmest, sunniest months for coastal and wine country locations. The marine layer retreats as the North Pacific High weakens, delivering Indian summer conditions that July's fog-heavy coast never achieves.
5min read →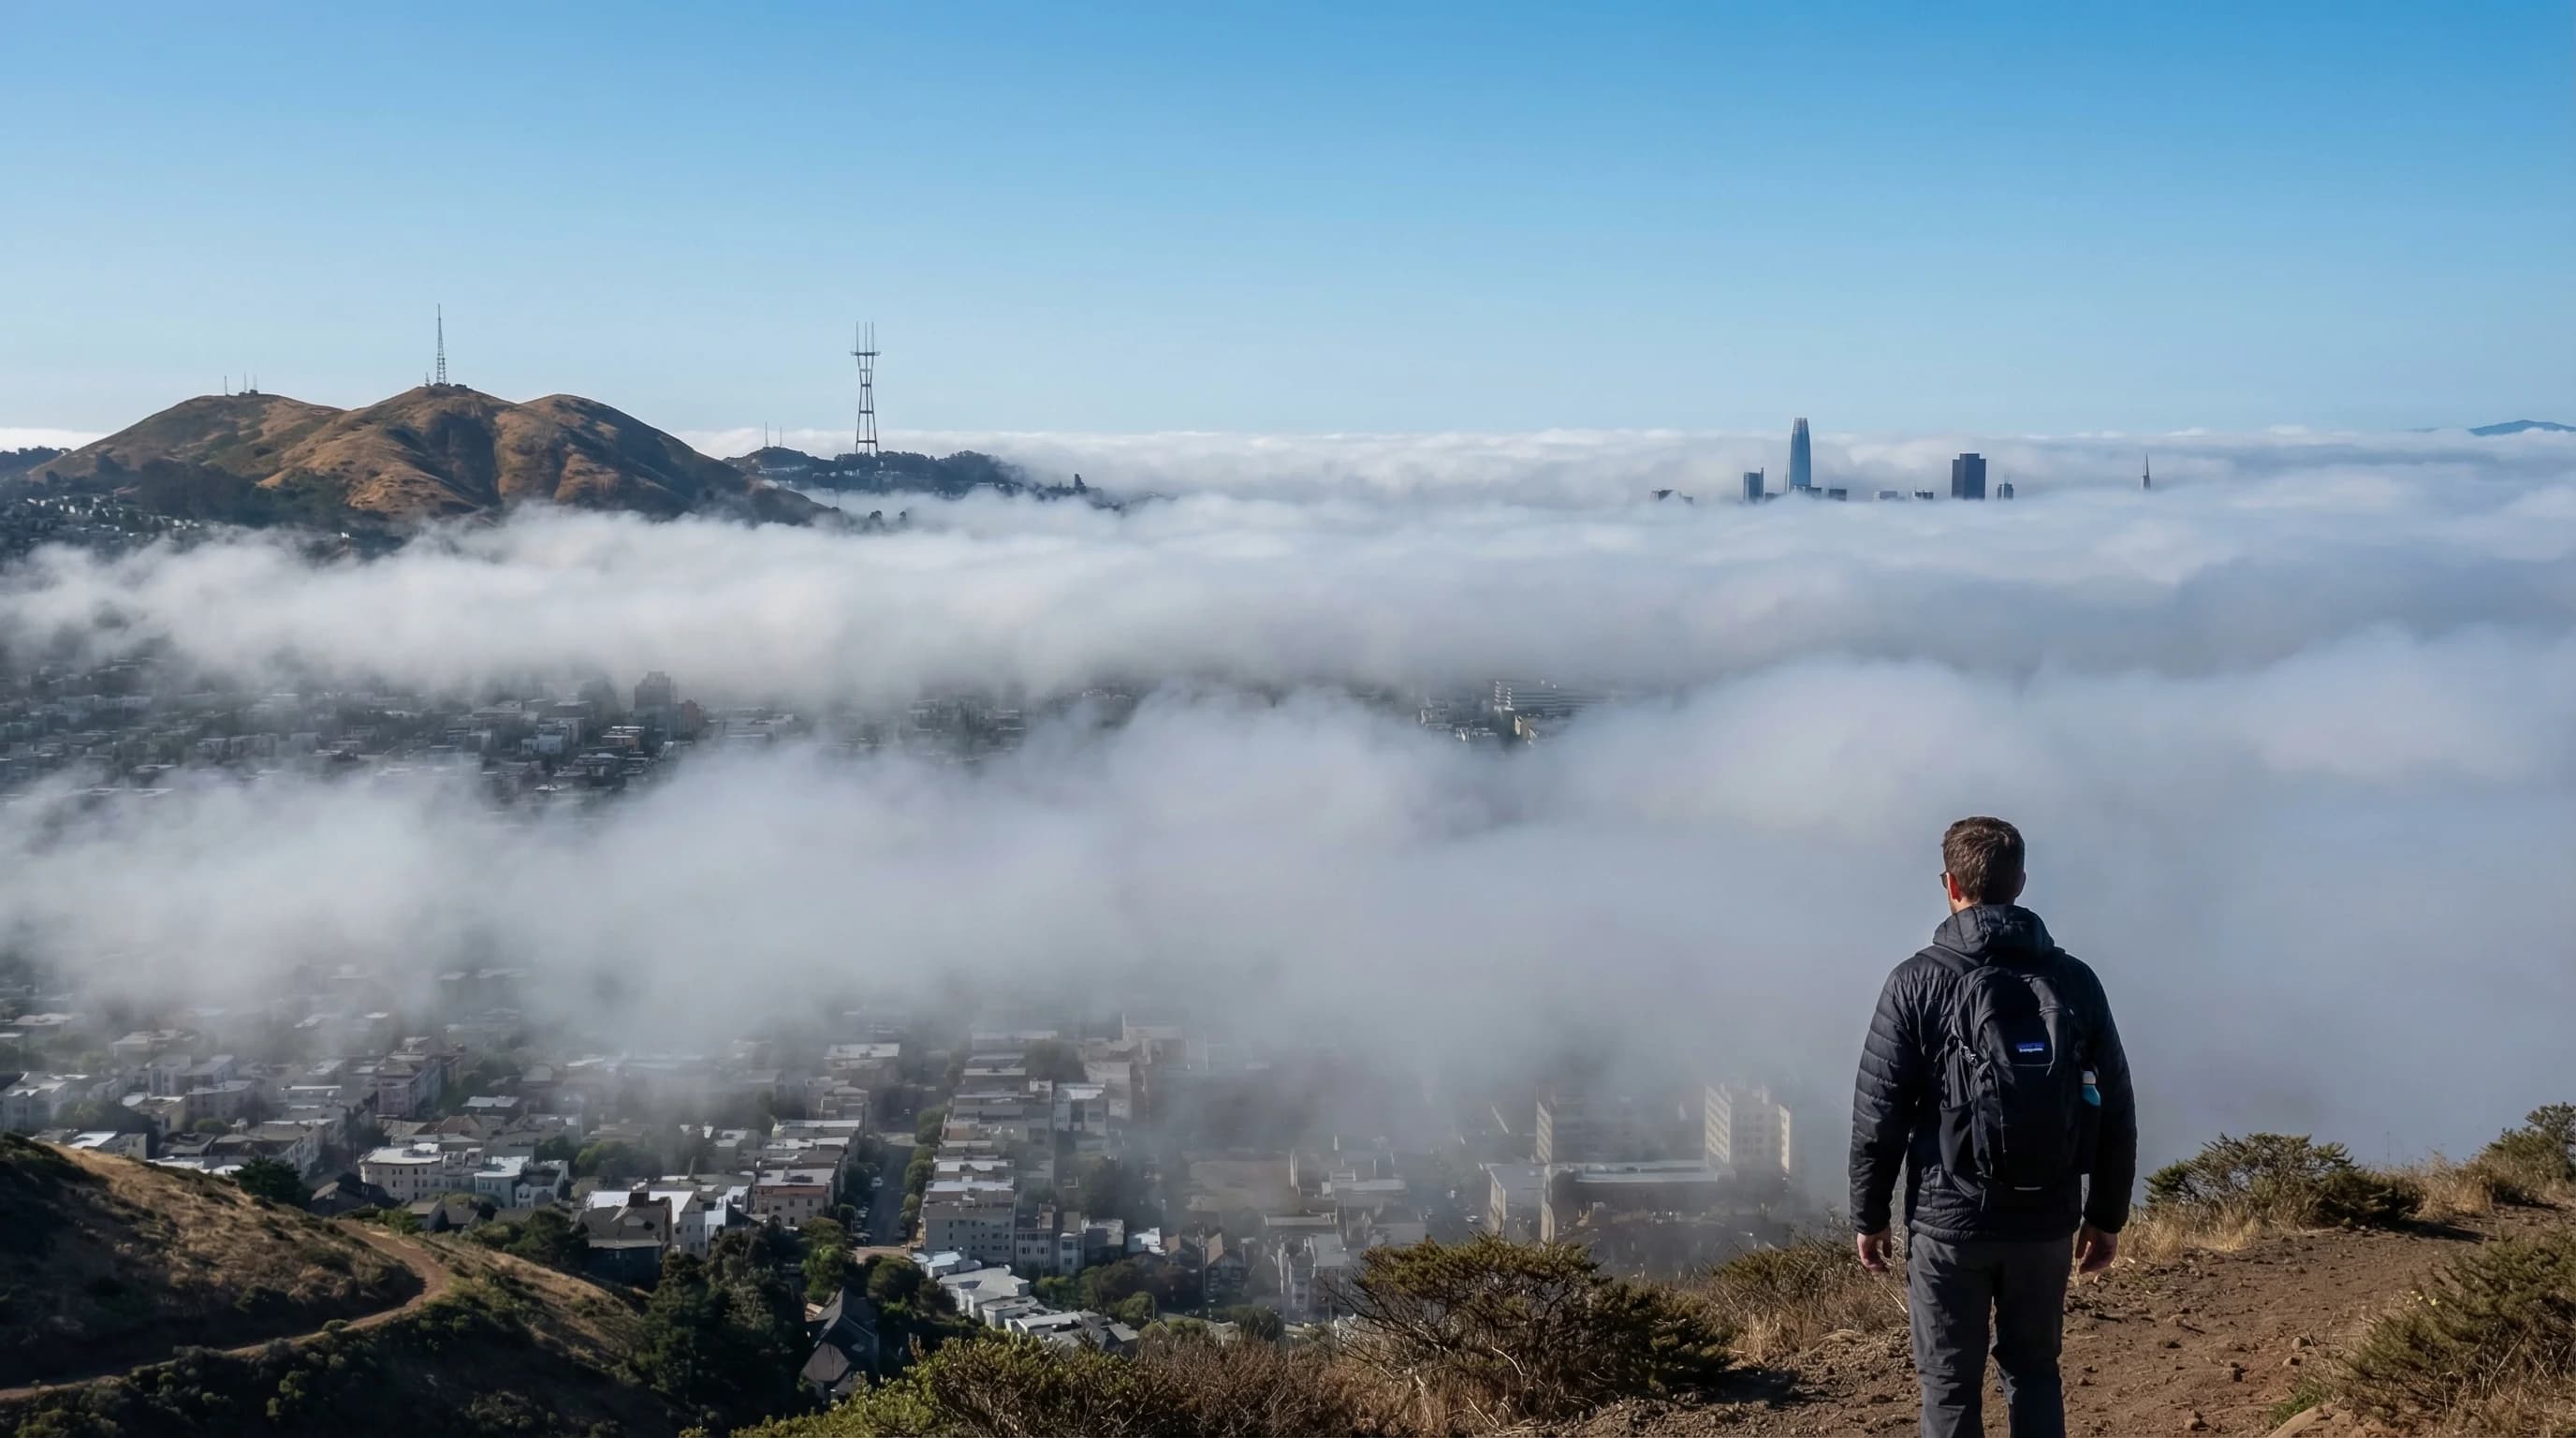
July is San Francisco's foggiest month, not June or August. The North Pacific High reaches peak strength, deepening the marine layer and making afternoon burn-off unreliable. Some July days see no sun at all, while September fog is brief and reliably clears by noon.
5min read →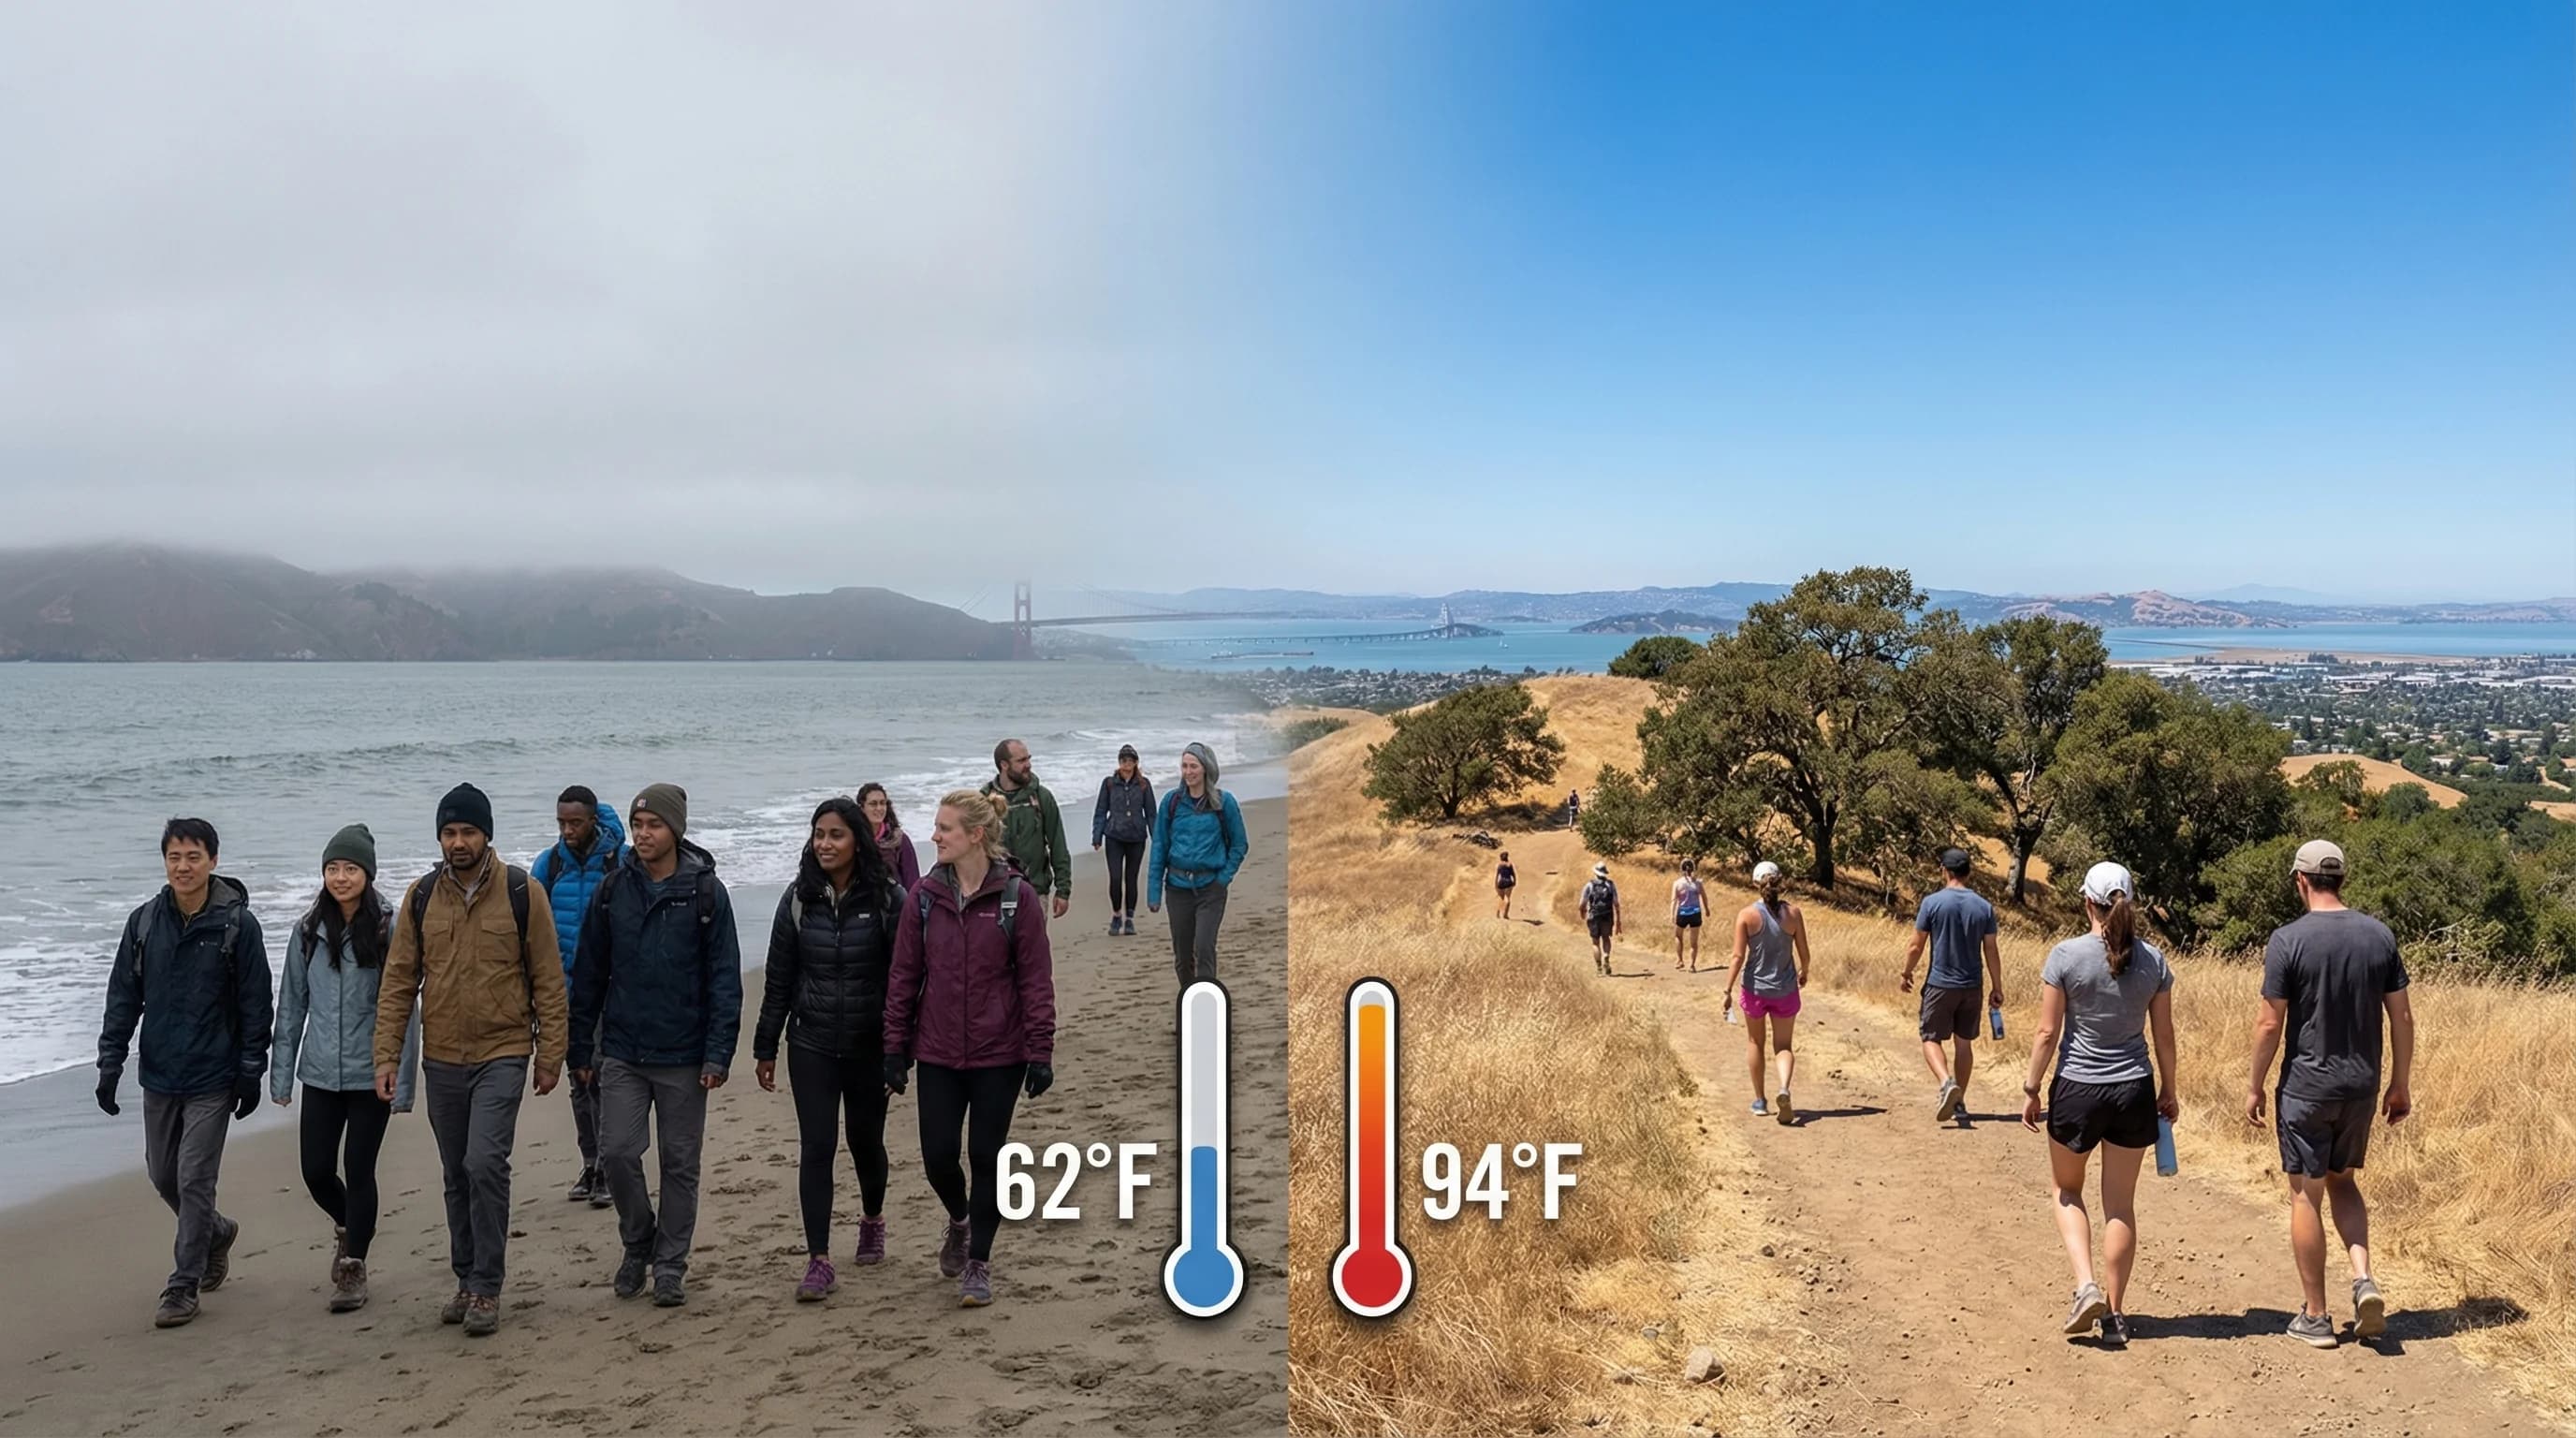
Oakland is 78°F and sunny while San Francisco sits at 62°F in fog. Walnut Creek hits 92°F. Livermore reaches 98°F. All four cities share the same metropolitan area, but geography determines which ones the marine layer reaches and how much cooling it delivers.
4min read →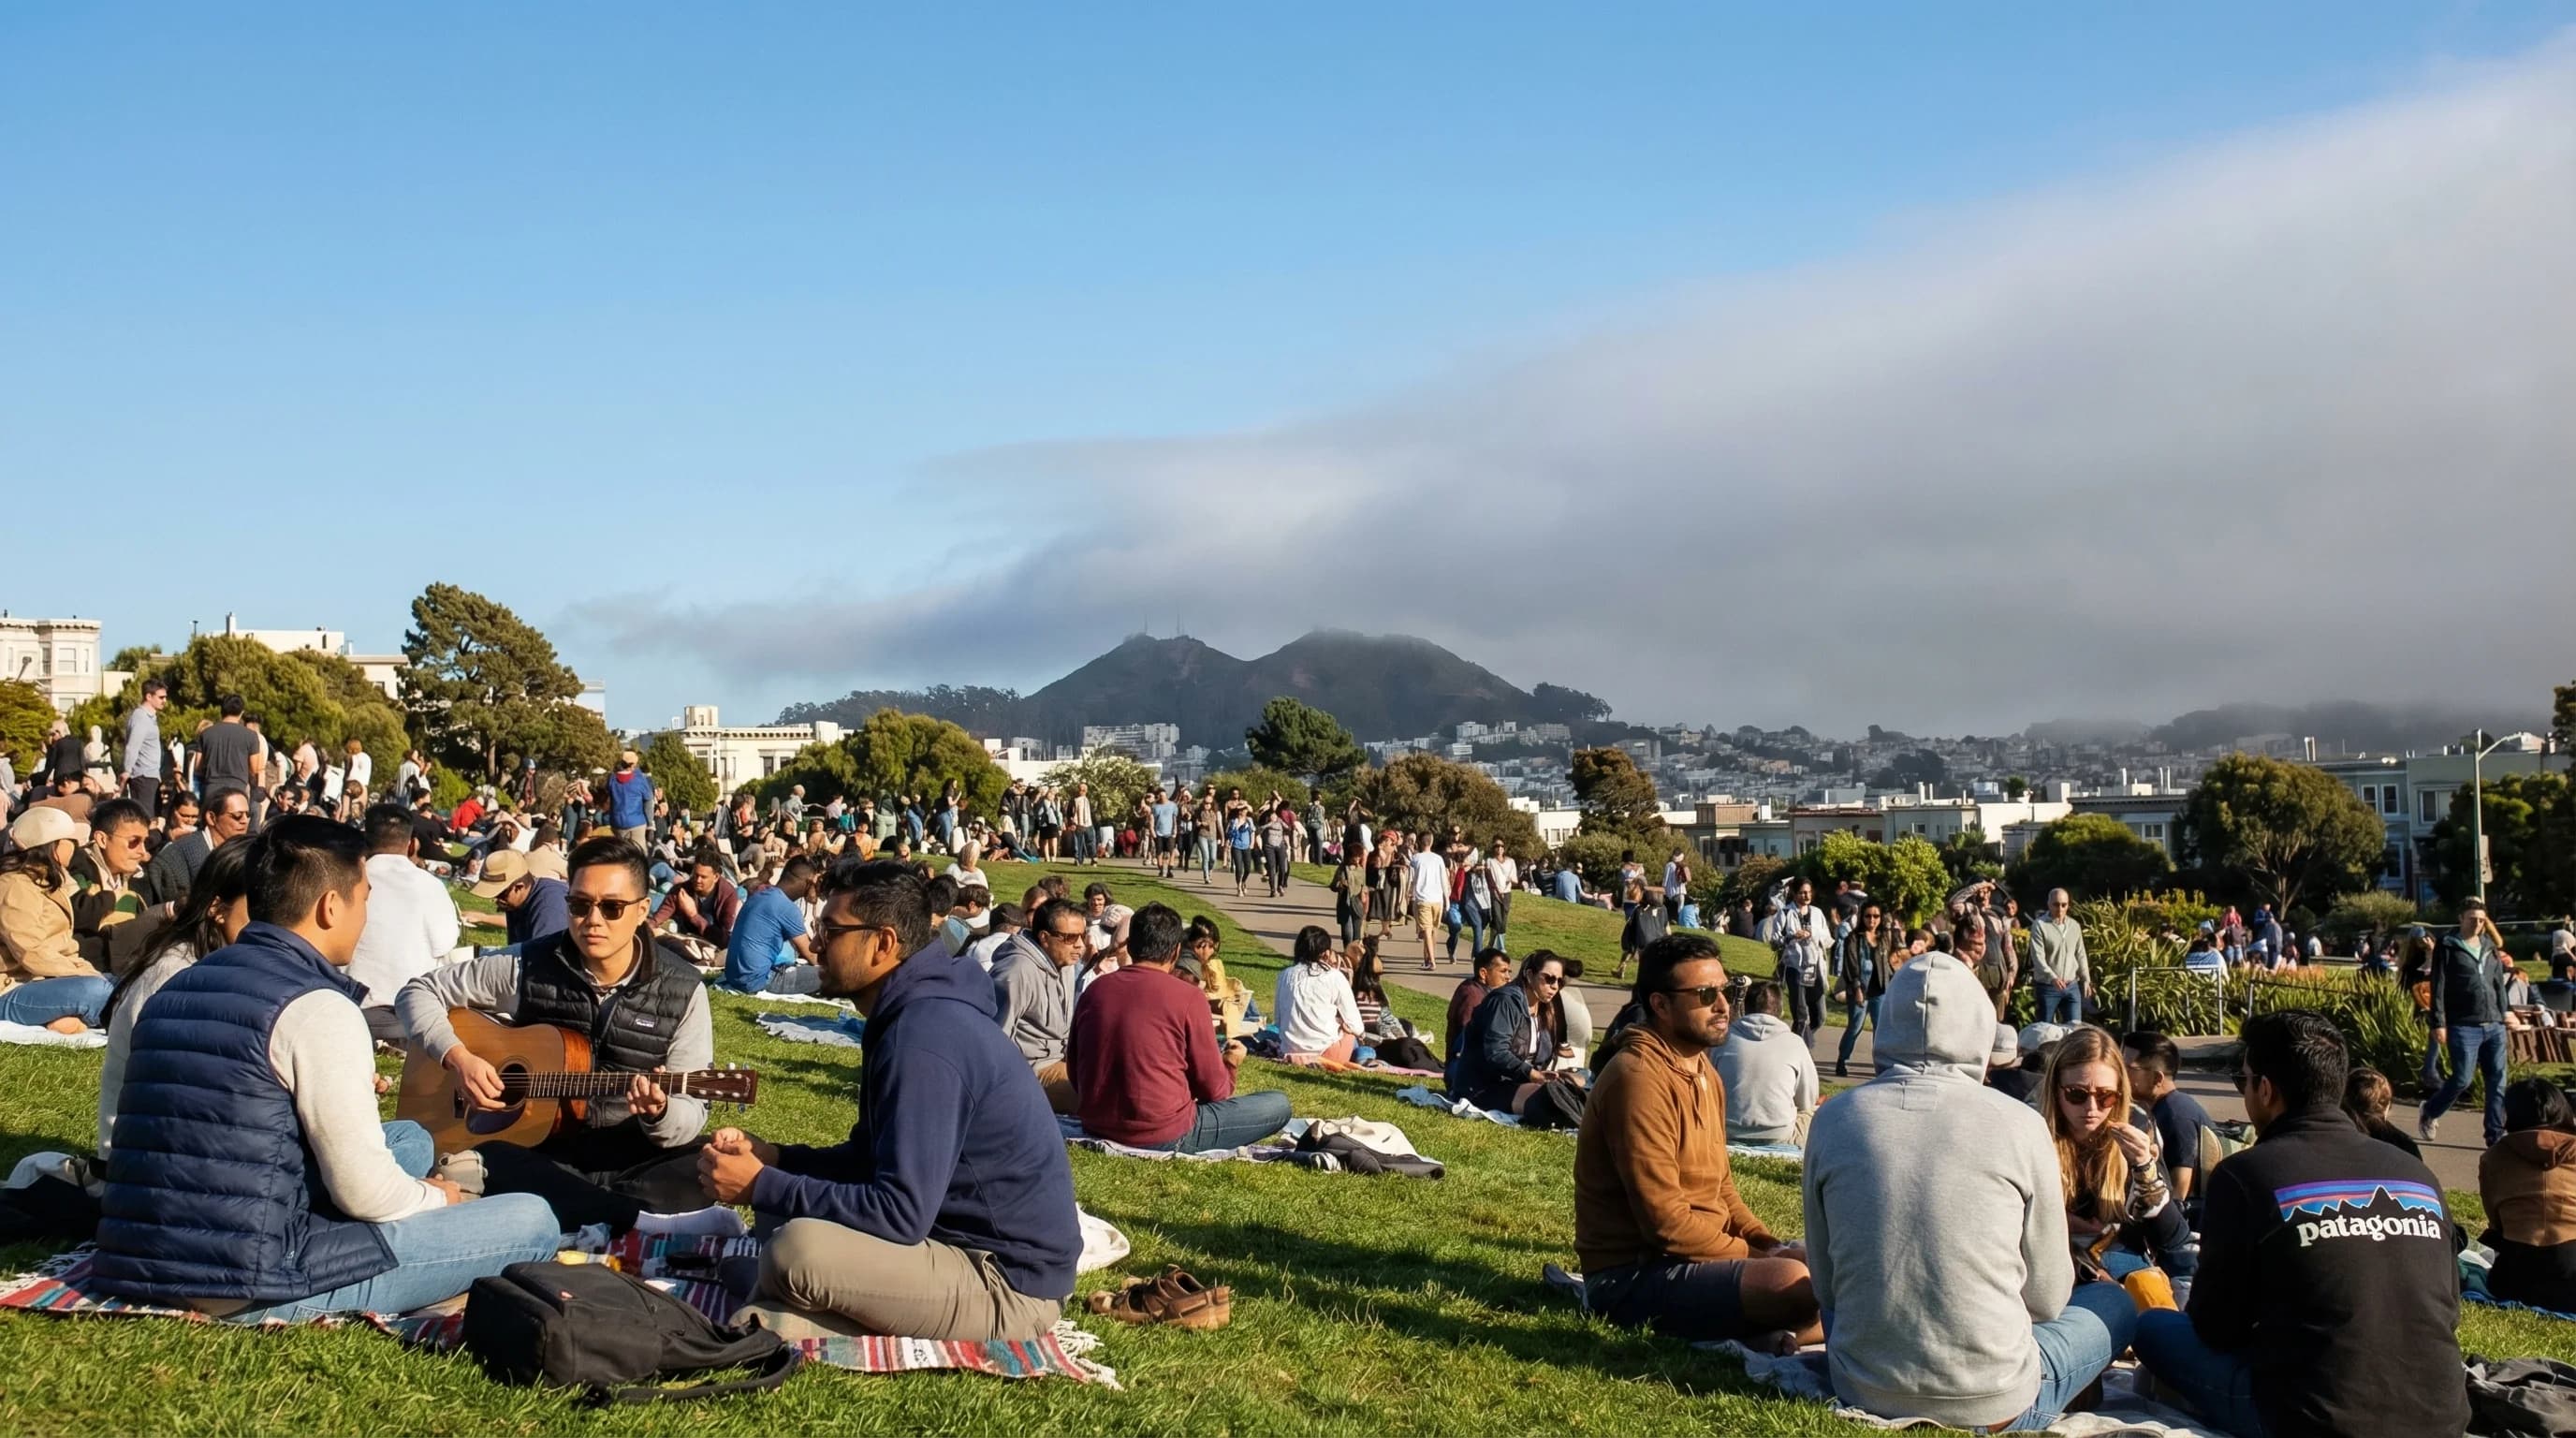
The Outer Sunset faces the Pacific directly. The Mission District sits behind the Twin Peaks ridge. On a typical foggy July afternoon, the Outer Sunset is at 53°F under dense fog while the Mission is sunny at 68°F, 2.5 miles apart, 15 degrees different.
5min read →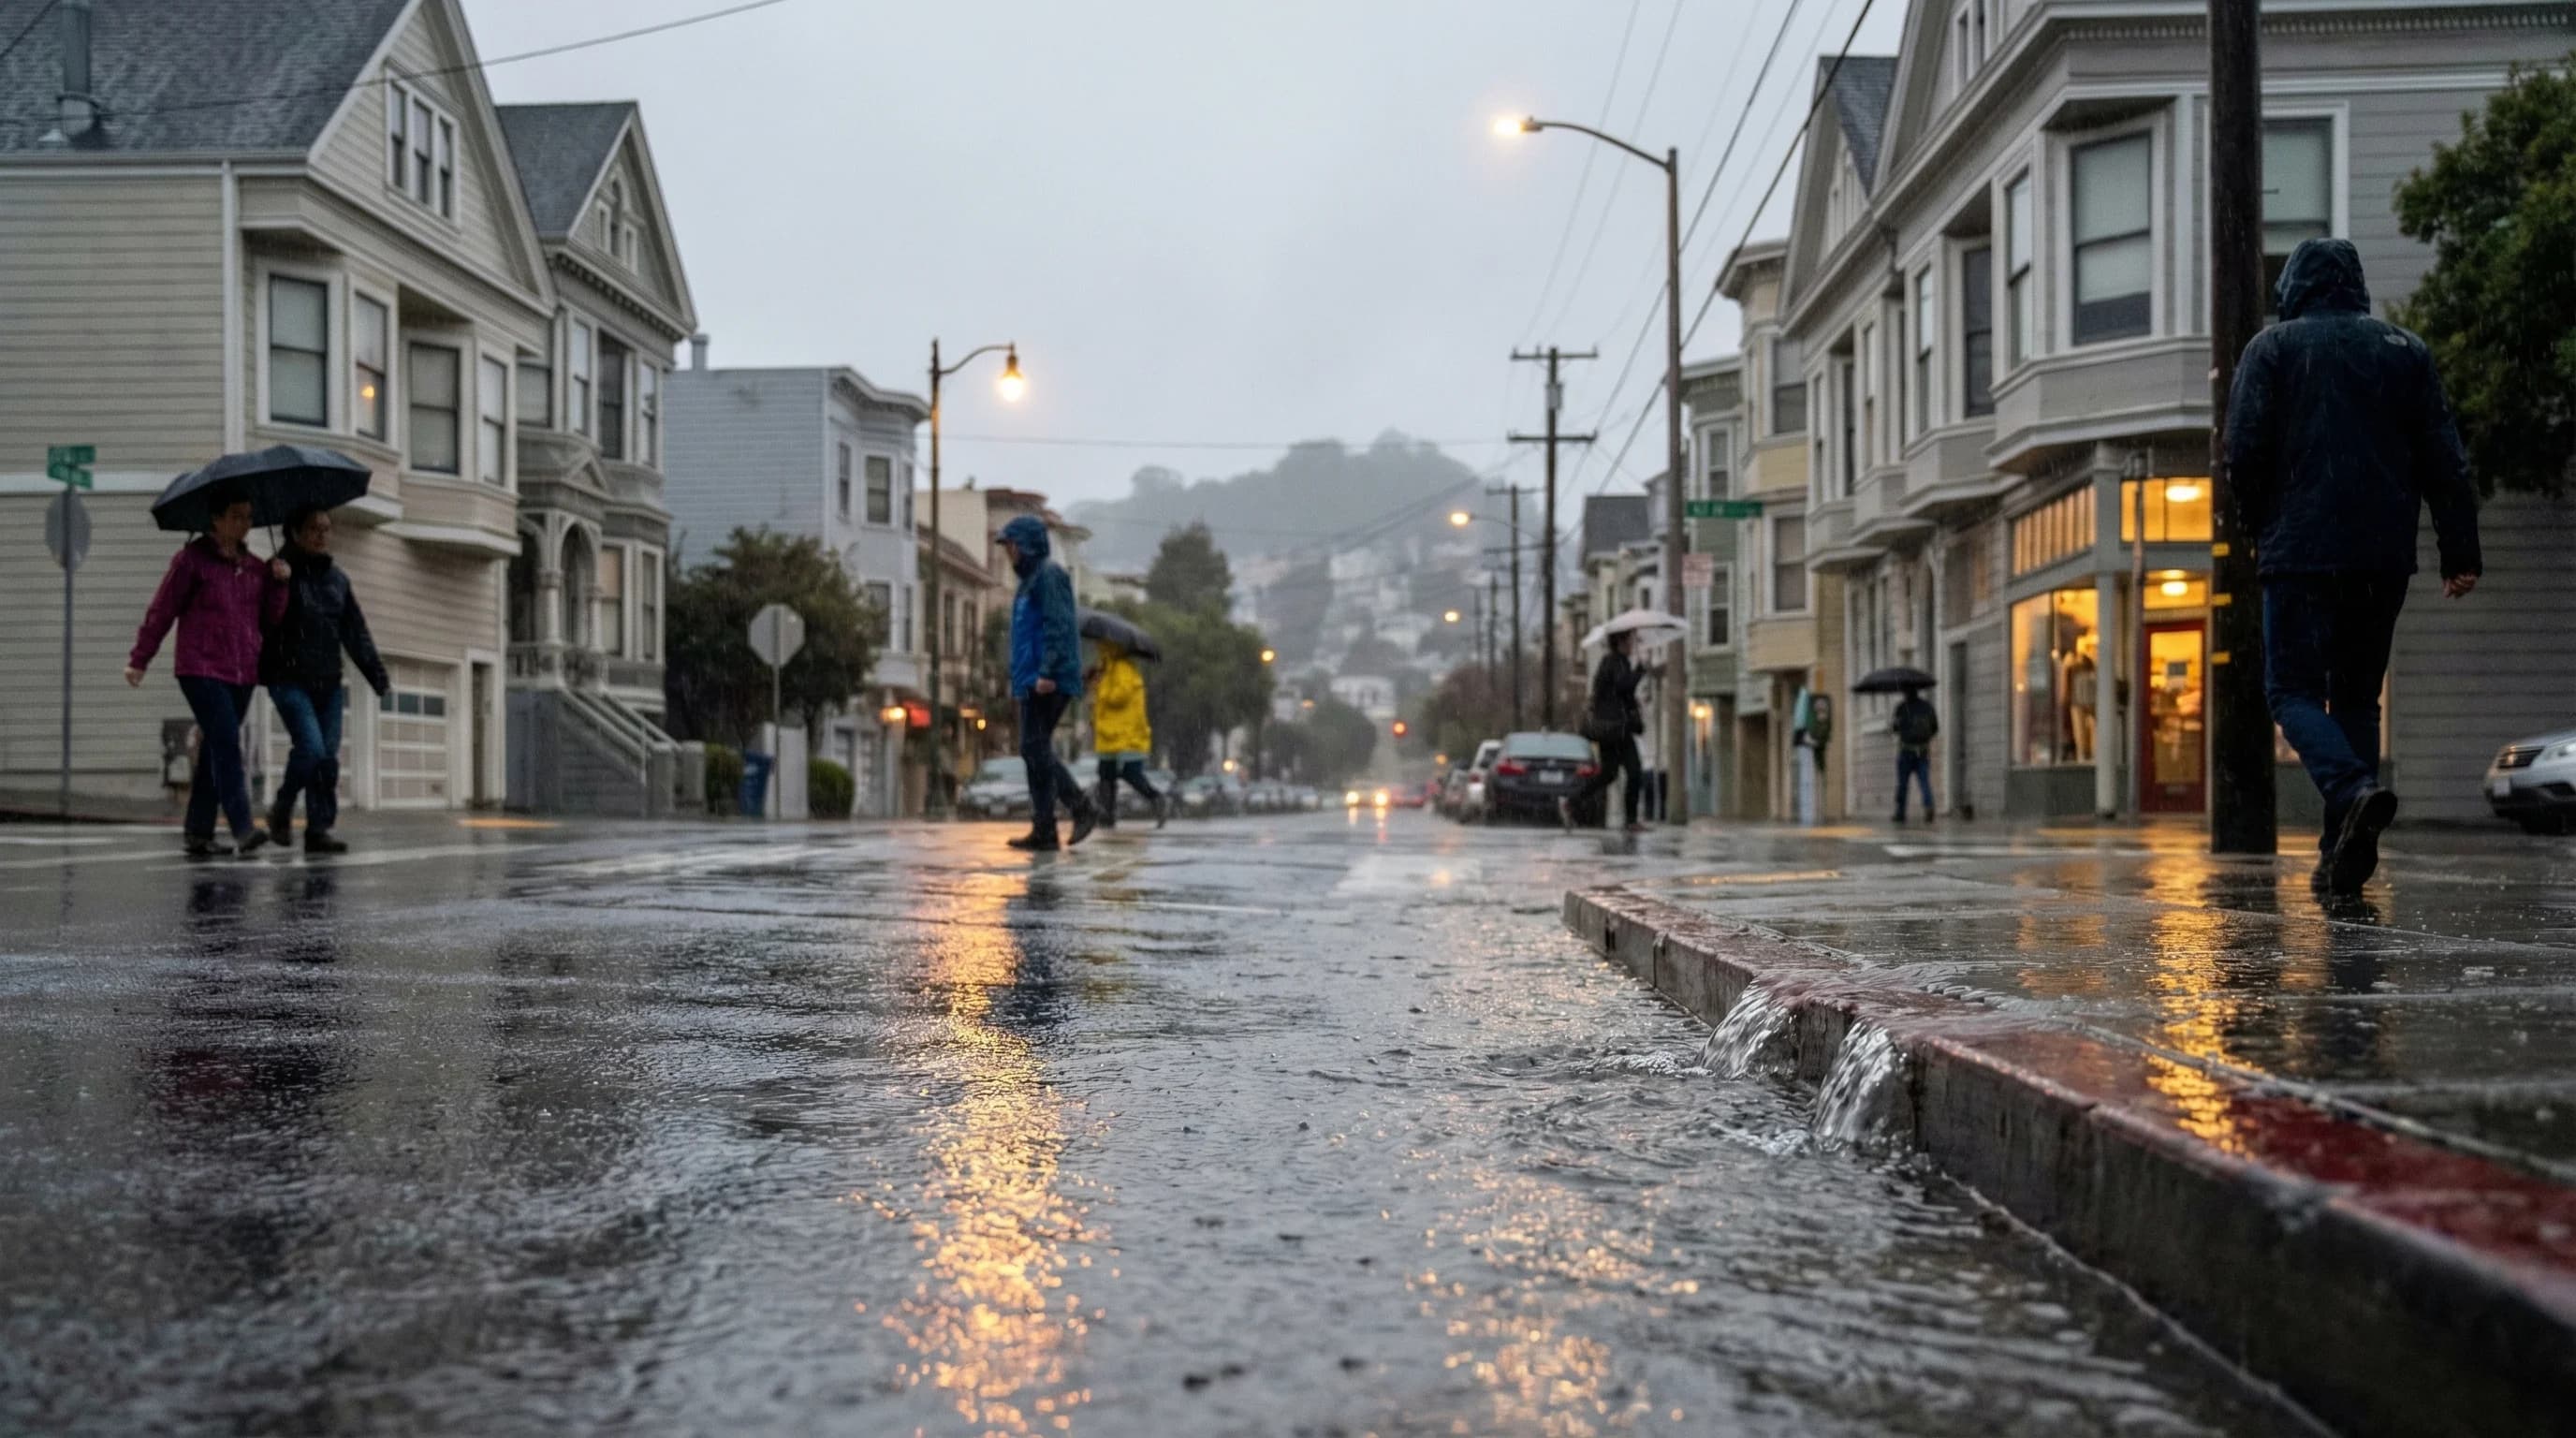
In San Francisco, December and January are nearly tied as the rainiest months at about 4.5 inches each. The Pacific storm track takes until December to fully position itself for Bay Area storms. In the Marin watershed, the same months can deliver 15-20 inches.
5min read →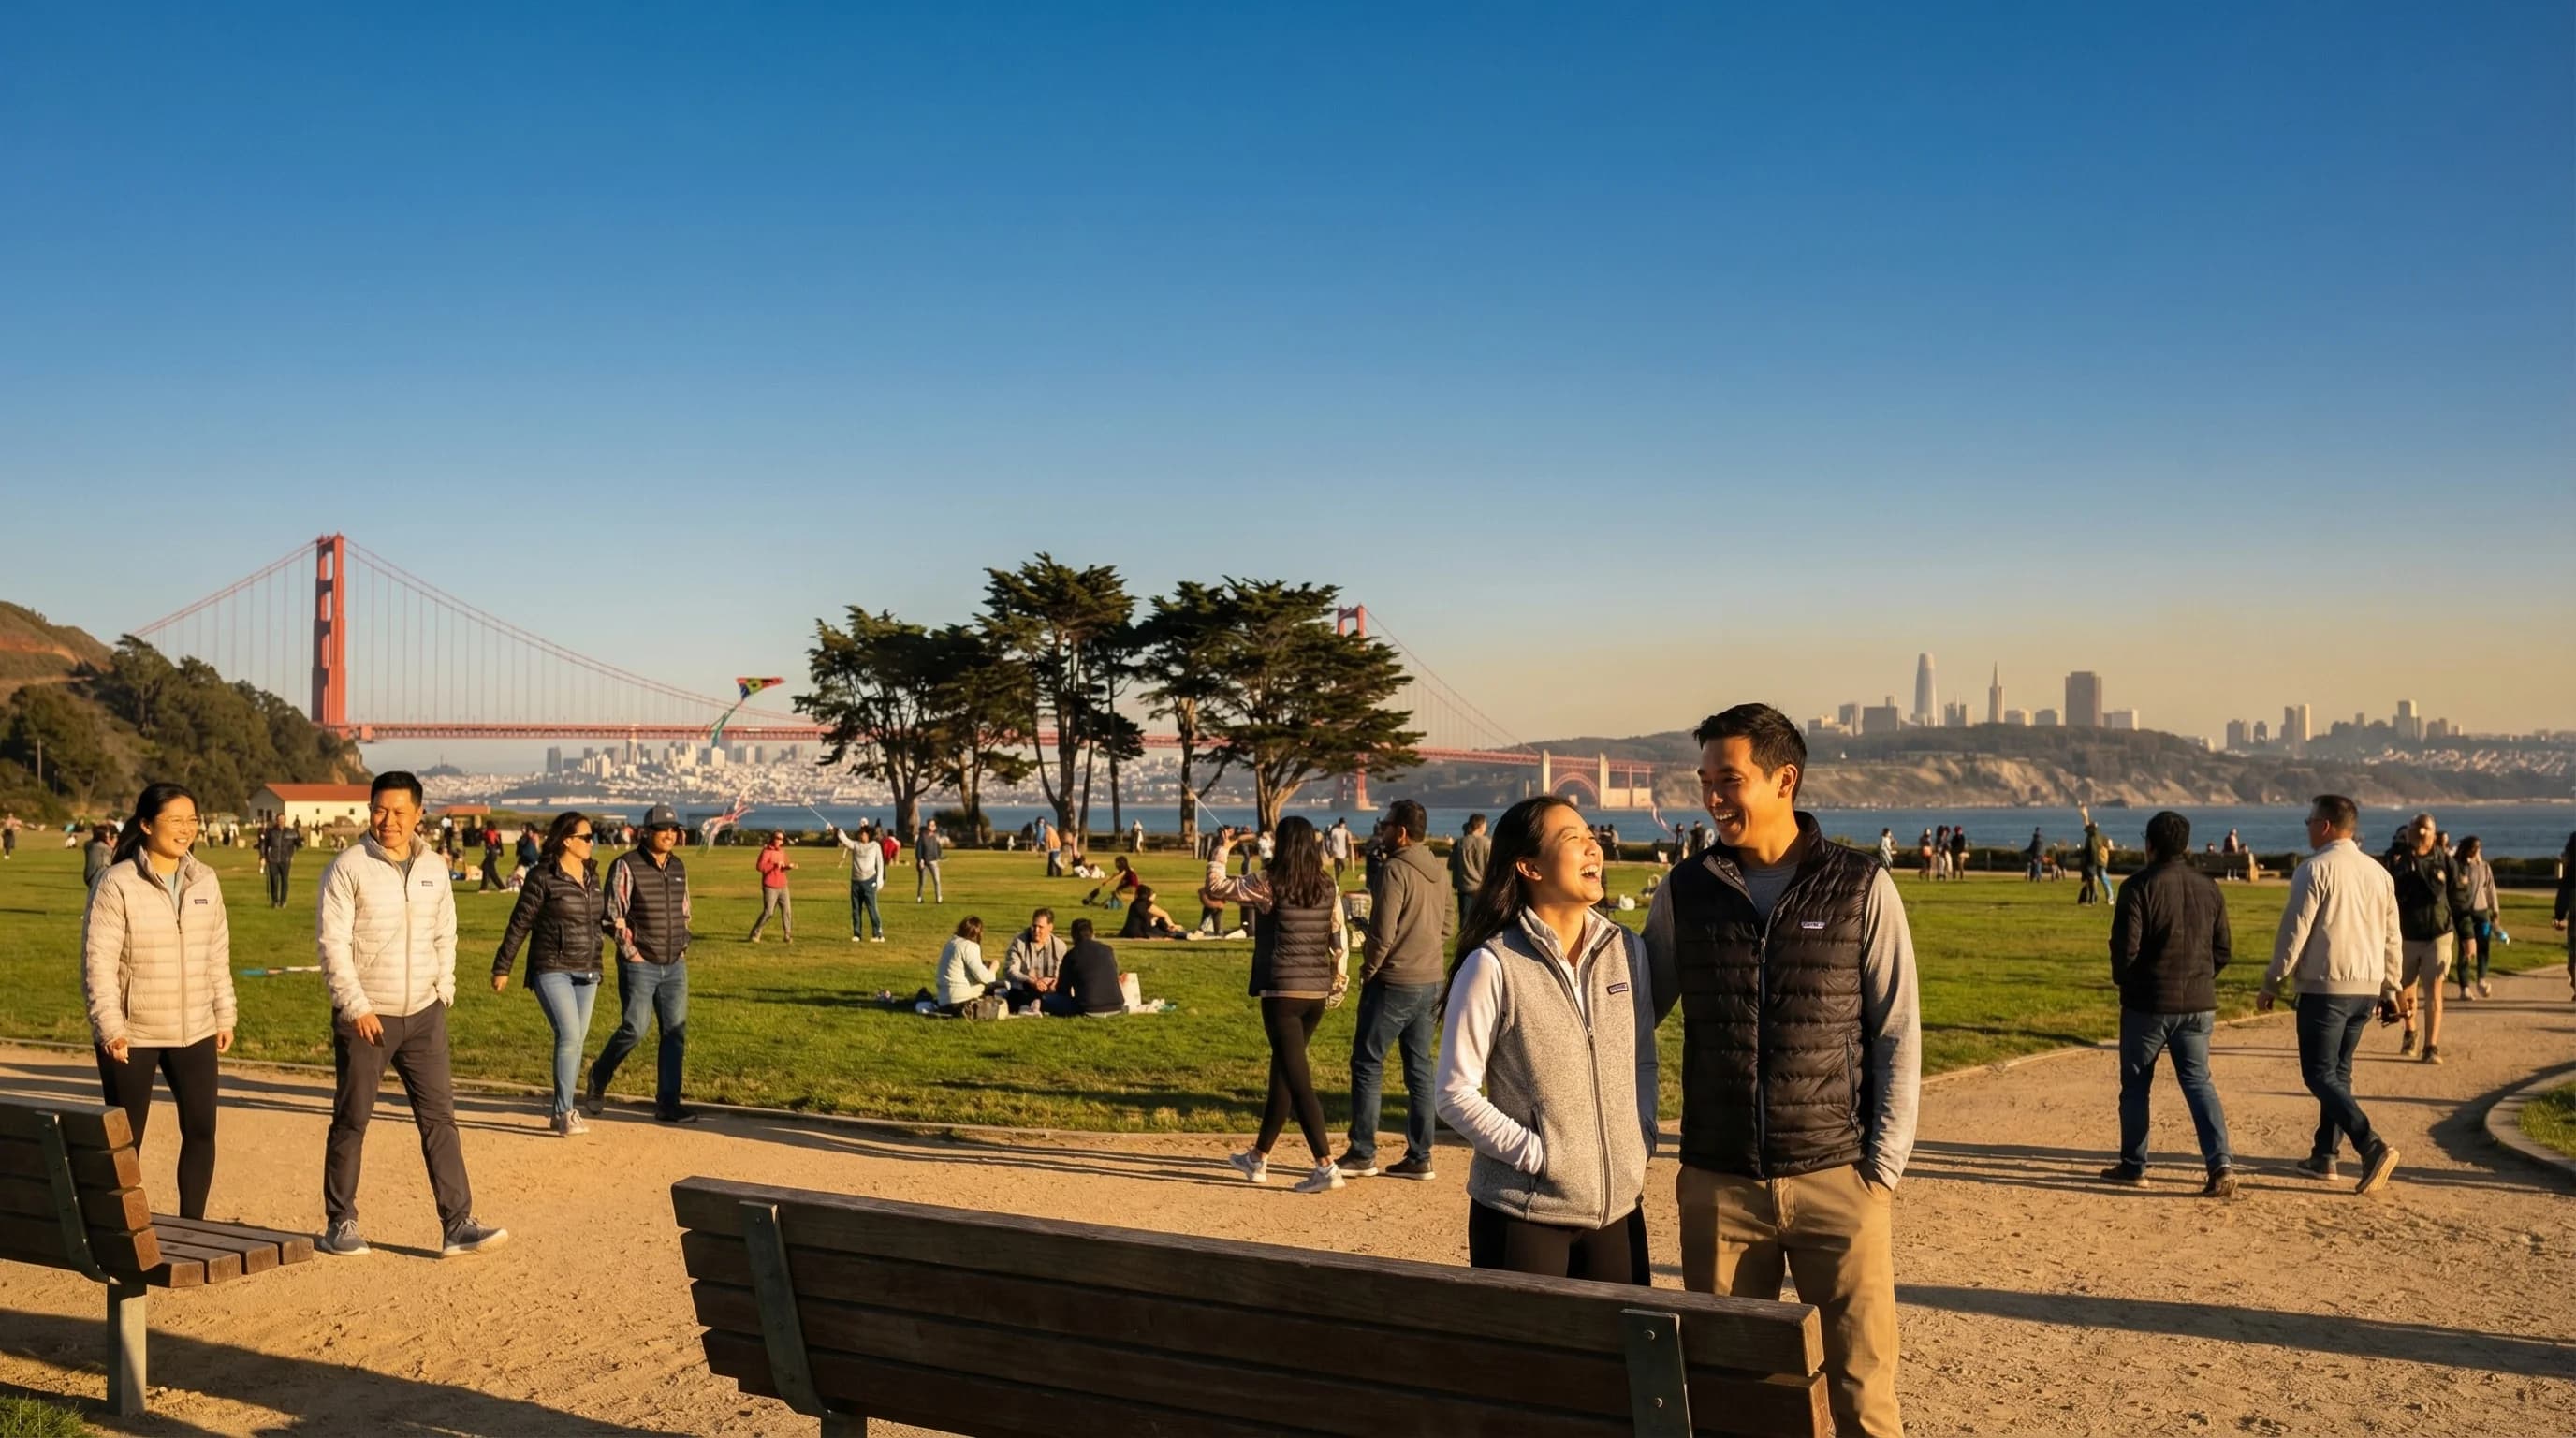
San Francisco's warmest month is September, not July. The inland East Bay peaks in July or August. The same metropolitan area has two different warmest months, separated by 20-50 miles, driven by the marine layer's retreat in fall.
4min read →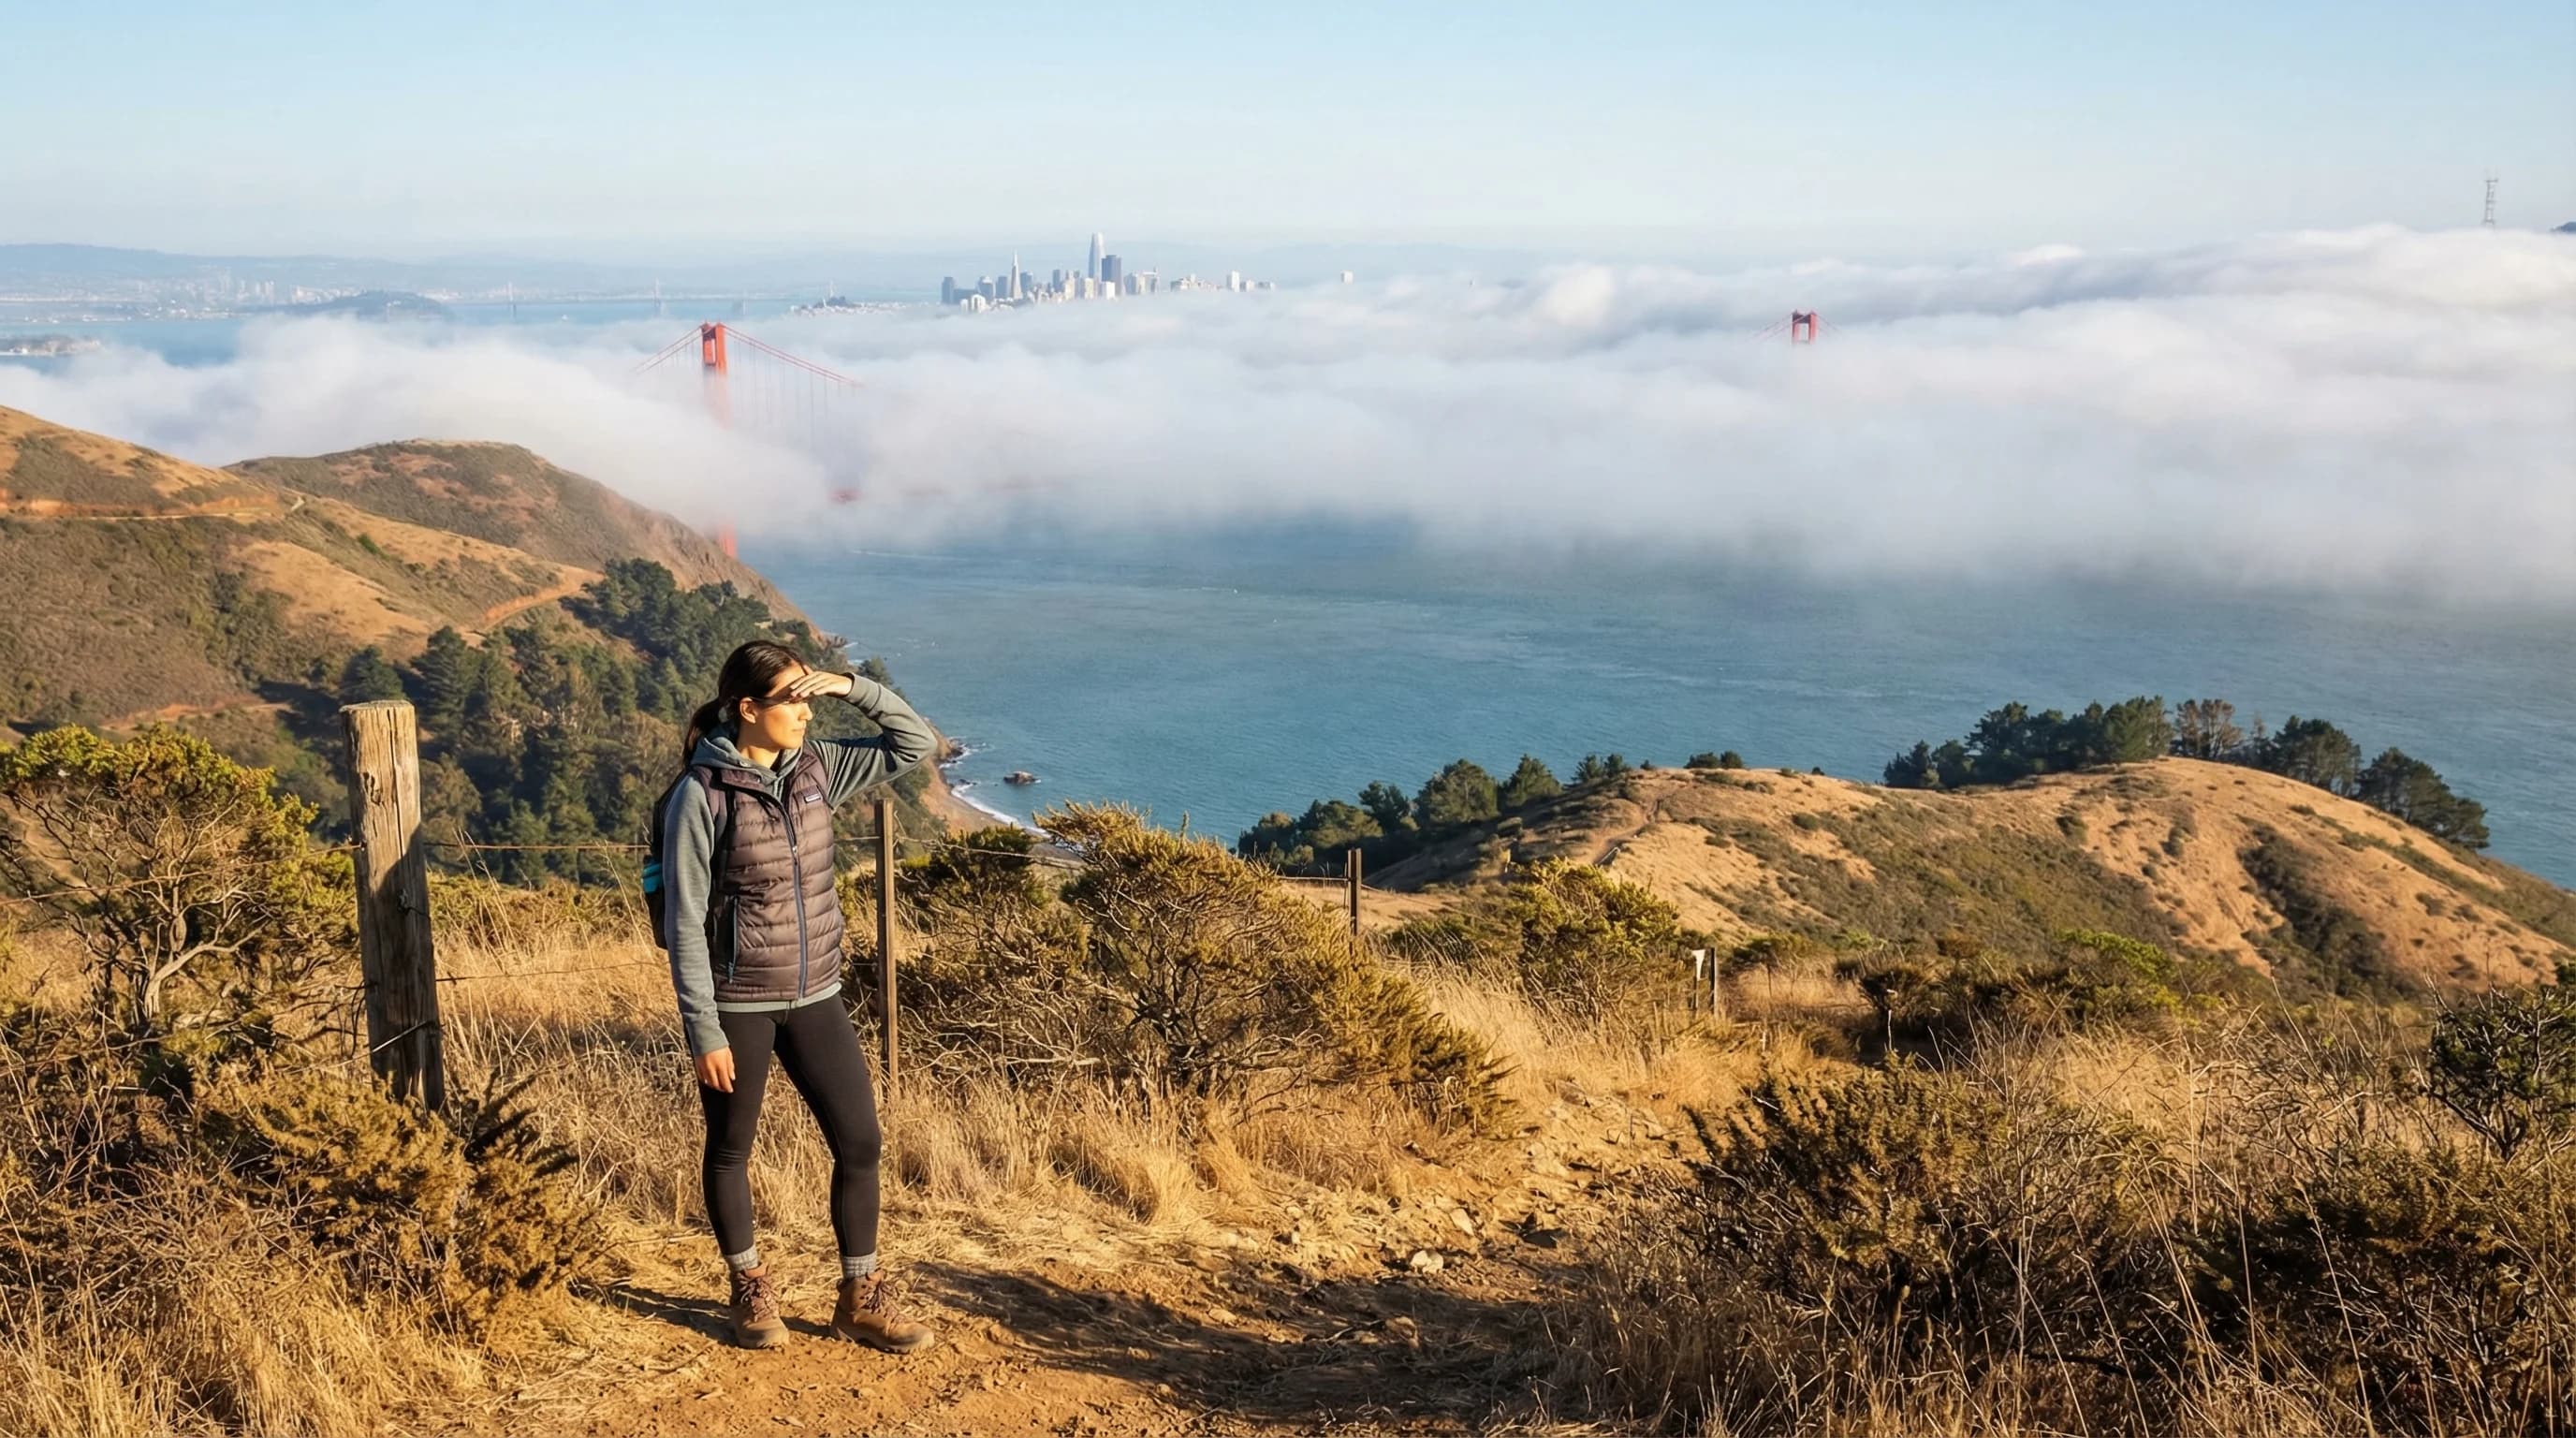
San Francisco at 58°F under fog, Walnut Creek at 95°F in sunshine, a 37-degree difference across 25 miles. The "20 degrees colder" claim is local shorthand, but on strong marine push days, the gap far exceeds 20 degrees. Understanding when the gradient is largest reveals how the Bay Area's marine layer works.
5min read →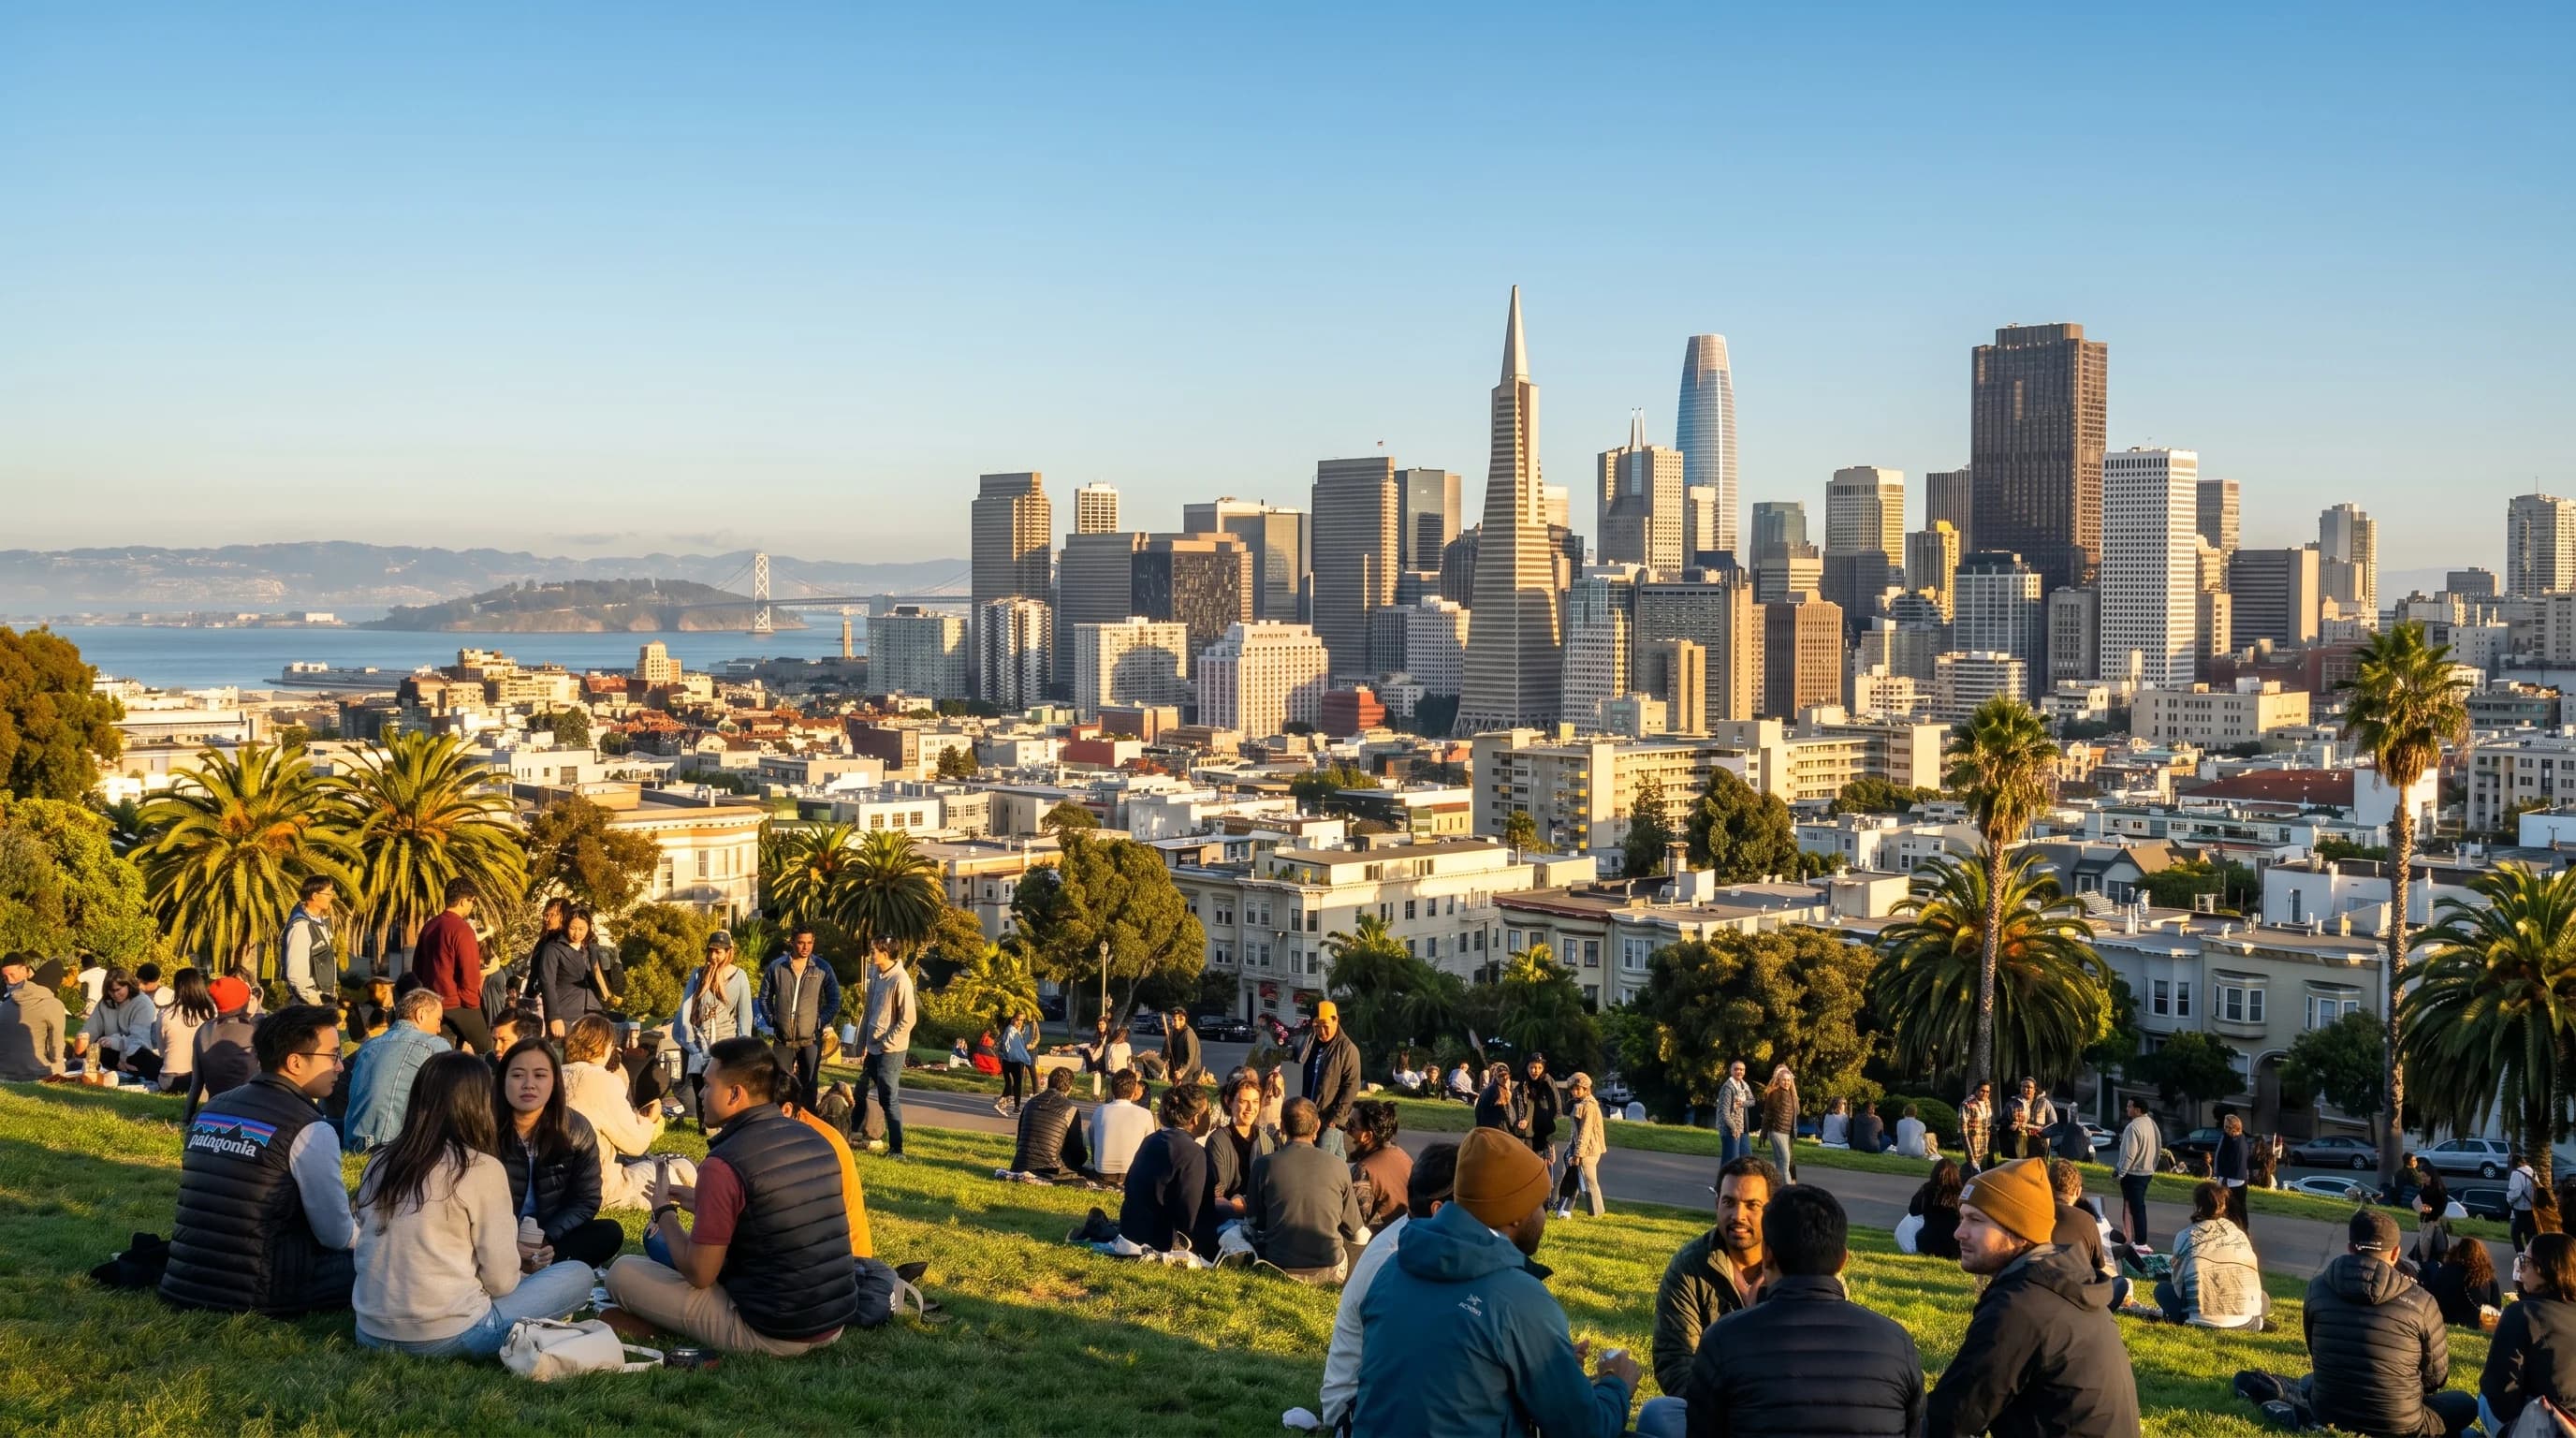
San Francisco's warmest months are September and October, not July and August. This month-by-month guide covers temperatures, fog, rain, and what to actually expect.
7min read →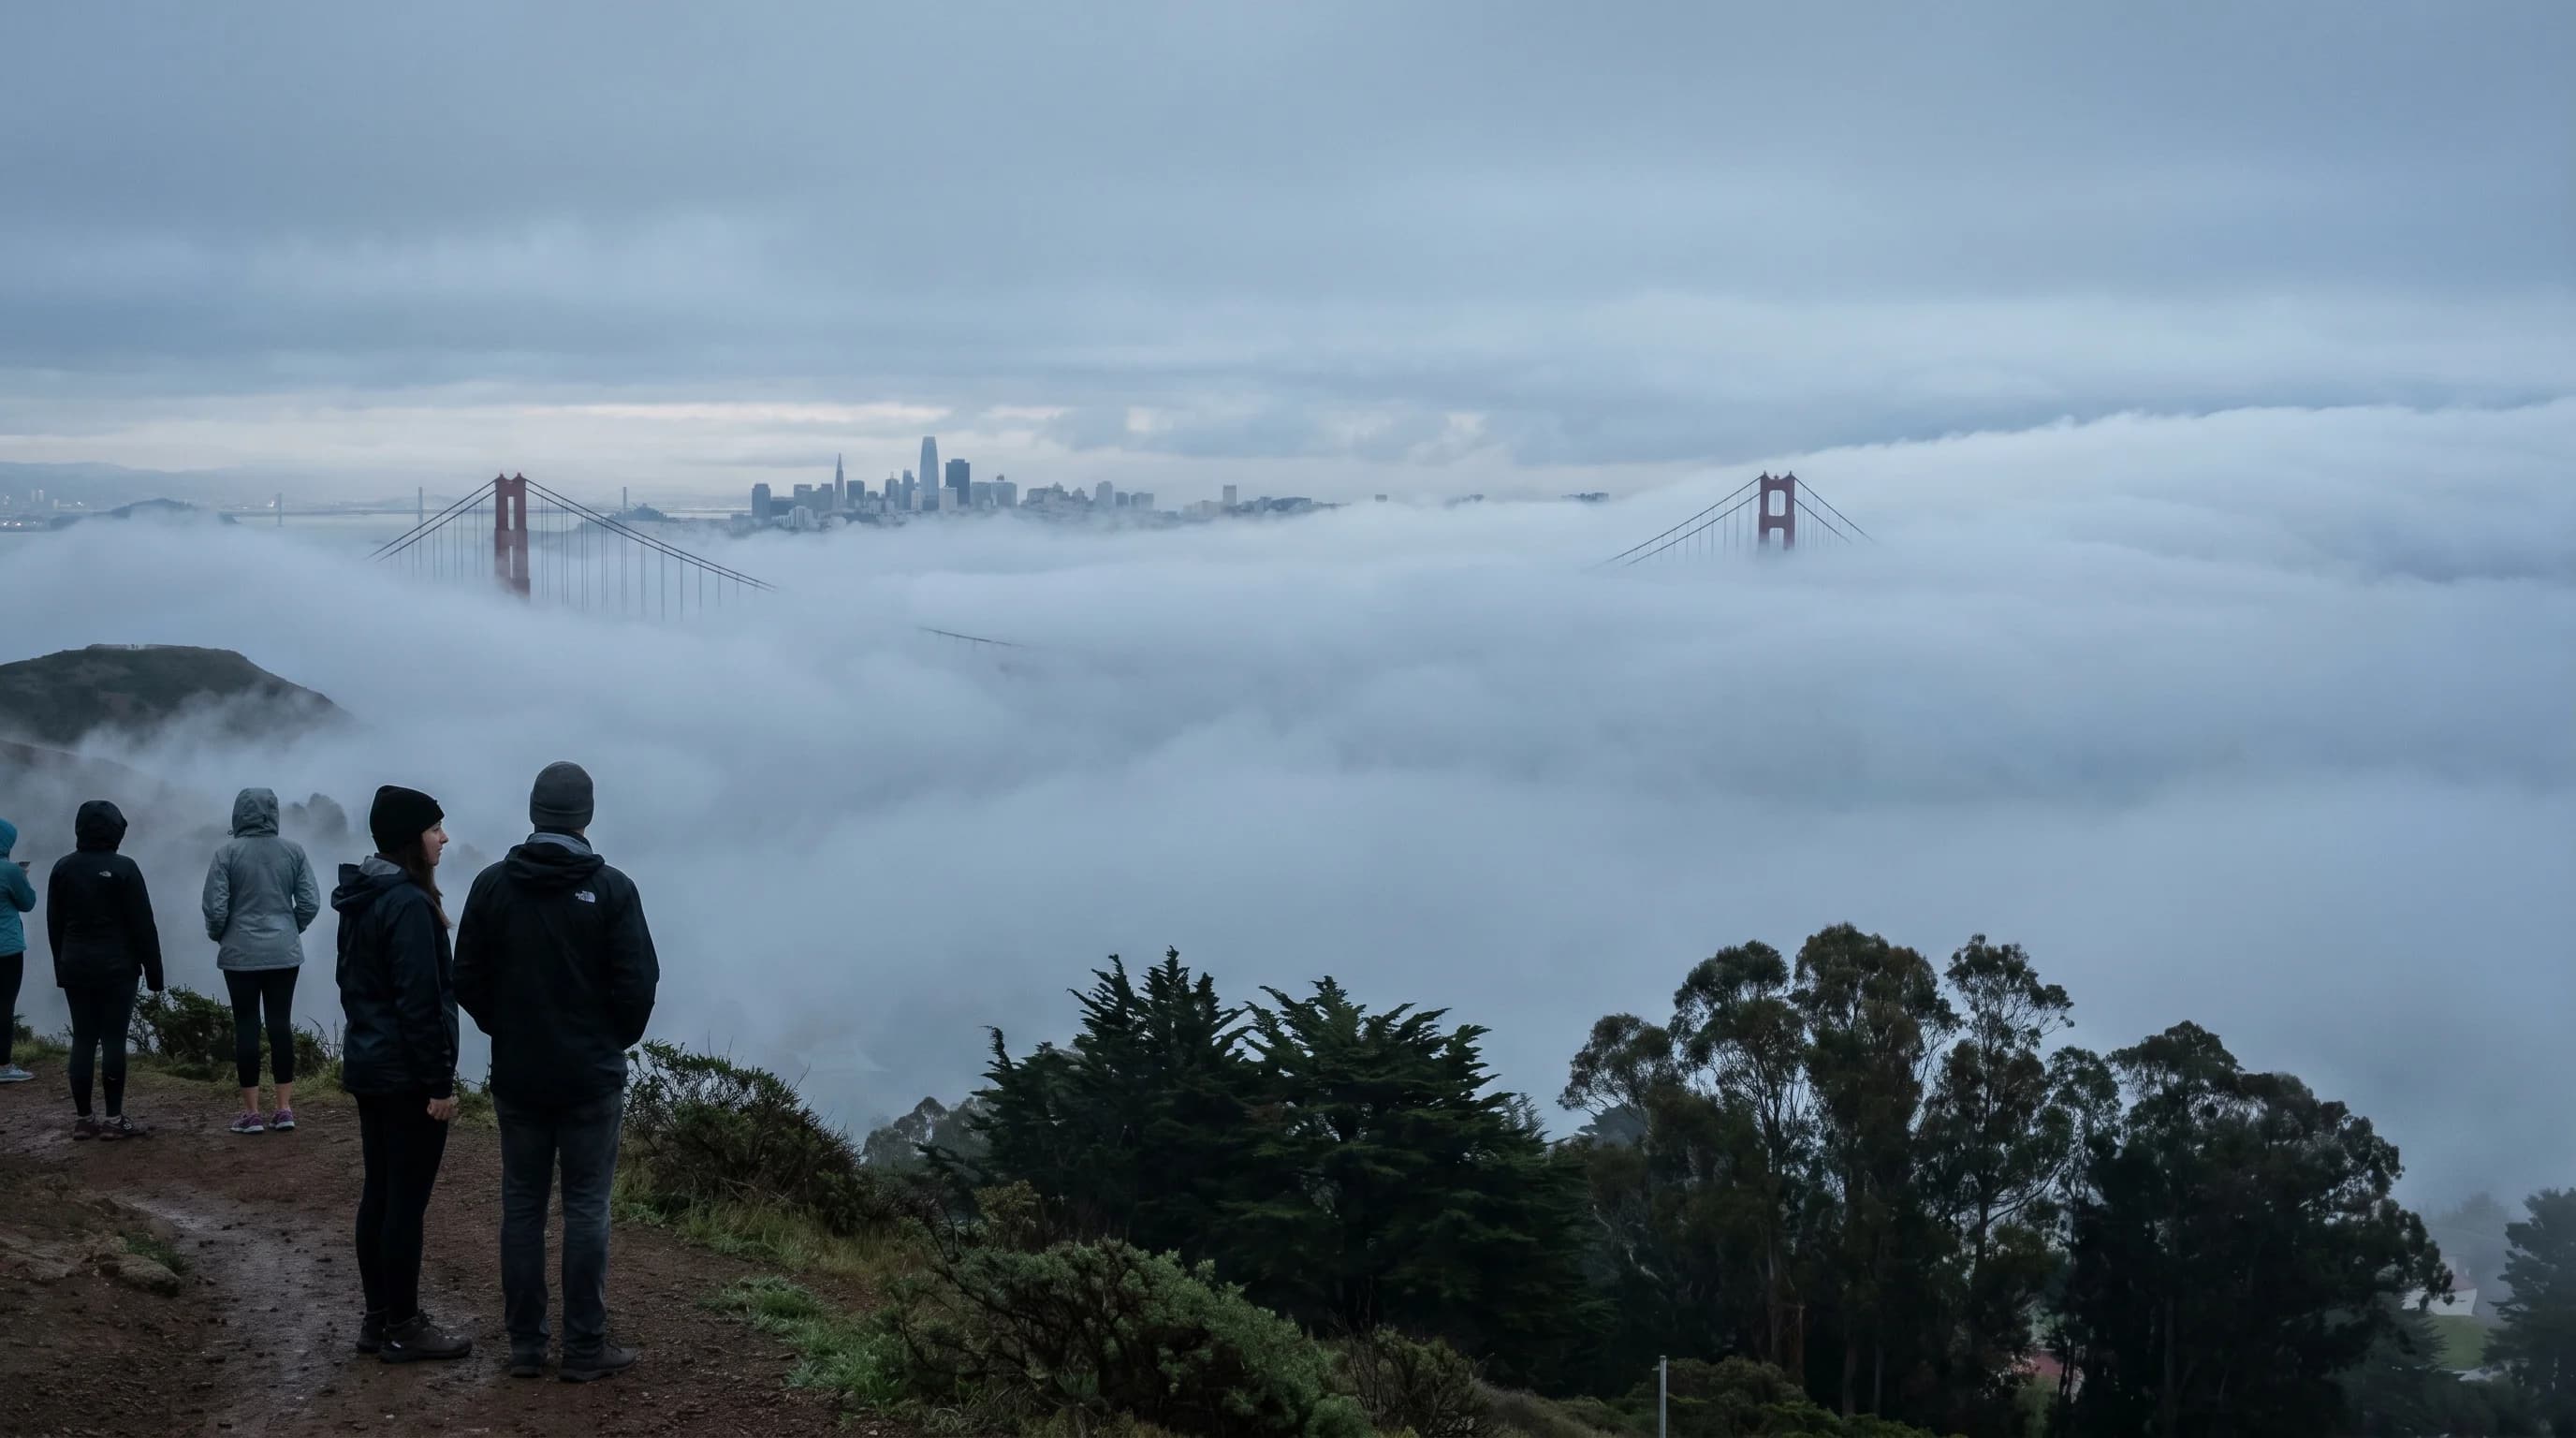
June is the foggiest month in San Francisco. Western neighborhoods average 60°F under thick marine layer while the Mission District hits 70°F in sunshine three miles away.
6min read →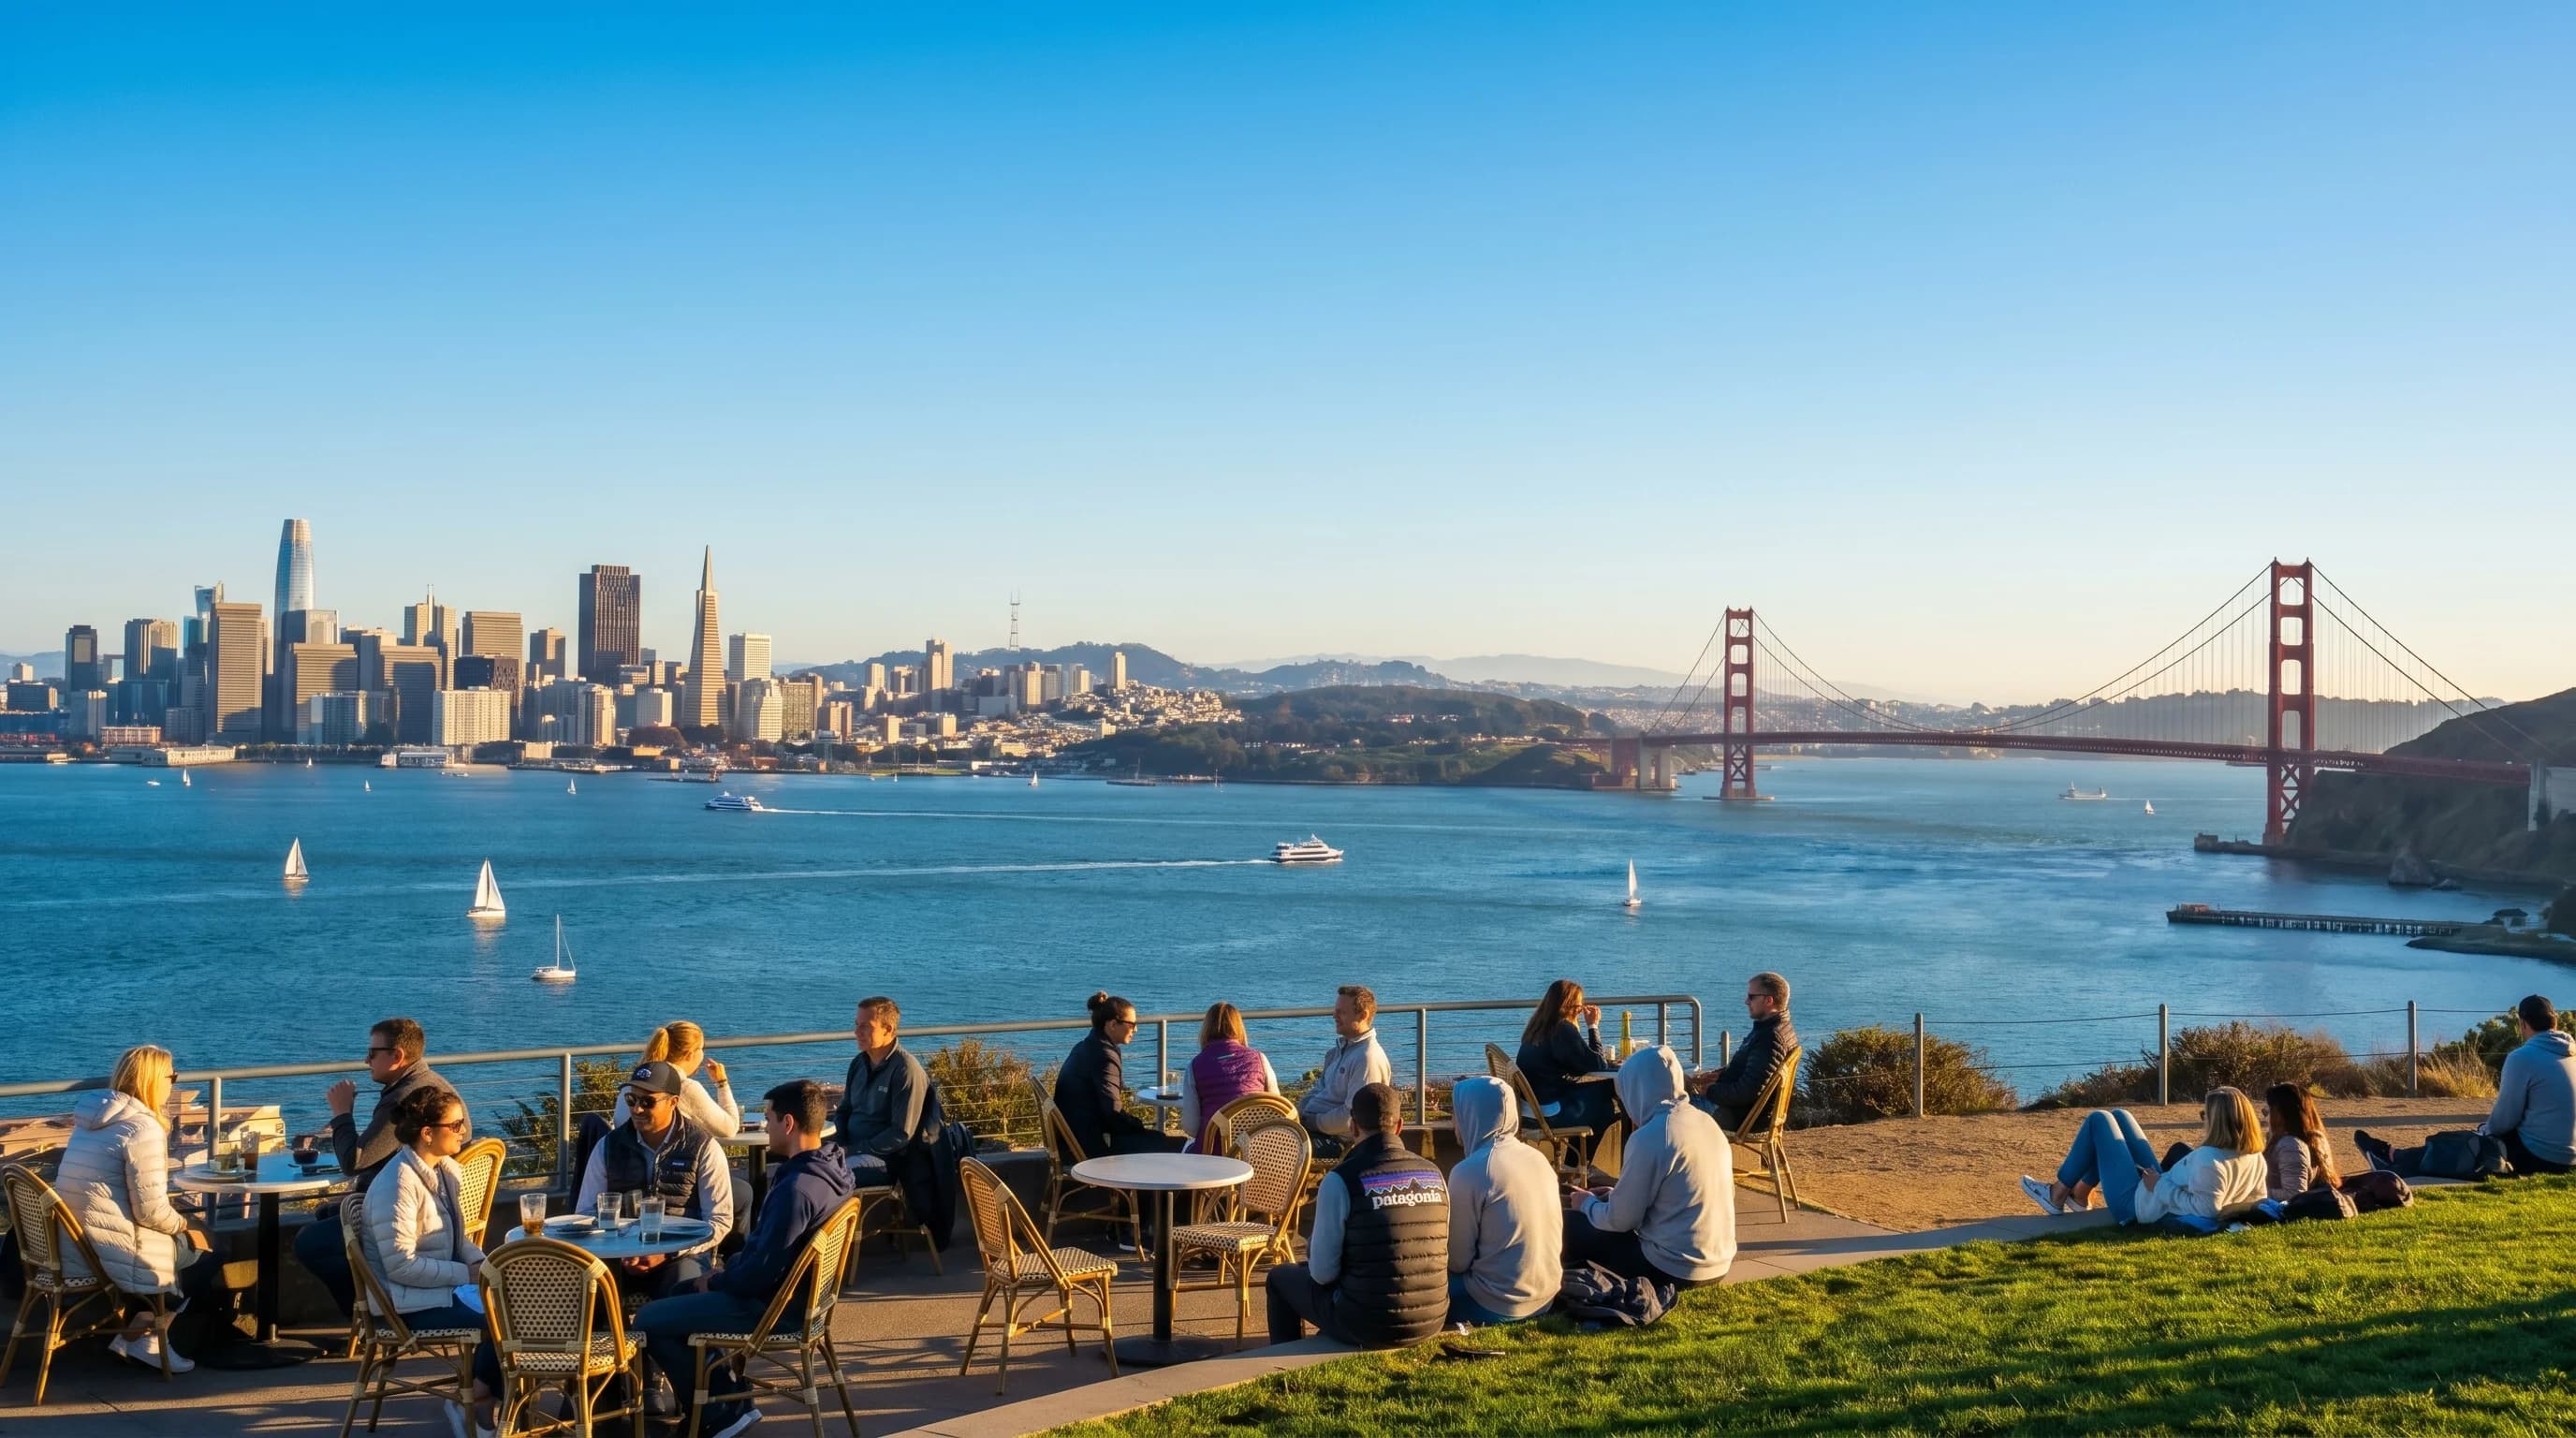
October is San Francisco's real summer. Average highs hit 69°F, fog retreats, and sunshine dominates. But it's also fire season, with Diablo wind events possible.
5min read →
March is San Francisco's shoulder season between wet winter and dry summer. Expect 61°F highs, 3.1 inches of rain, green hills, wildflowers, and minimal fog.
5min read →
San Francisco averages 23.6 inches of rain per year, less than New York or Seattle. Nearly all falls in a five-month window from November through March.
5min read →
Annual rainfall in the Bay Area varies from 15 inches in San Jose to 50+ inches in the Santa Cruz Mountains, driven by orographic lift and proximity to the coast.
6min read →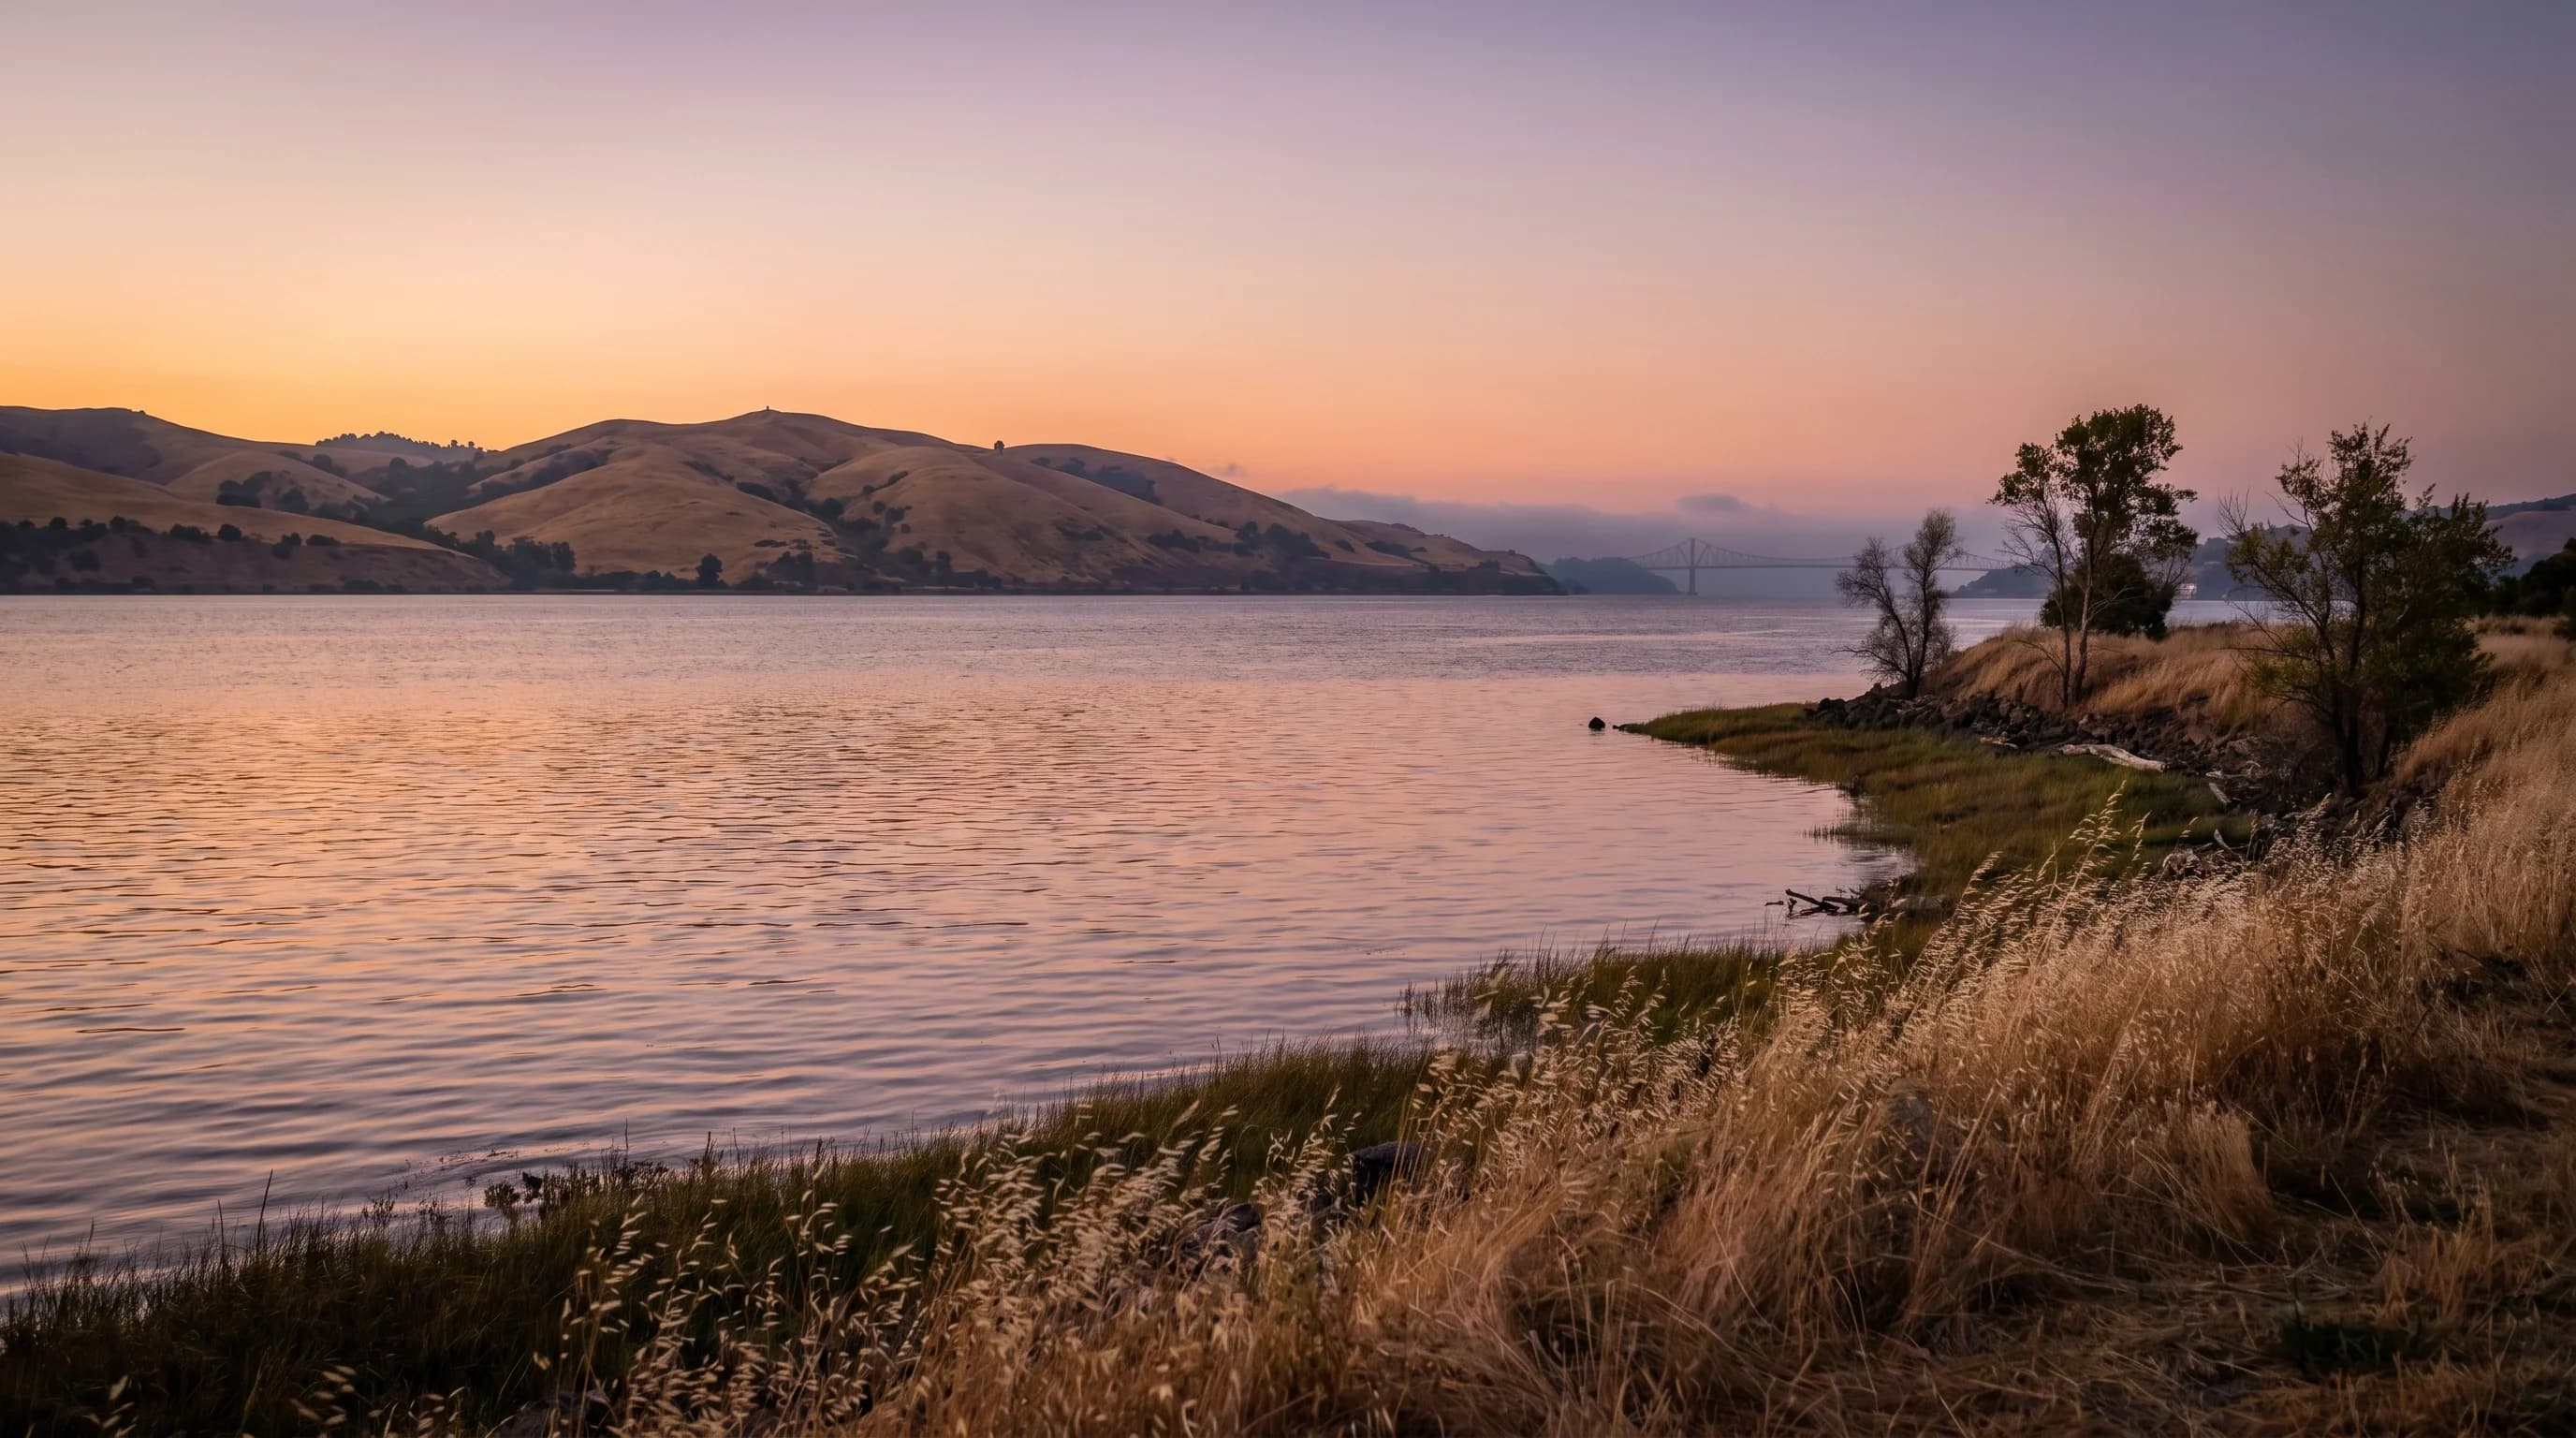
The delta breeze carries cool Pacific air through the Carquinez Strait into inland valleys each summer evening, dropping temperatures 15-25°F and providing natural air conditioning.
6min read →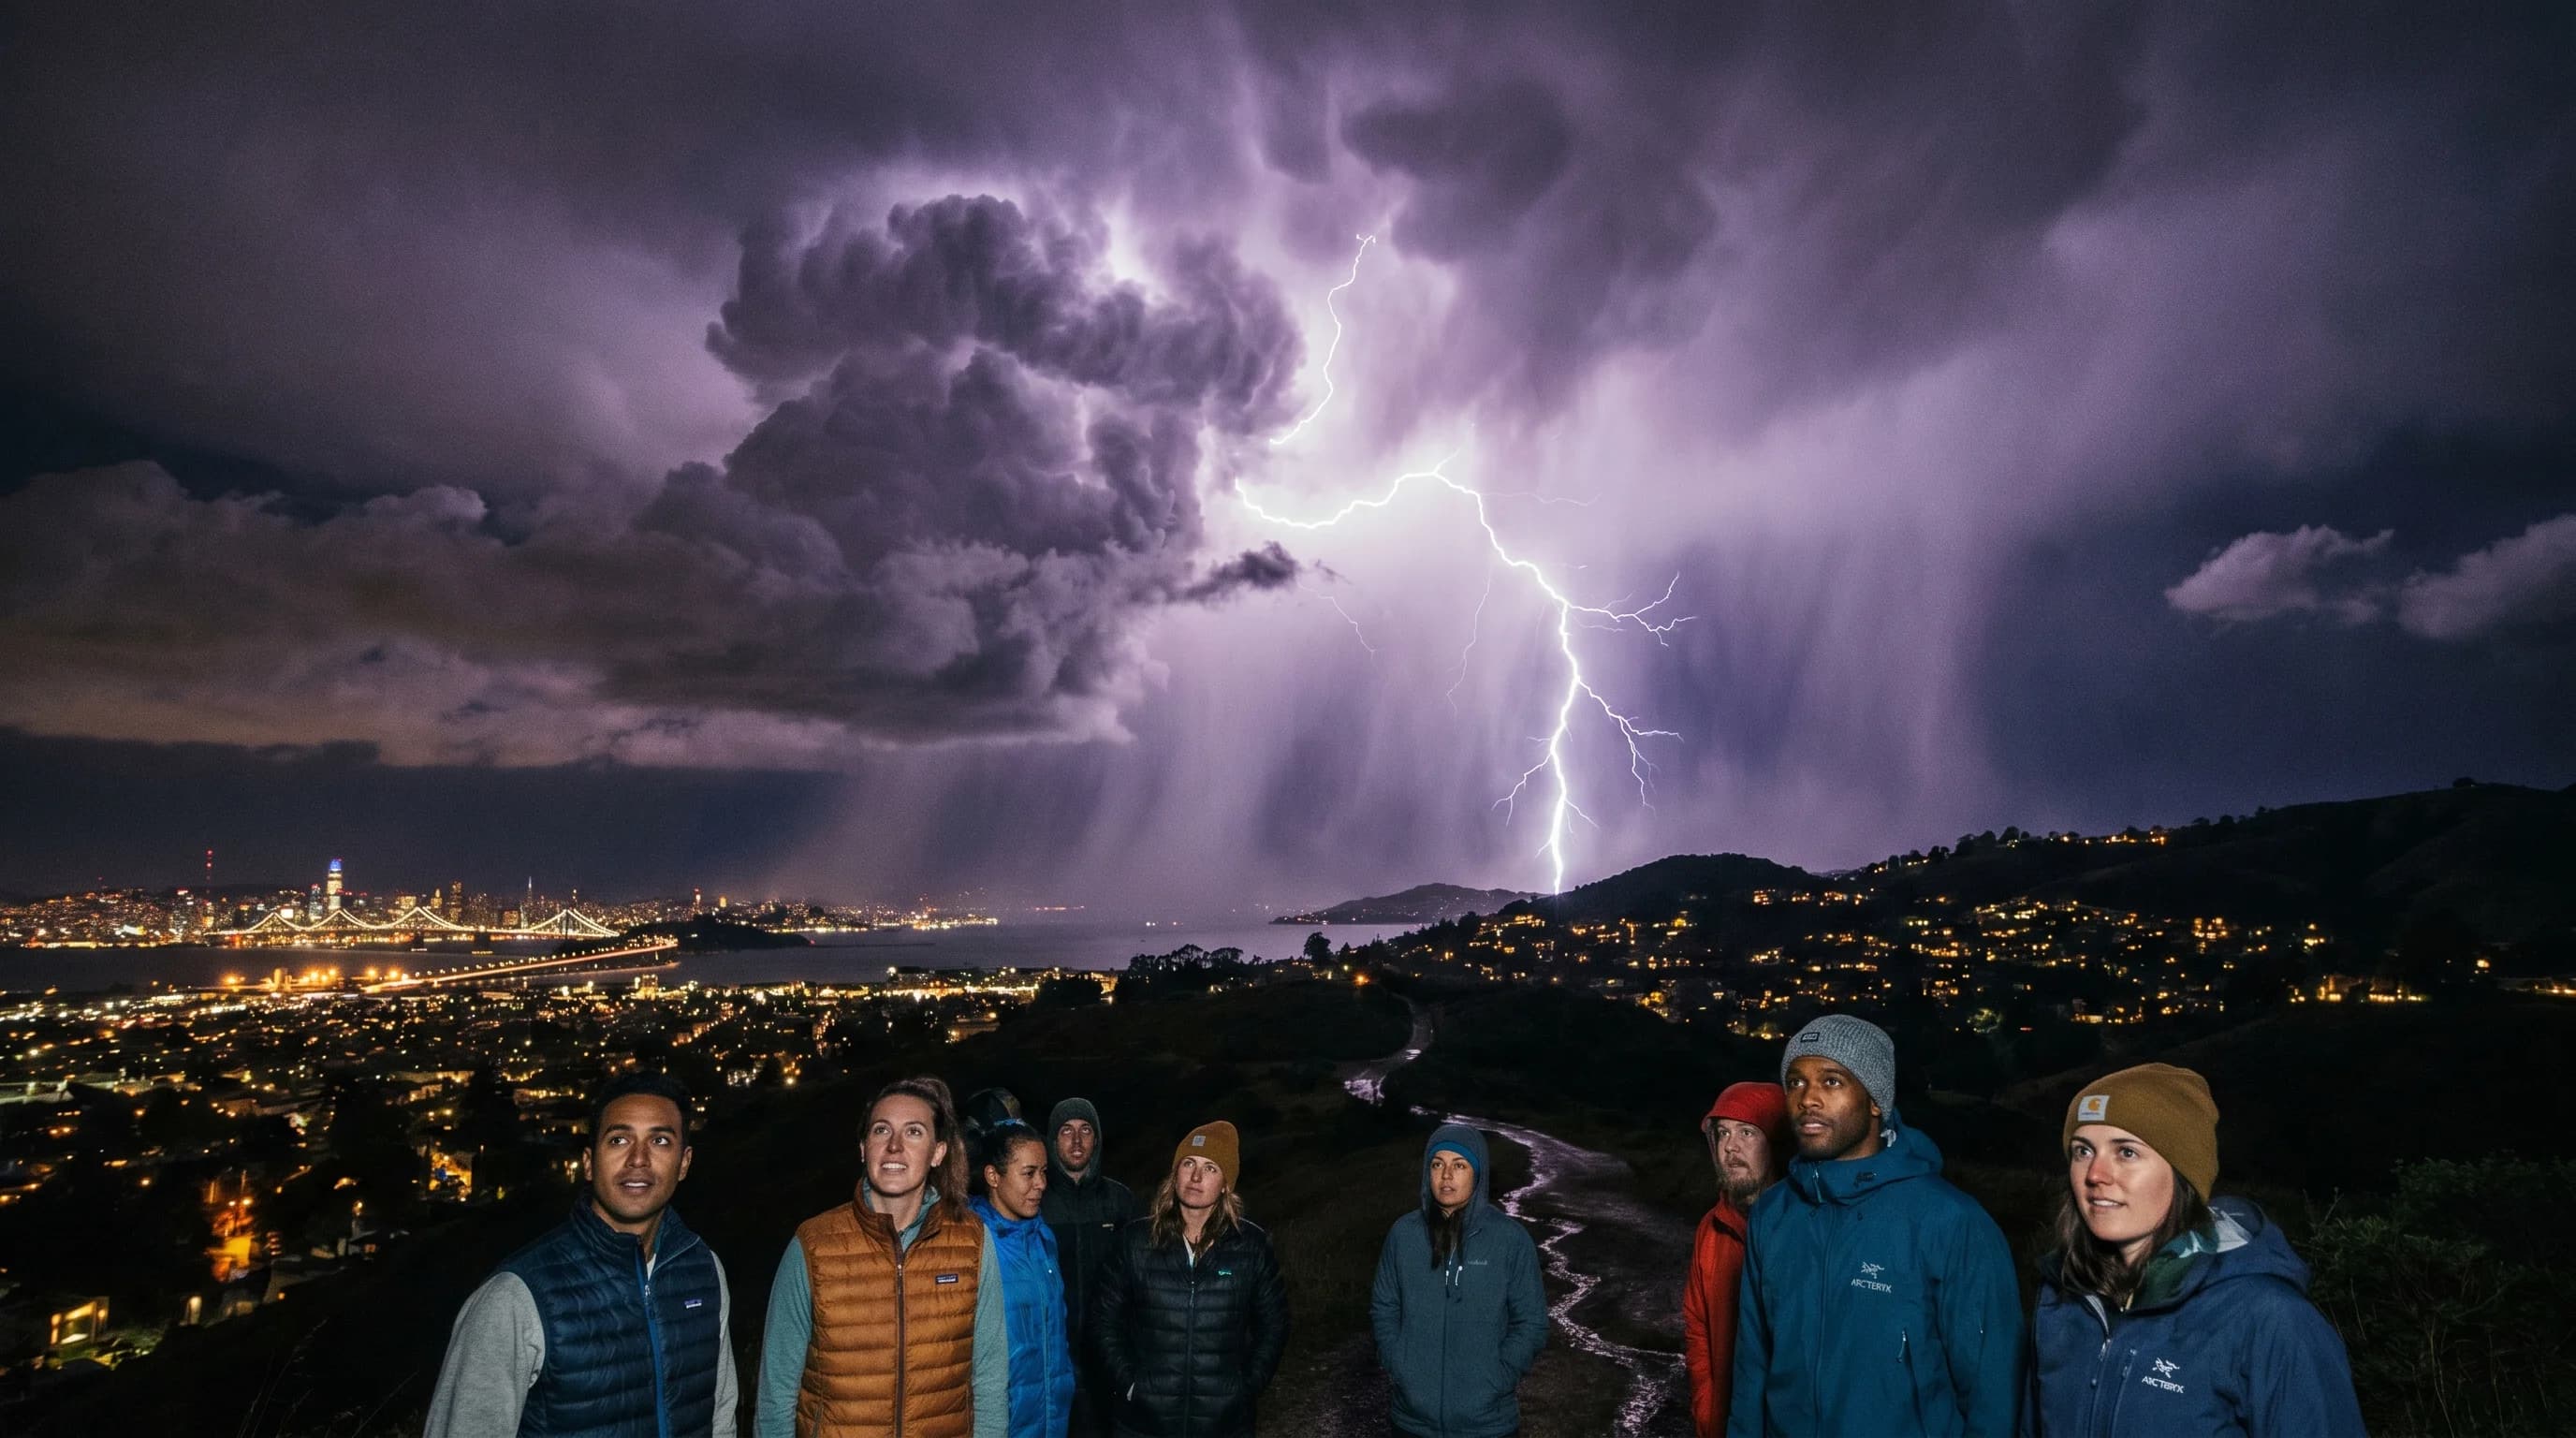
Bay Area thunderstorms are genuinely rare, averaging 2-5 days per year. The cold Pacific and persistent temperature inversion suppress the instability thunderstorms need.
6min read →
The Bay Area goes 5-6 months without measurable rain each year. The first storm usually arrives between mid-October and mid-November, depending on the jet stream and ENSO cycle.
5min read →Category
Month-by-month breakdowns of what to expect and when to visit for the best conditions.
September and October are the warmest, sunniest months in the Bay Area, not July. Summer fog keeps the coast cool until it retreats in late August. Here is why.
5min read →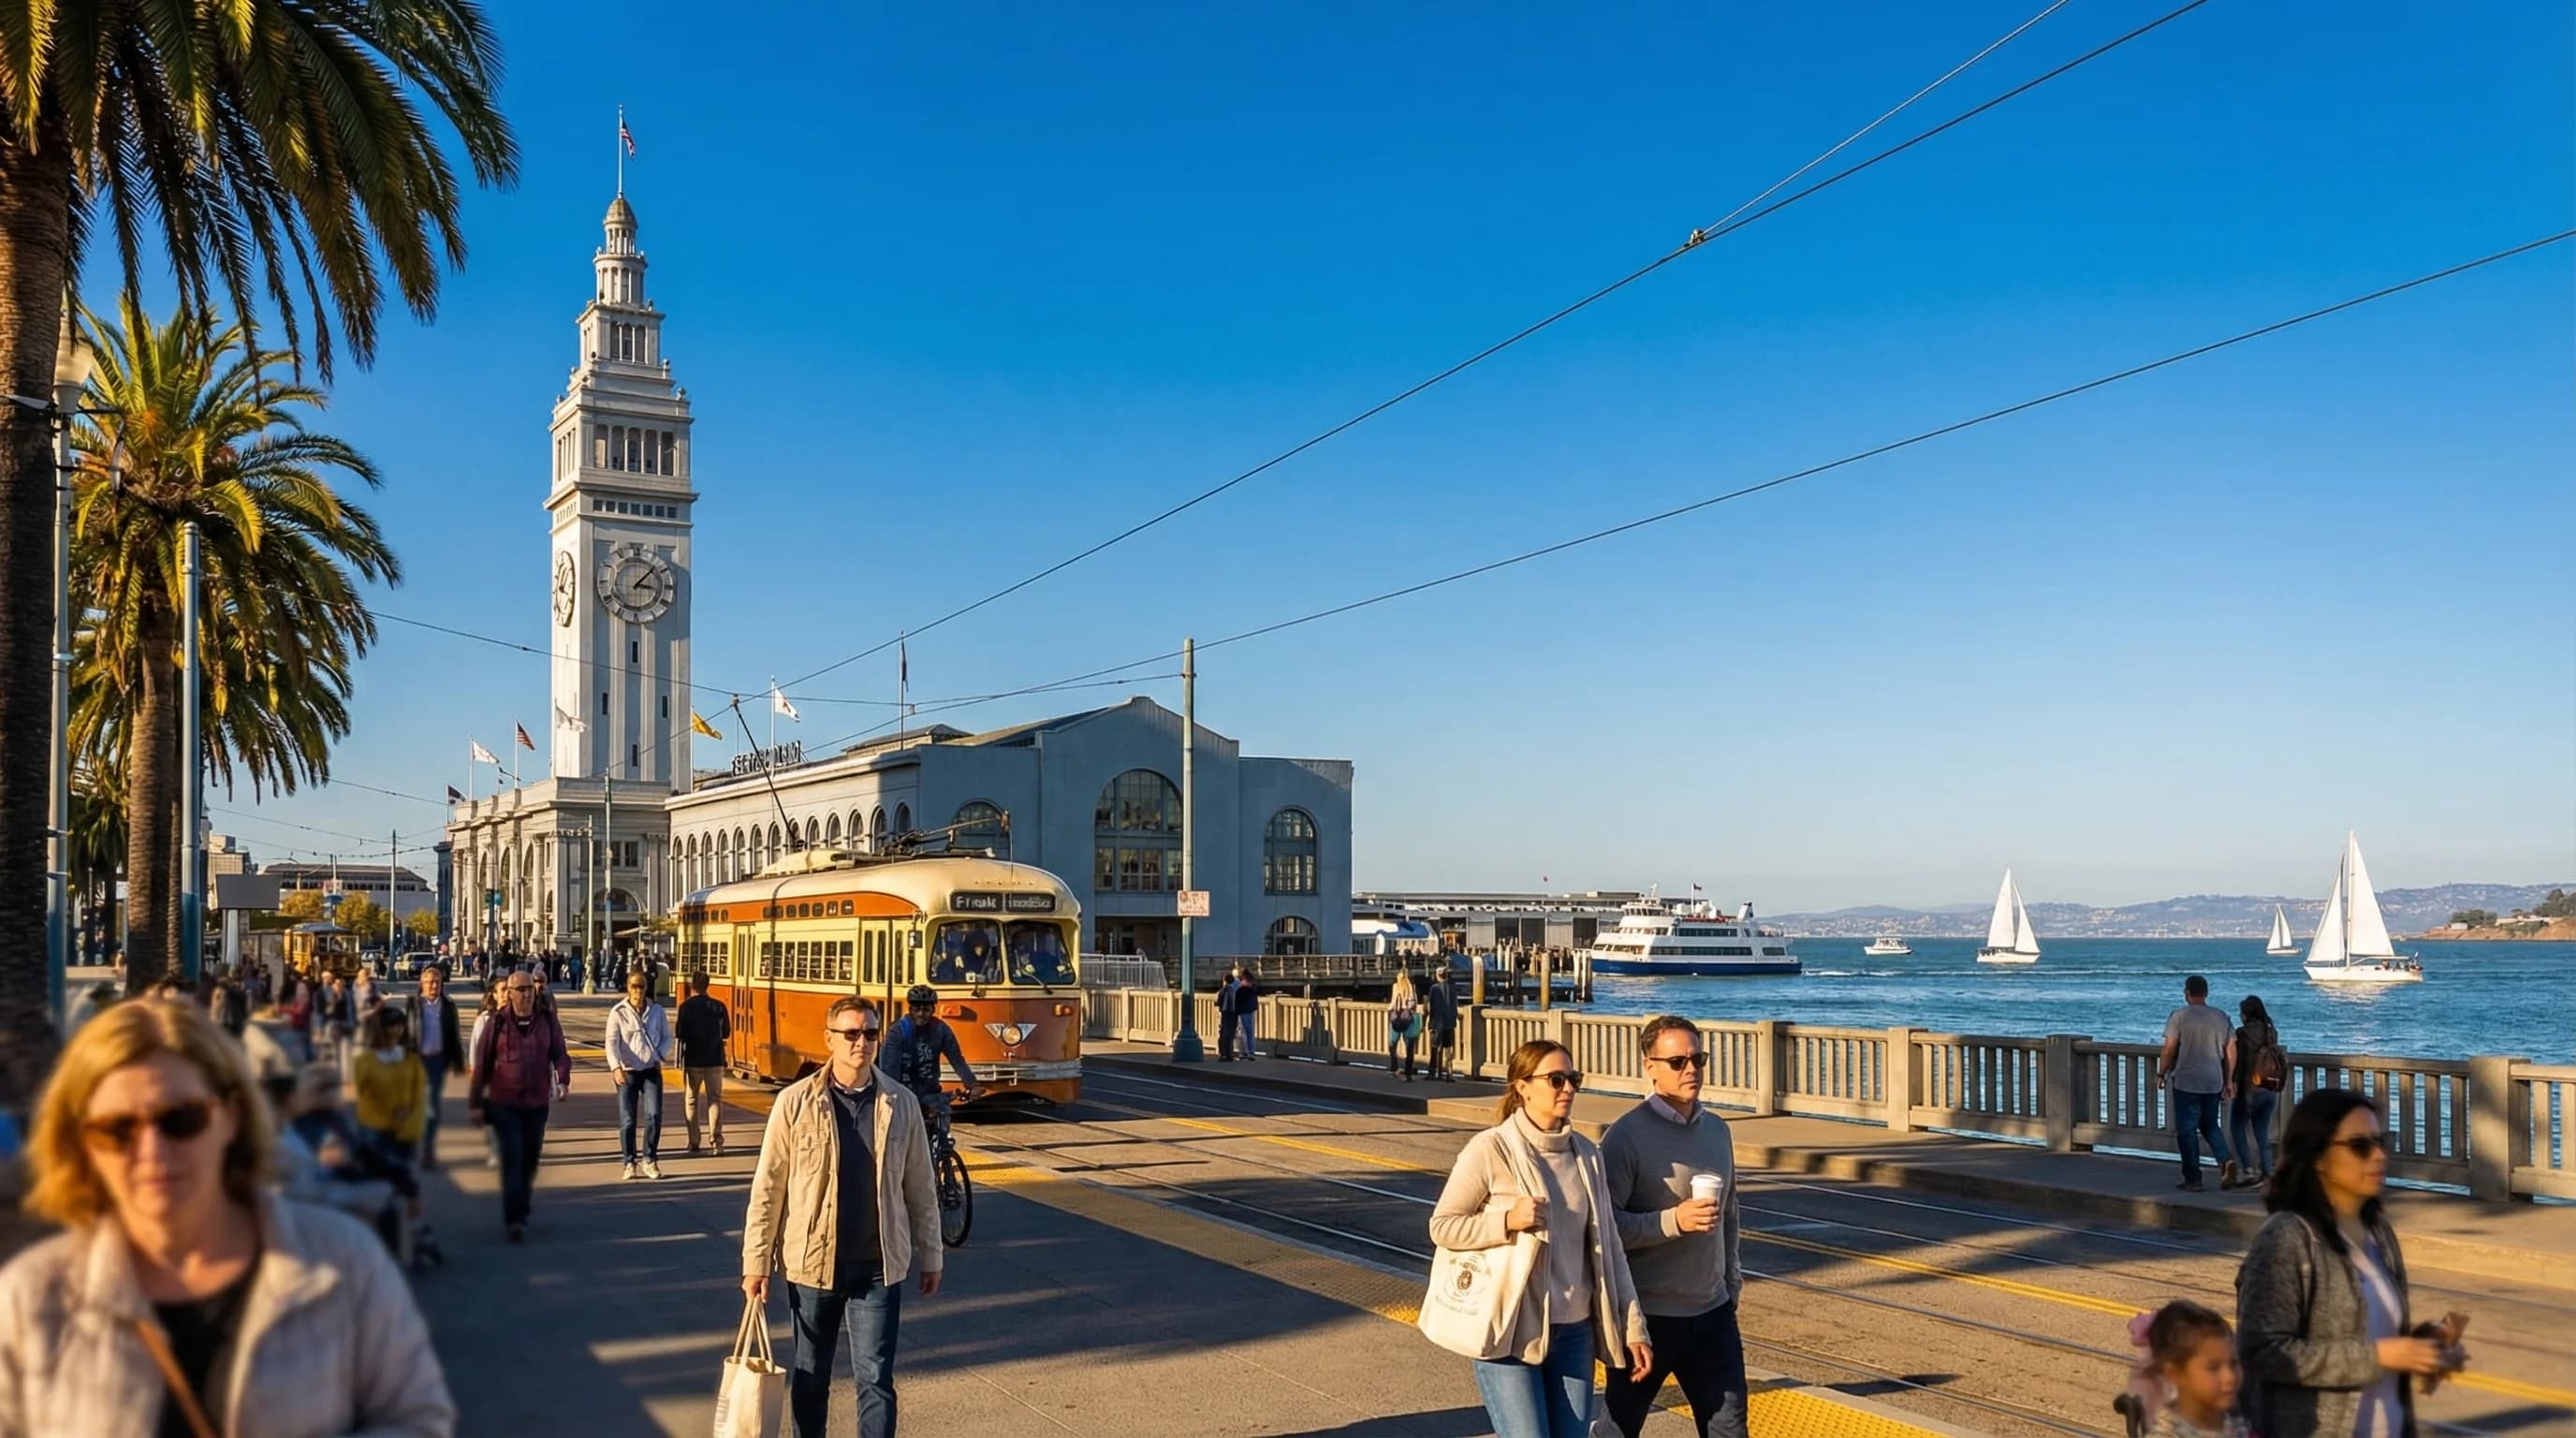
The counterintuitive truth about San Francisco weather: summer is the worst time to visit if you want warmth and sun. September and October are when the city finally delivers on its California promise.
6min read →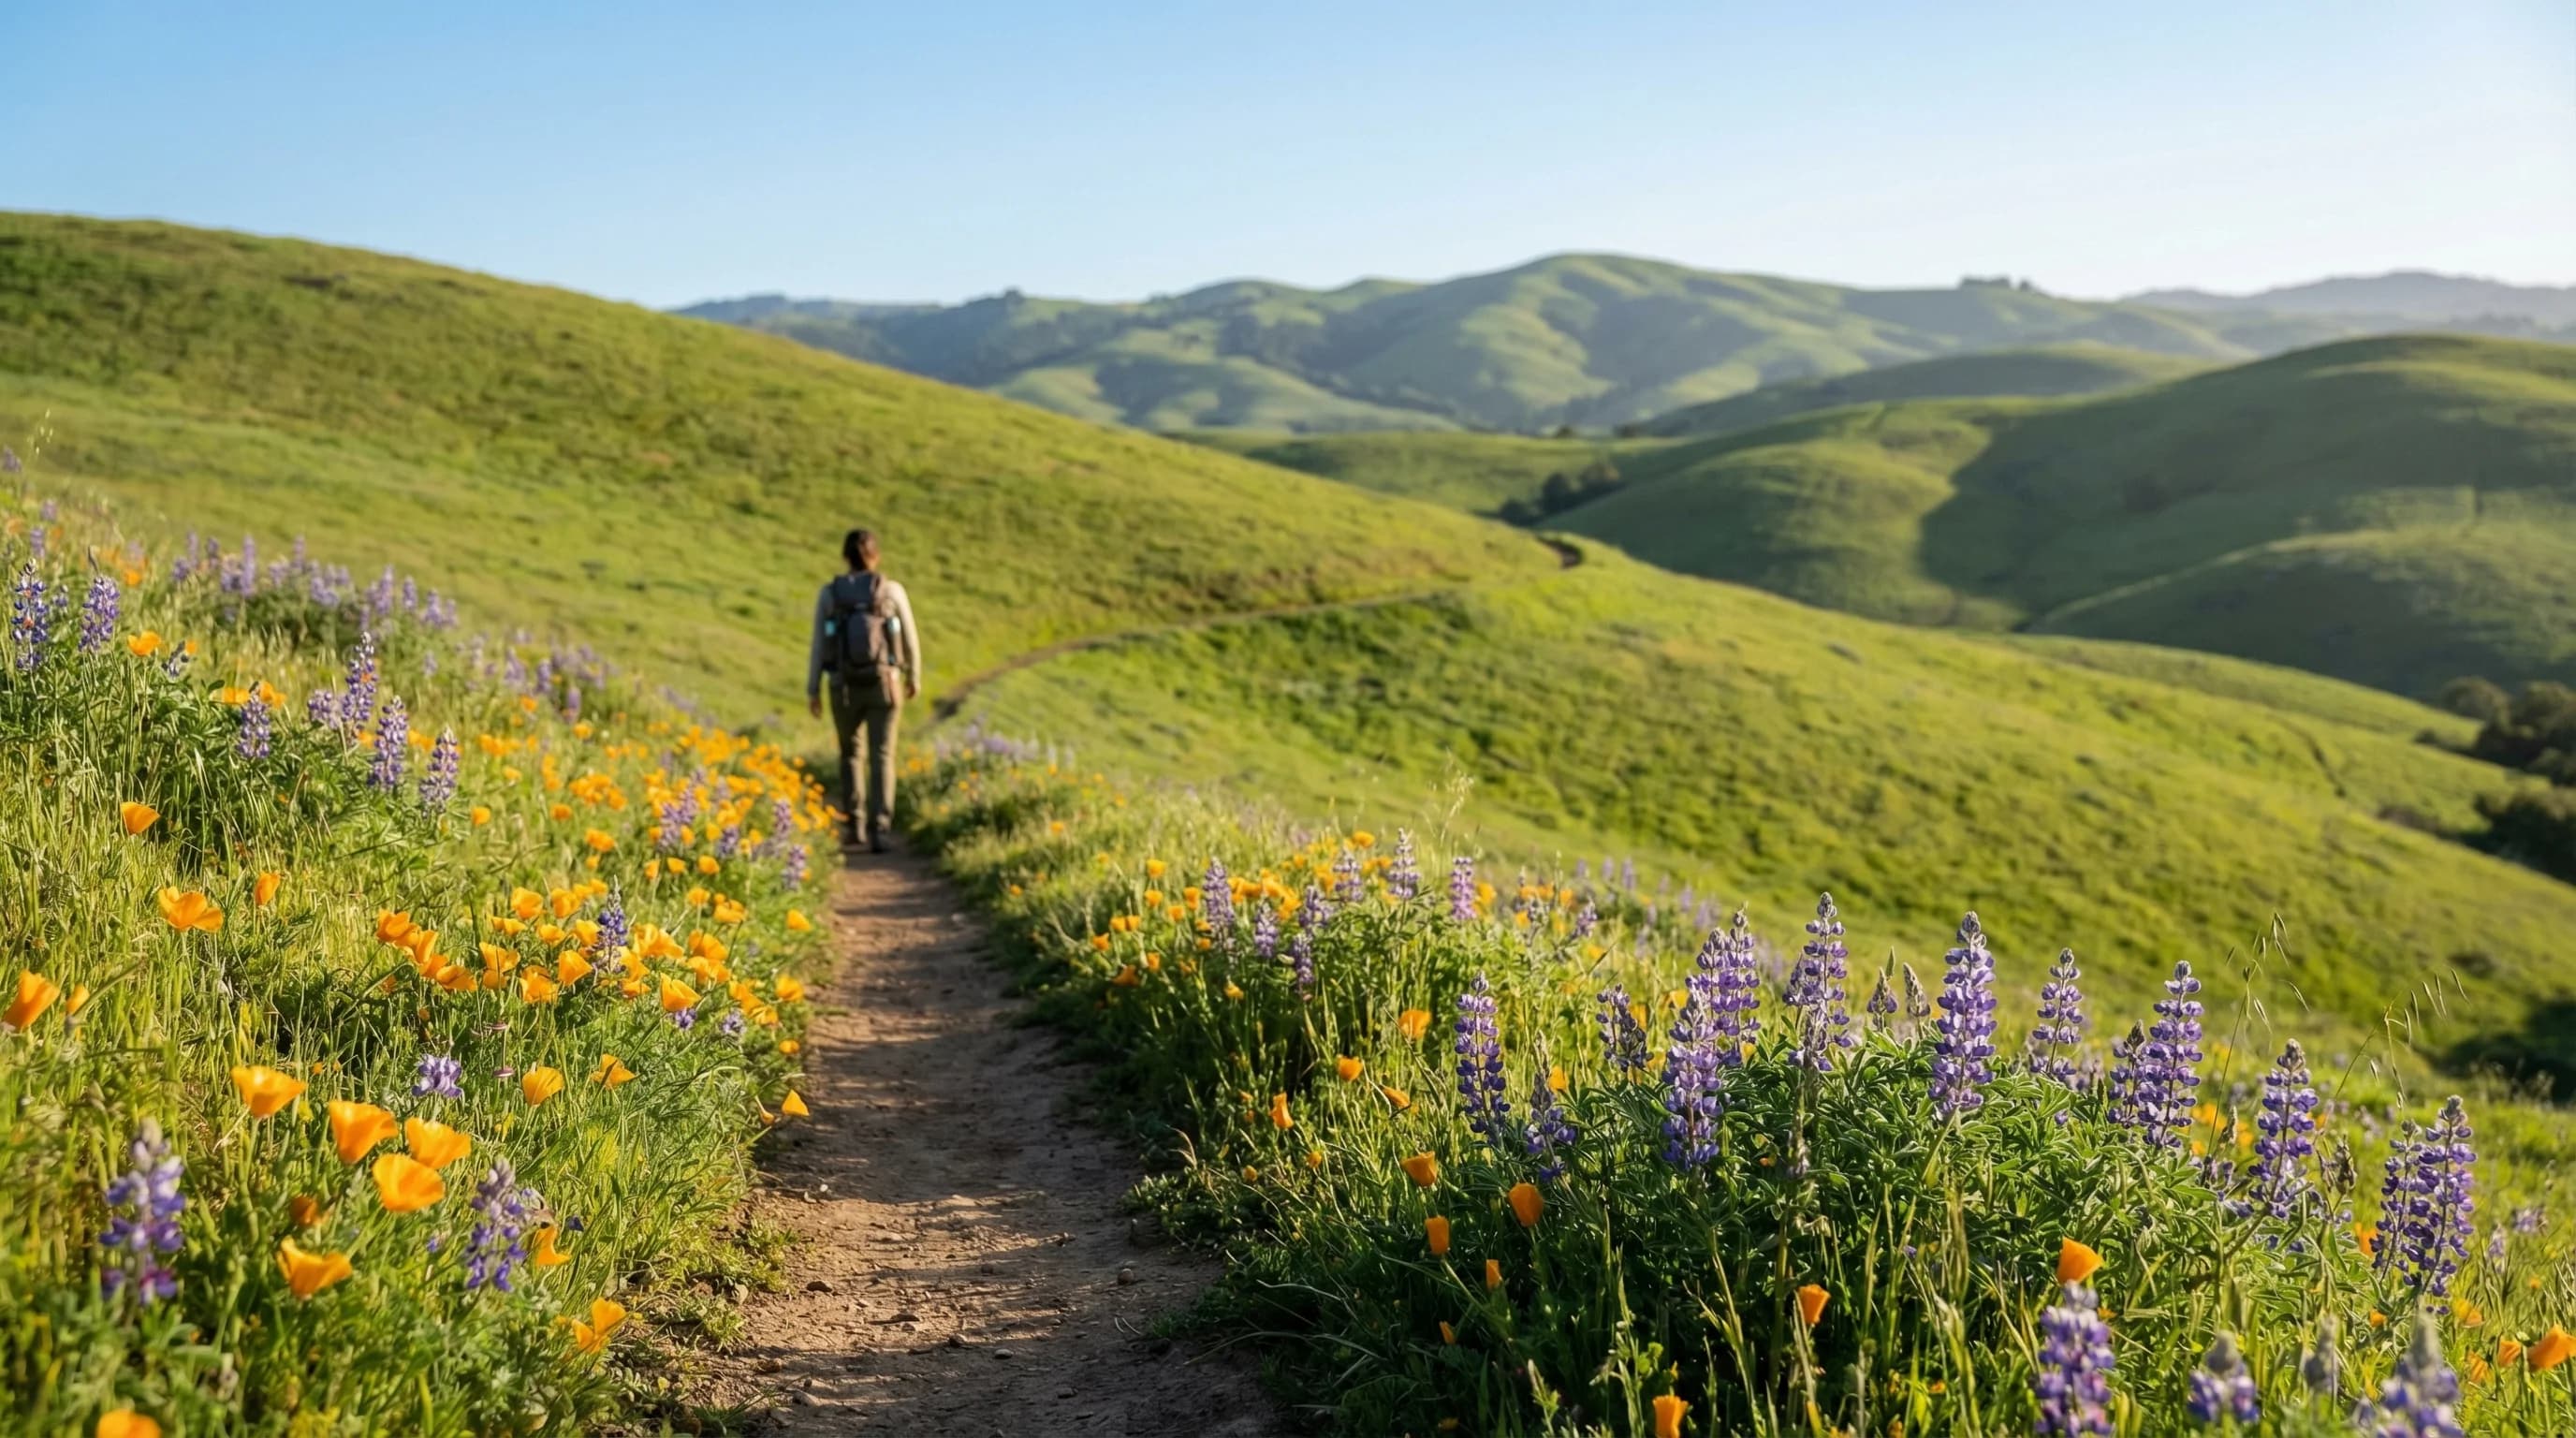
Bay Area hiking has two ideal windows: spring wildflower season (April to May) and fall clearing season (September to October). Summer is complicated, and winter is muddy. Here is how to plan.
6min read →
San Francisco packs 22 inches of annual rain into a five-month wet season from November through March. The other seven months average essentially zero rainfall. Here is how this Mediterranean pattern works.
7min read →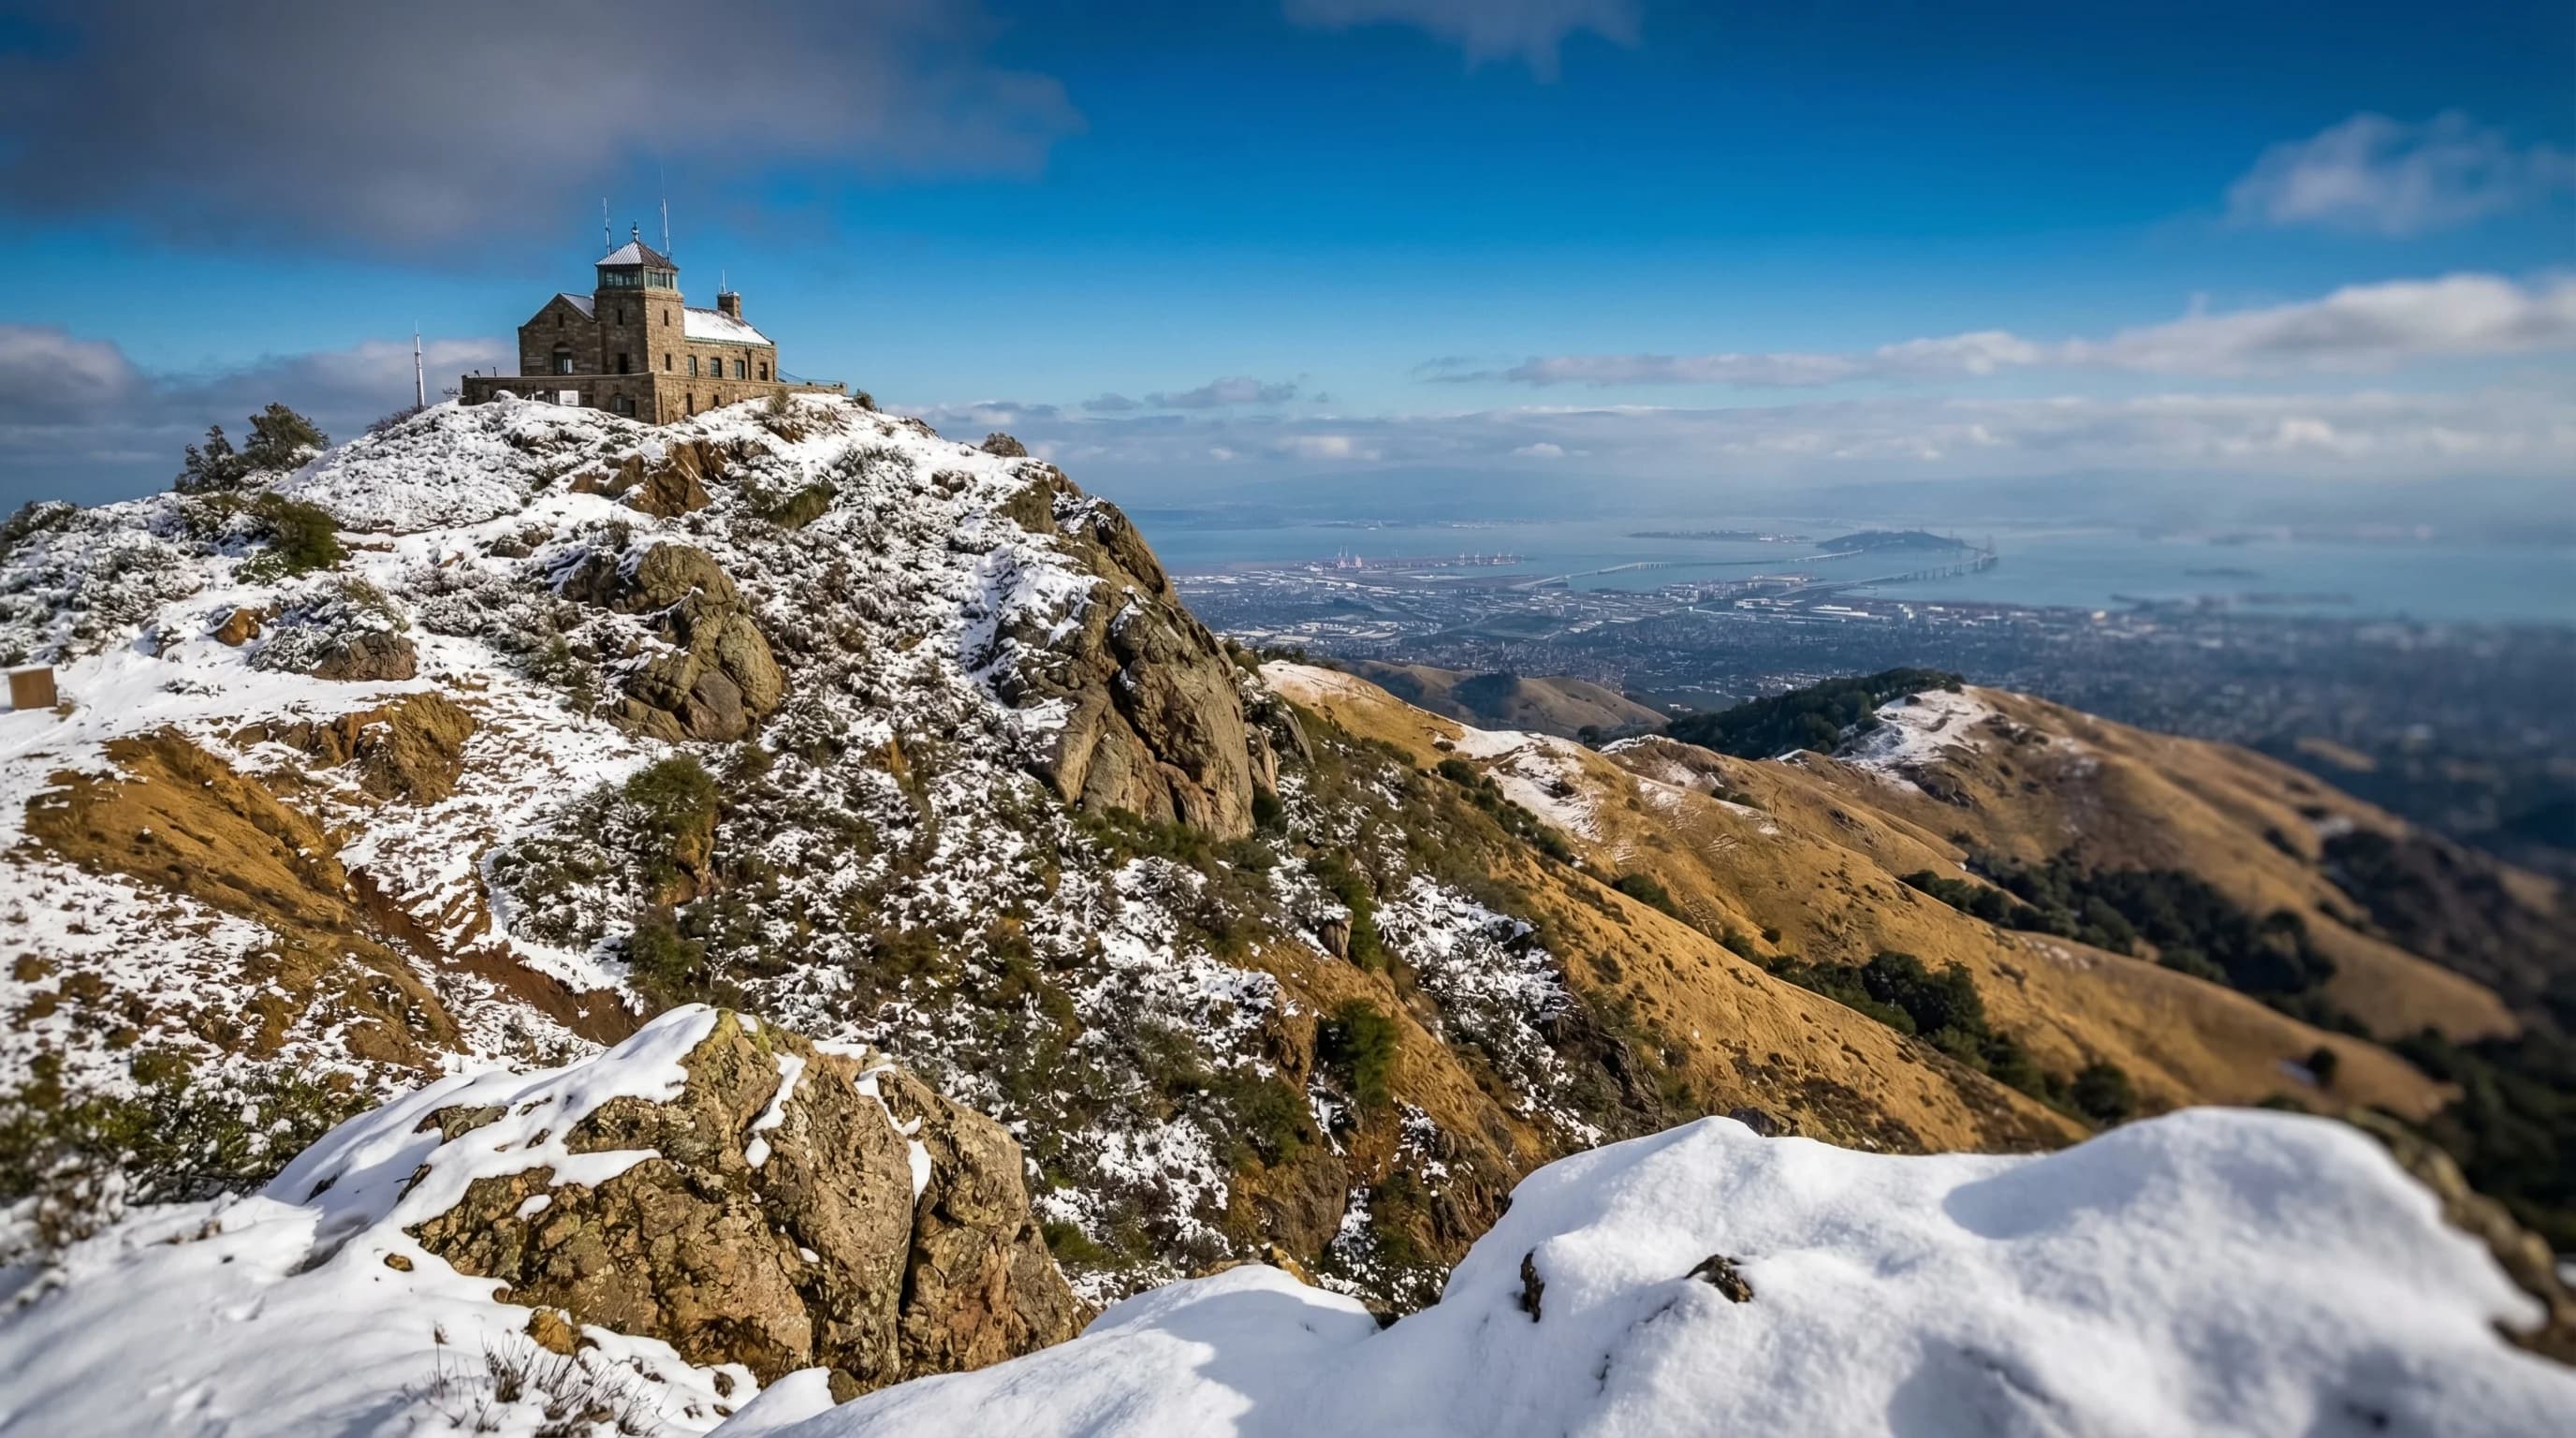
Snow in the Bay Area is rare but real. Mount Diablo and Hamilton see accumulation most winters when storms drop the snow level below 3,000 feet. Here is where to go, when to expect it, and what the records show.
7min read →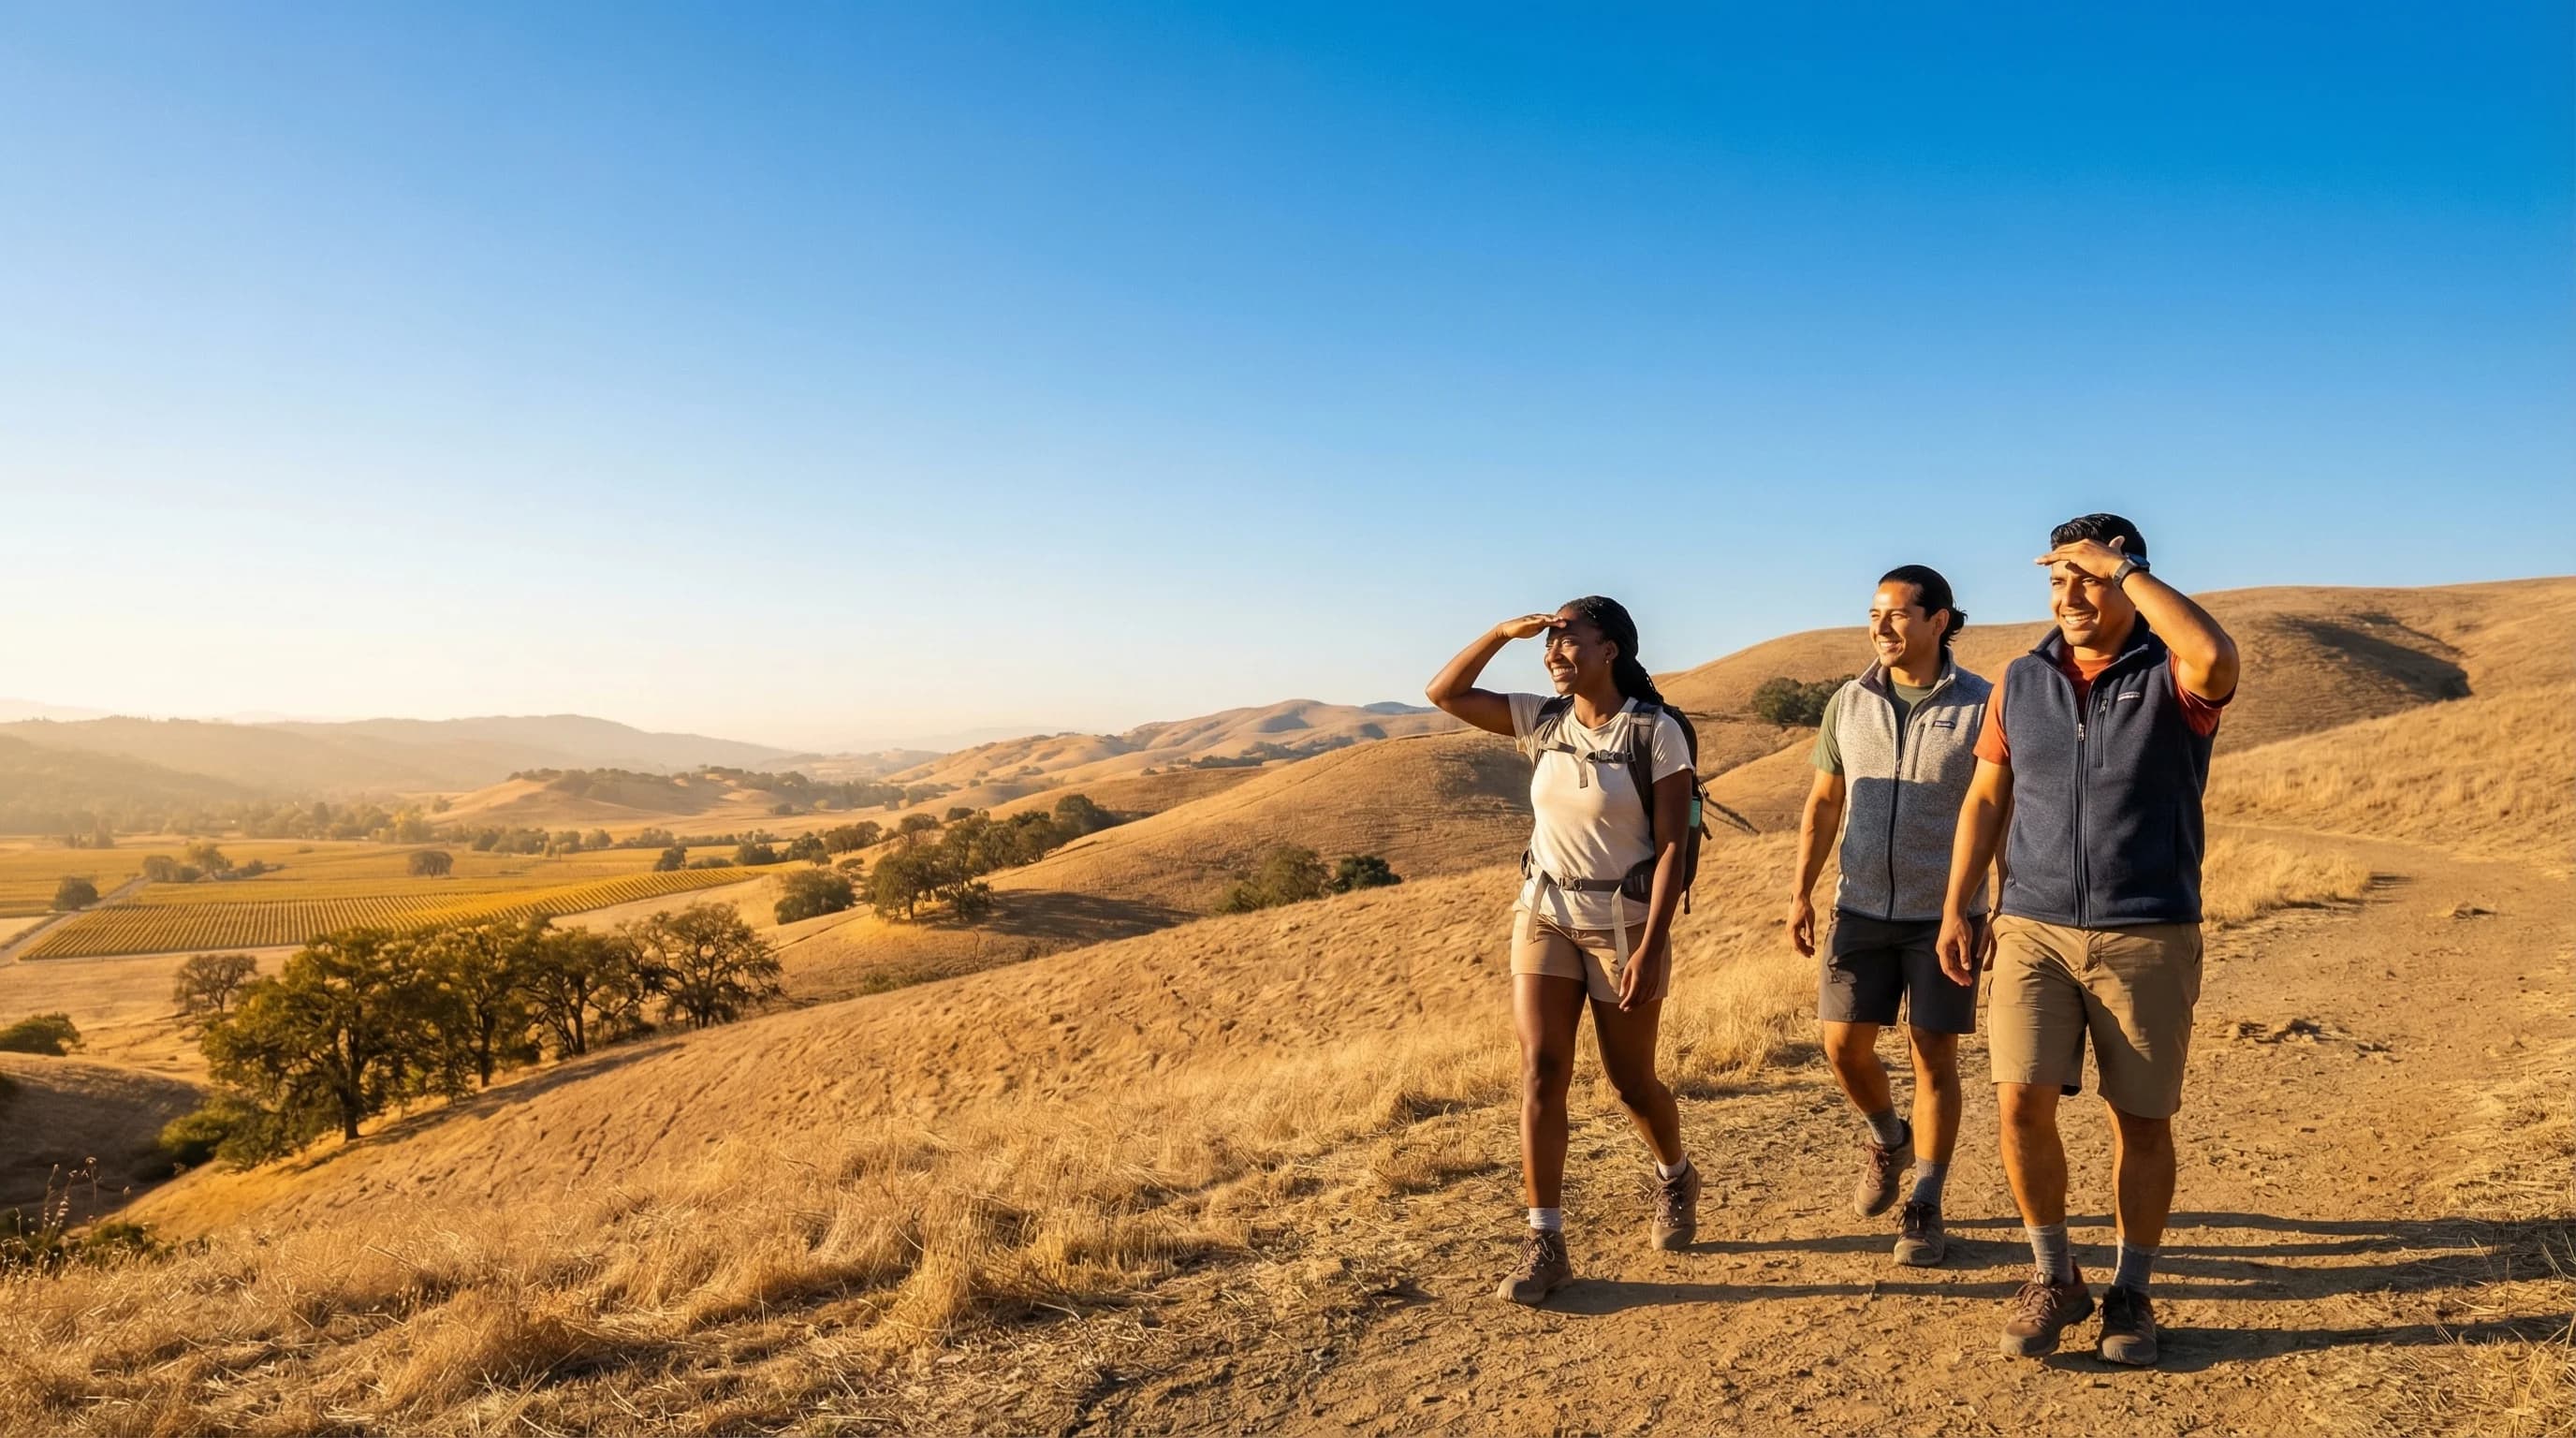
September and October are the warmest months of the year across most of the inland Bay Area. When the North Pacific High weakens, the marine layer retreats and Indian summer arrives with the year's best weather.
6min read →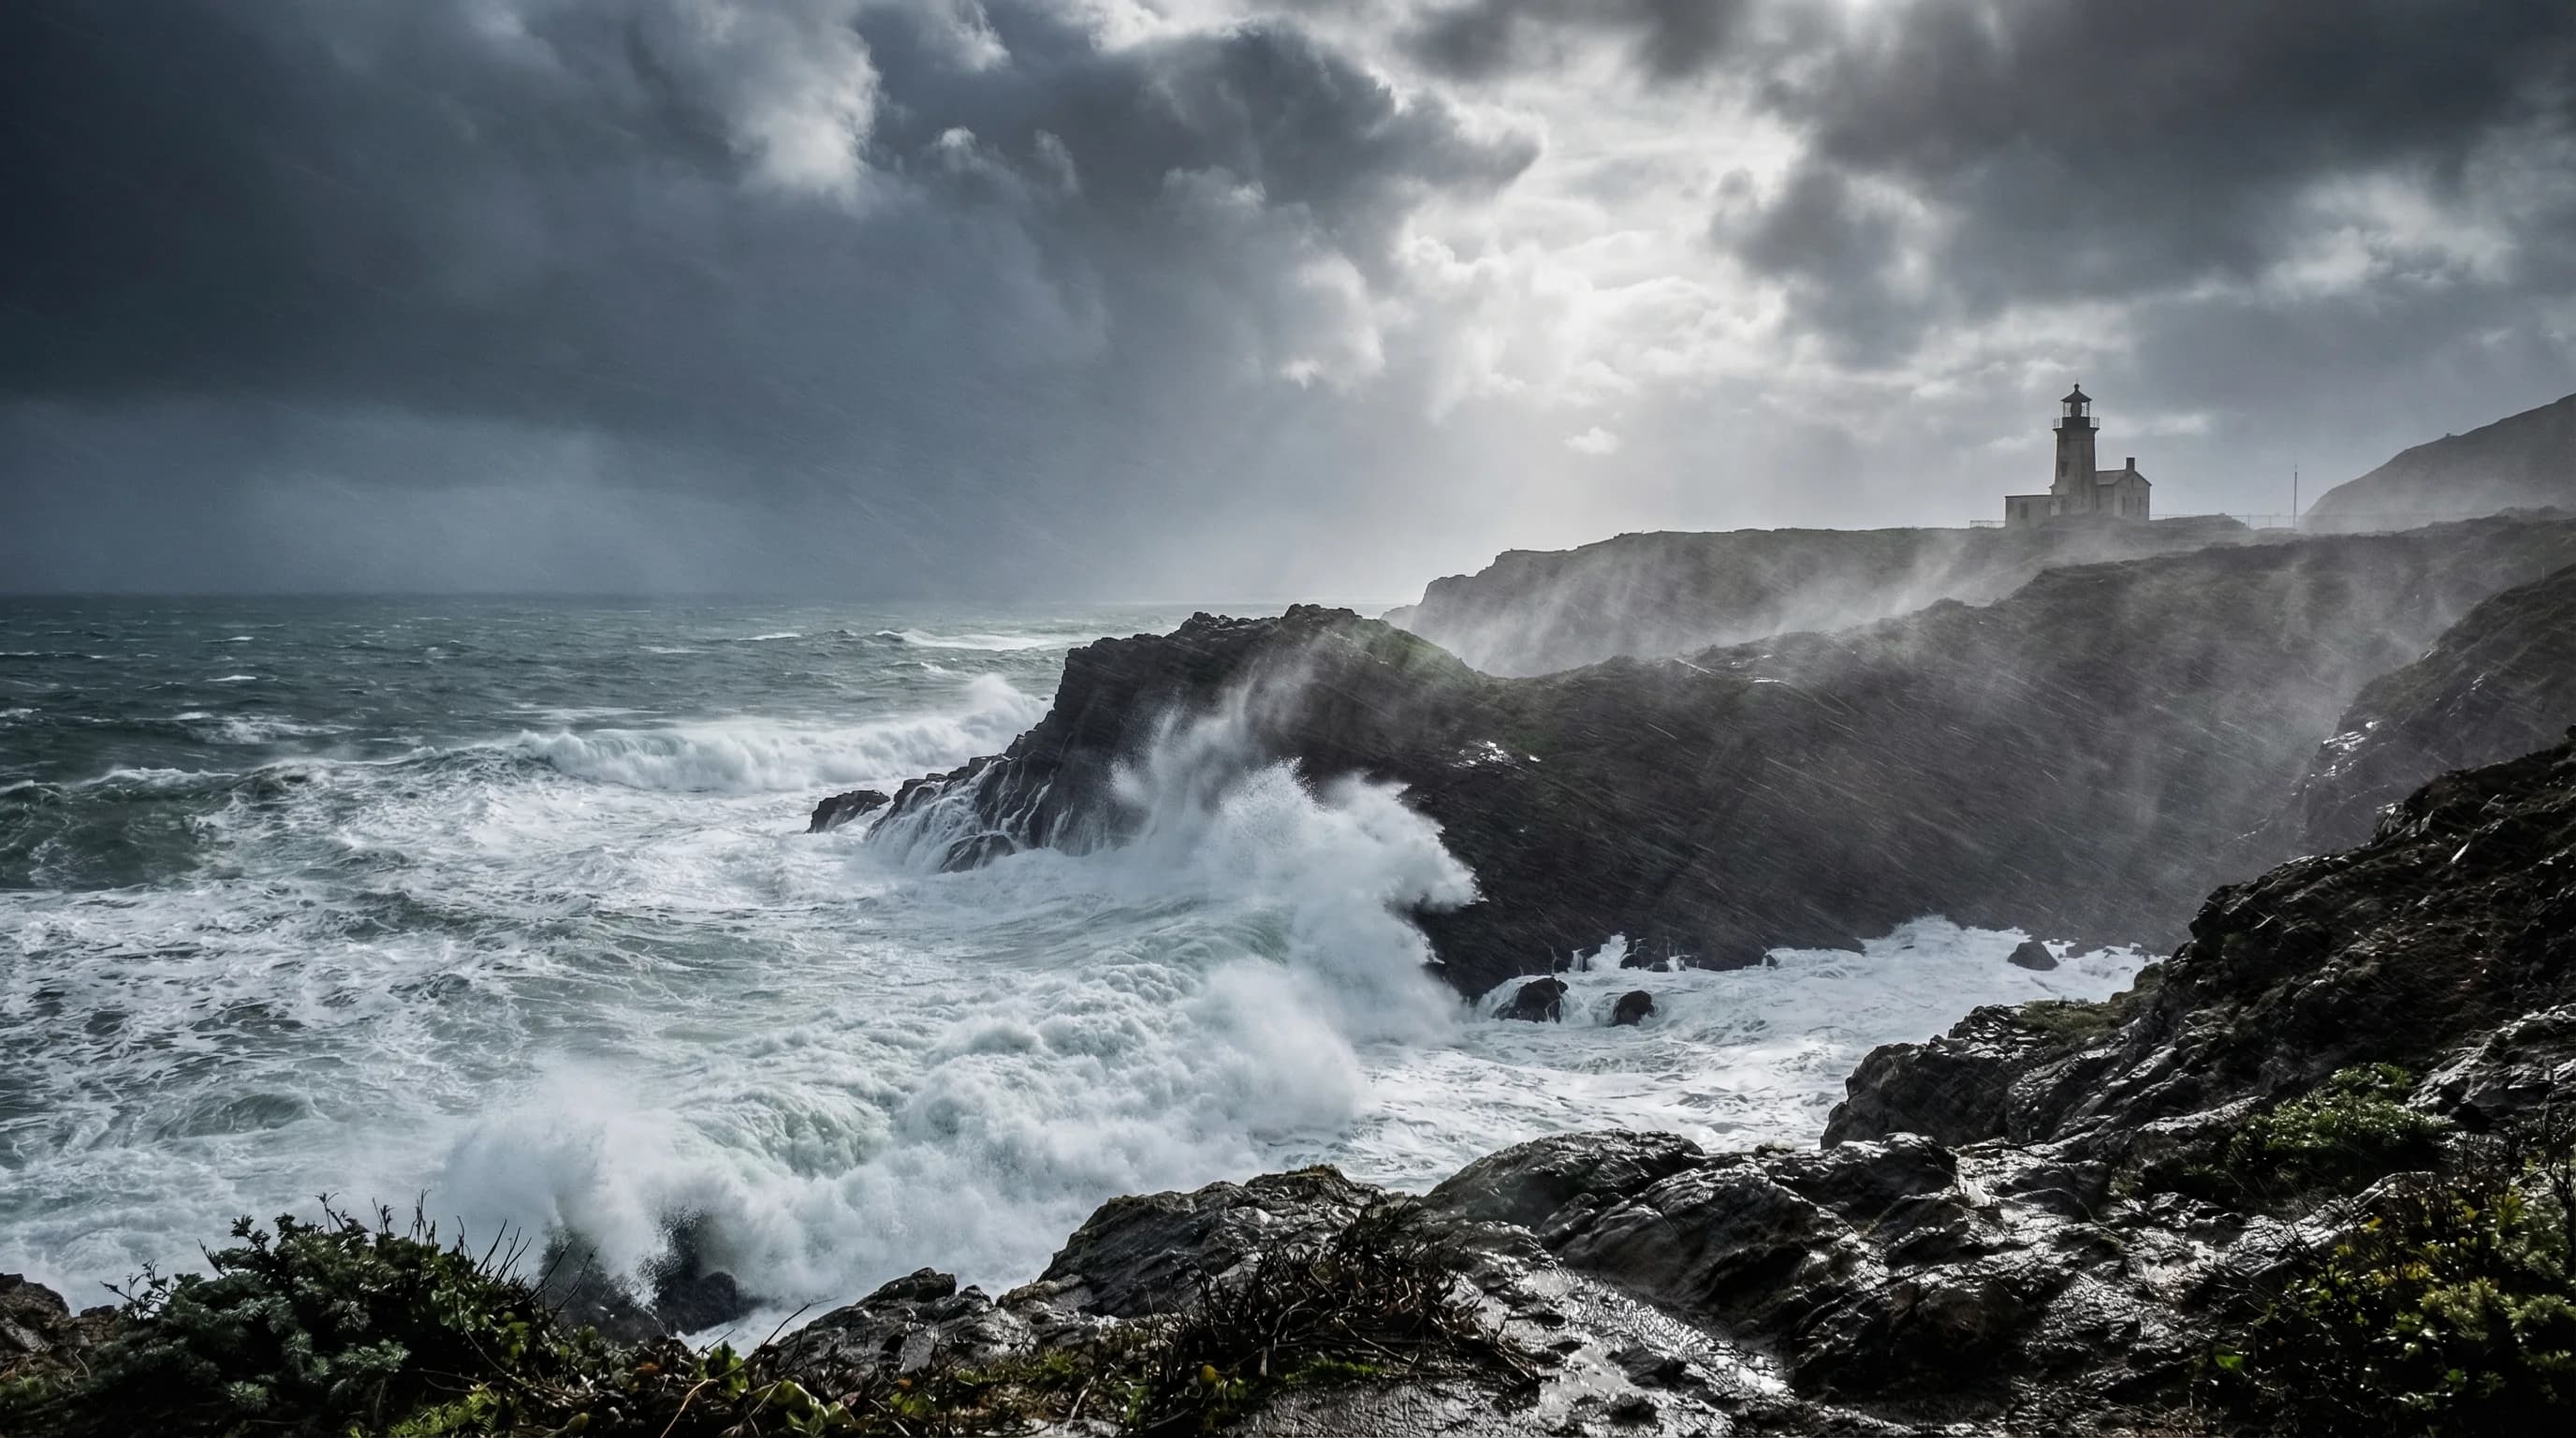
The Bay Area's entire annual rainfall arrives in five winter months via Pacific storms and atmospheric rivers. El Nino and La Nina determine whether the year is a flood year or a drought year.
7min read →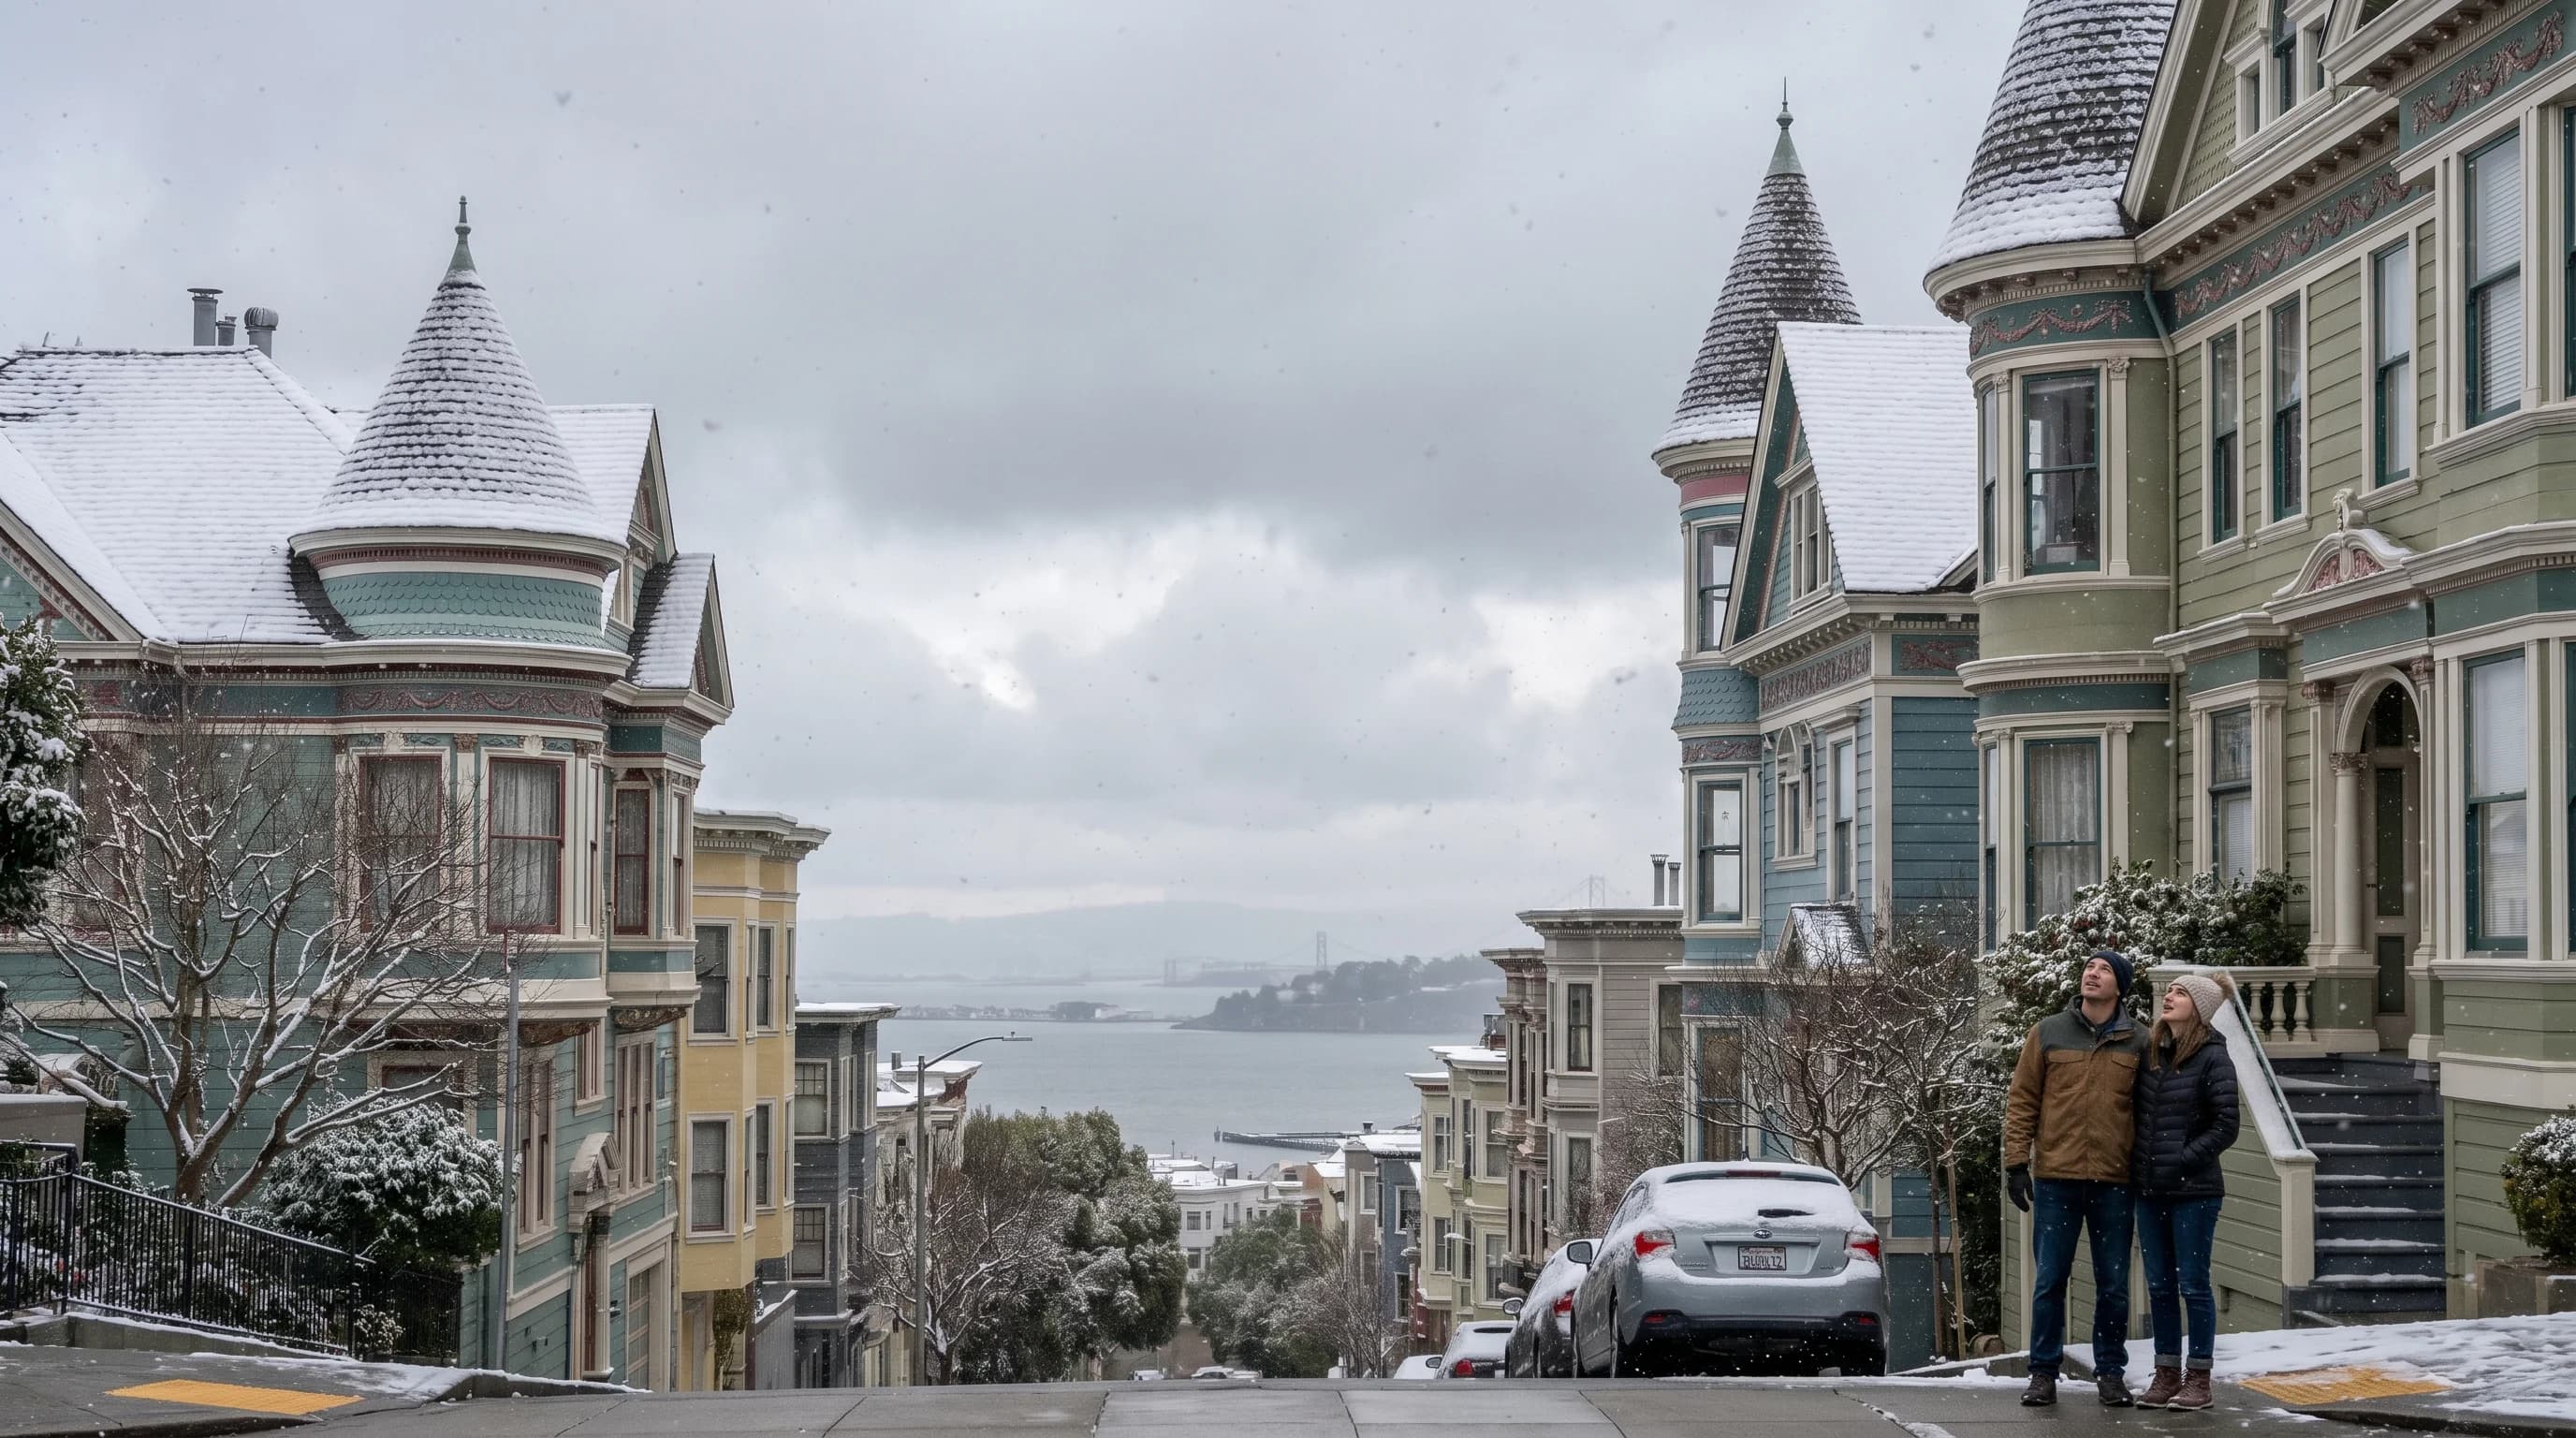
San Francisco does not snow in any practical sense. The oceanic influence keeps winter lows around 46°F, far too warm for snow. The last notable snowfall was 1976.
6min read →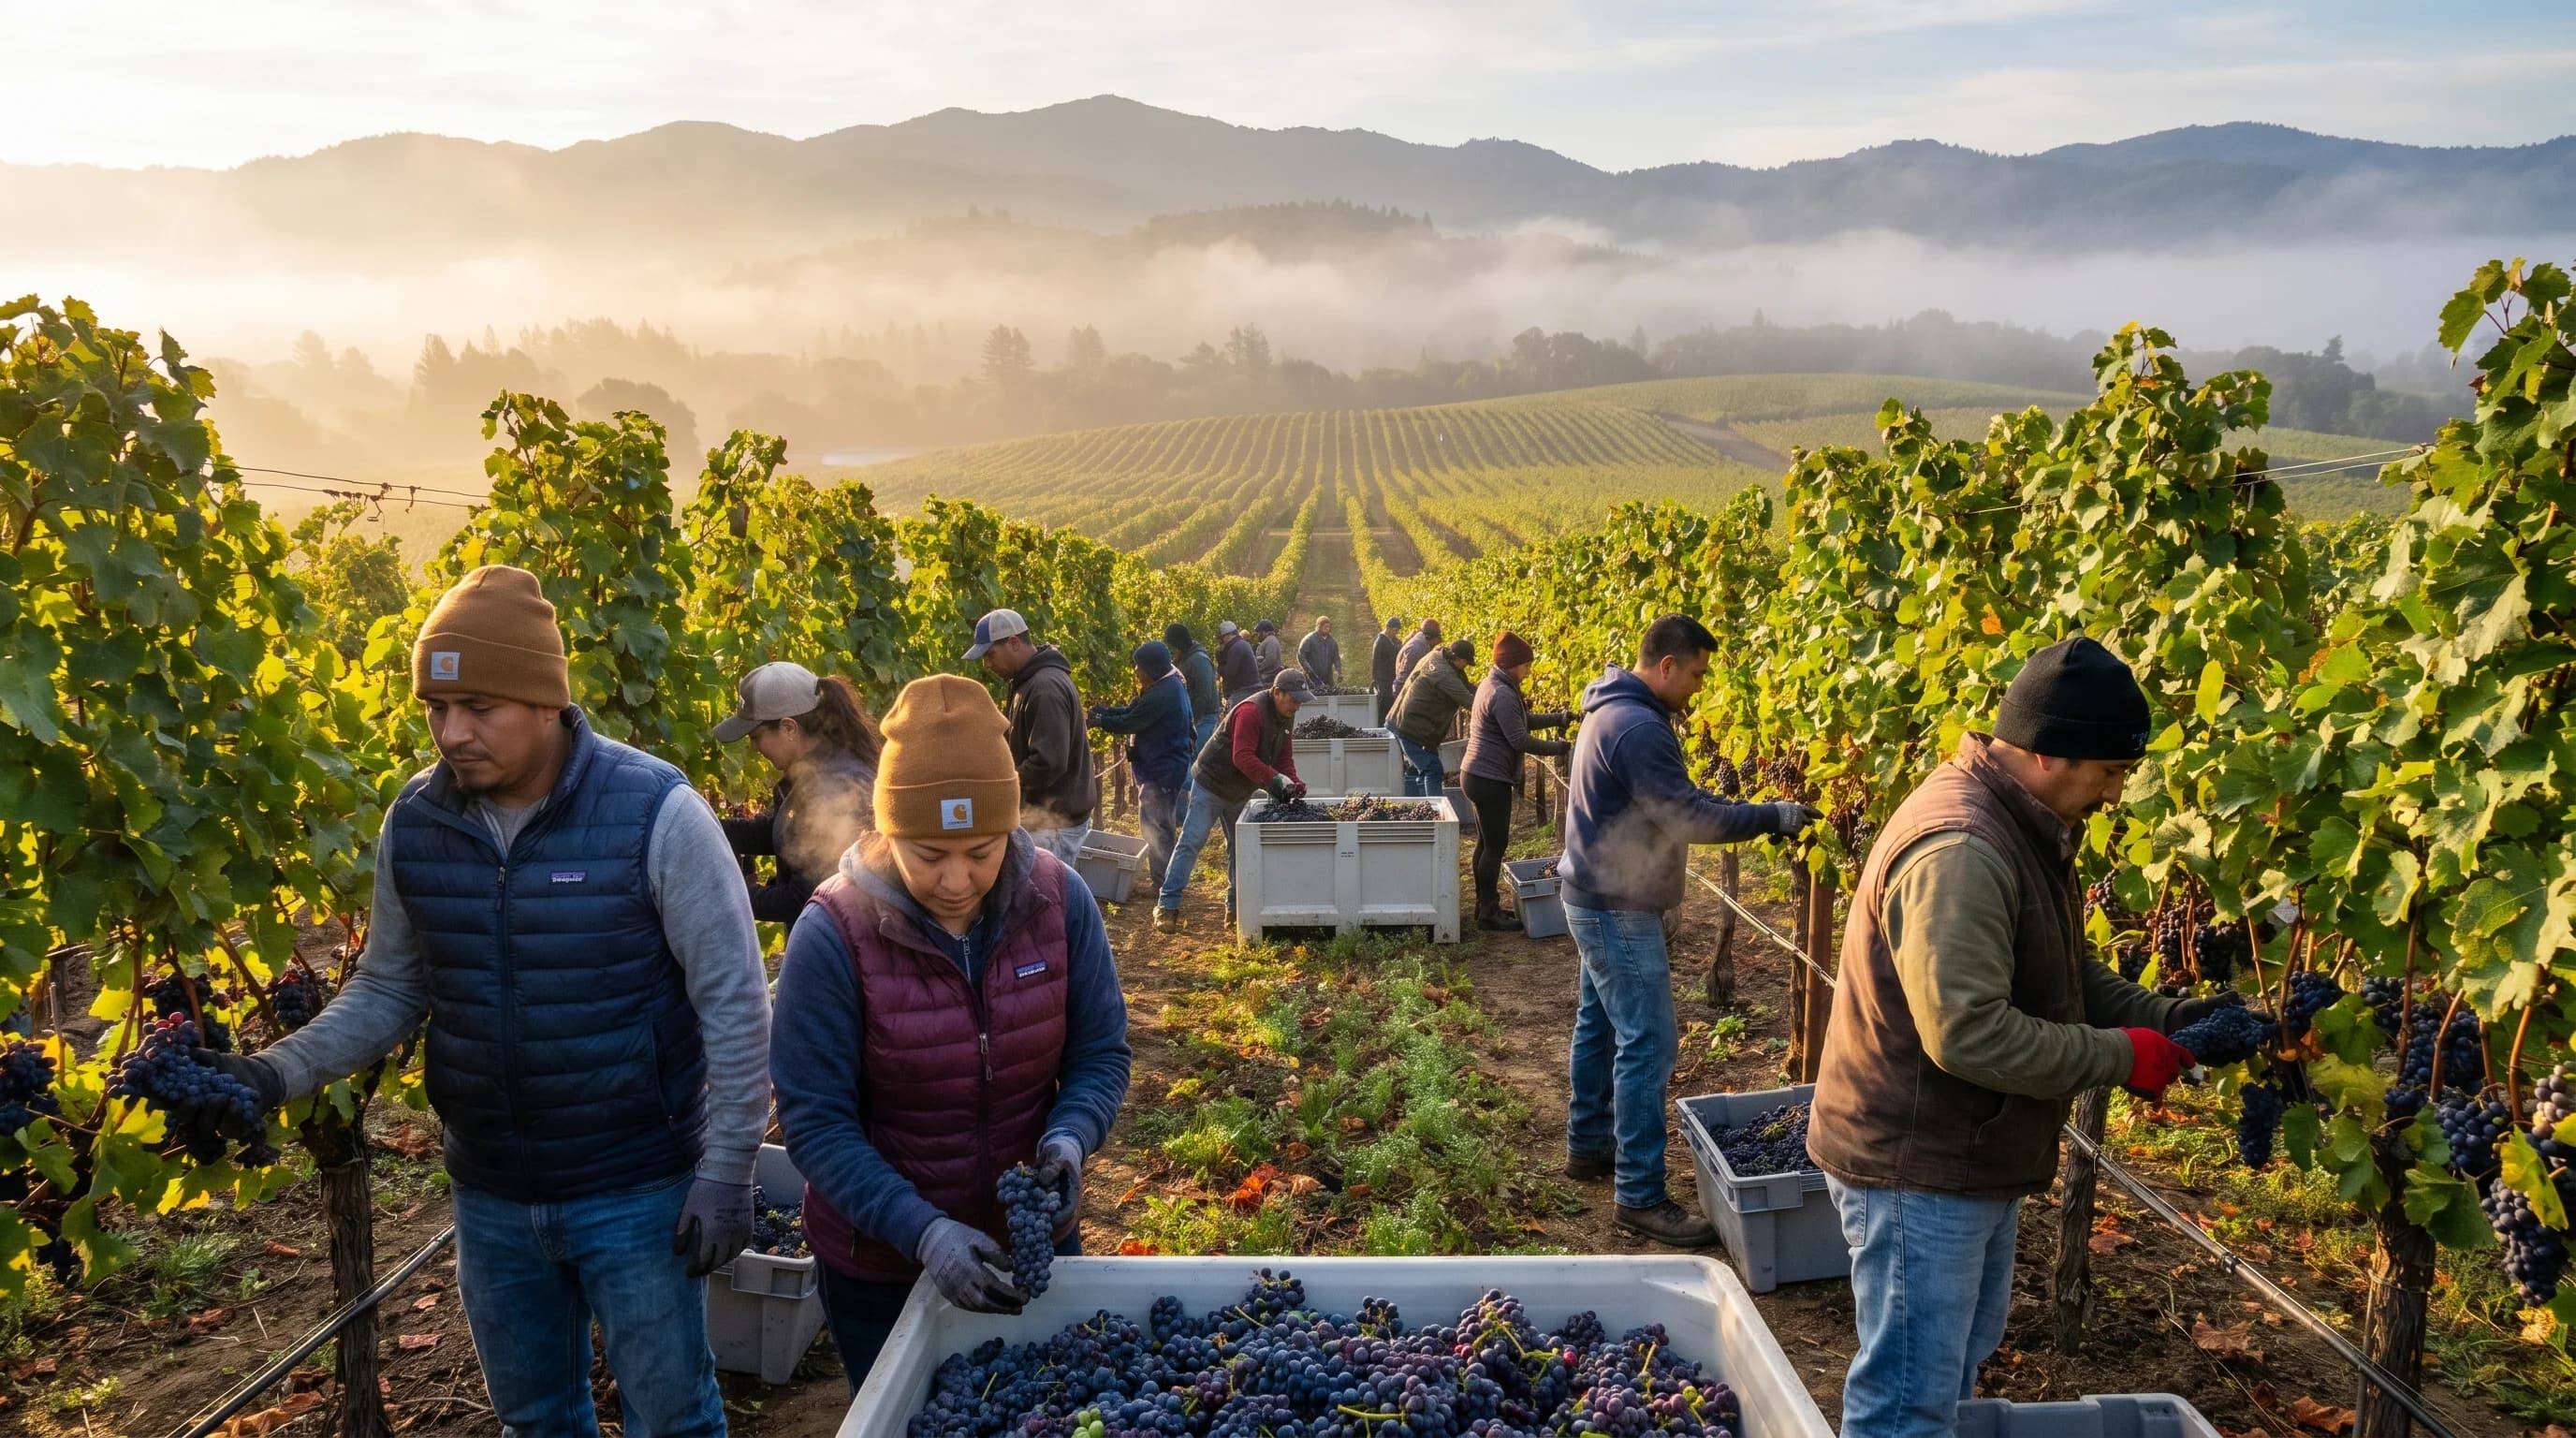
Wine country harvest season runs from late August through mid-November, with September averaging 88°F and virtually no rain. October is the best month to visit for weather and harvest activity.
6min read →Category
Record-breaking storms, heat waves, floods, and snow events that define Bay Area weather history.
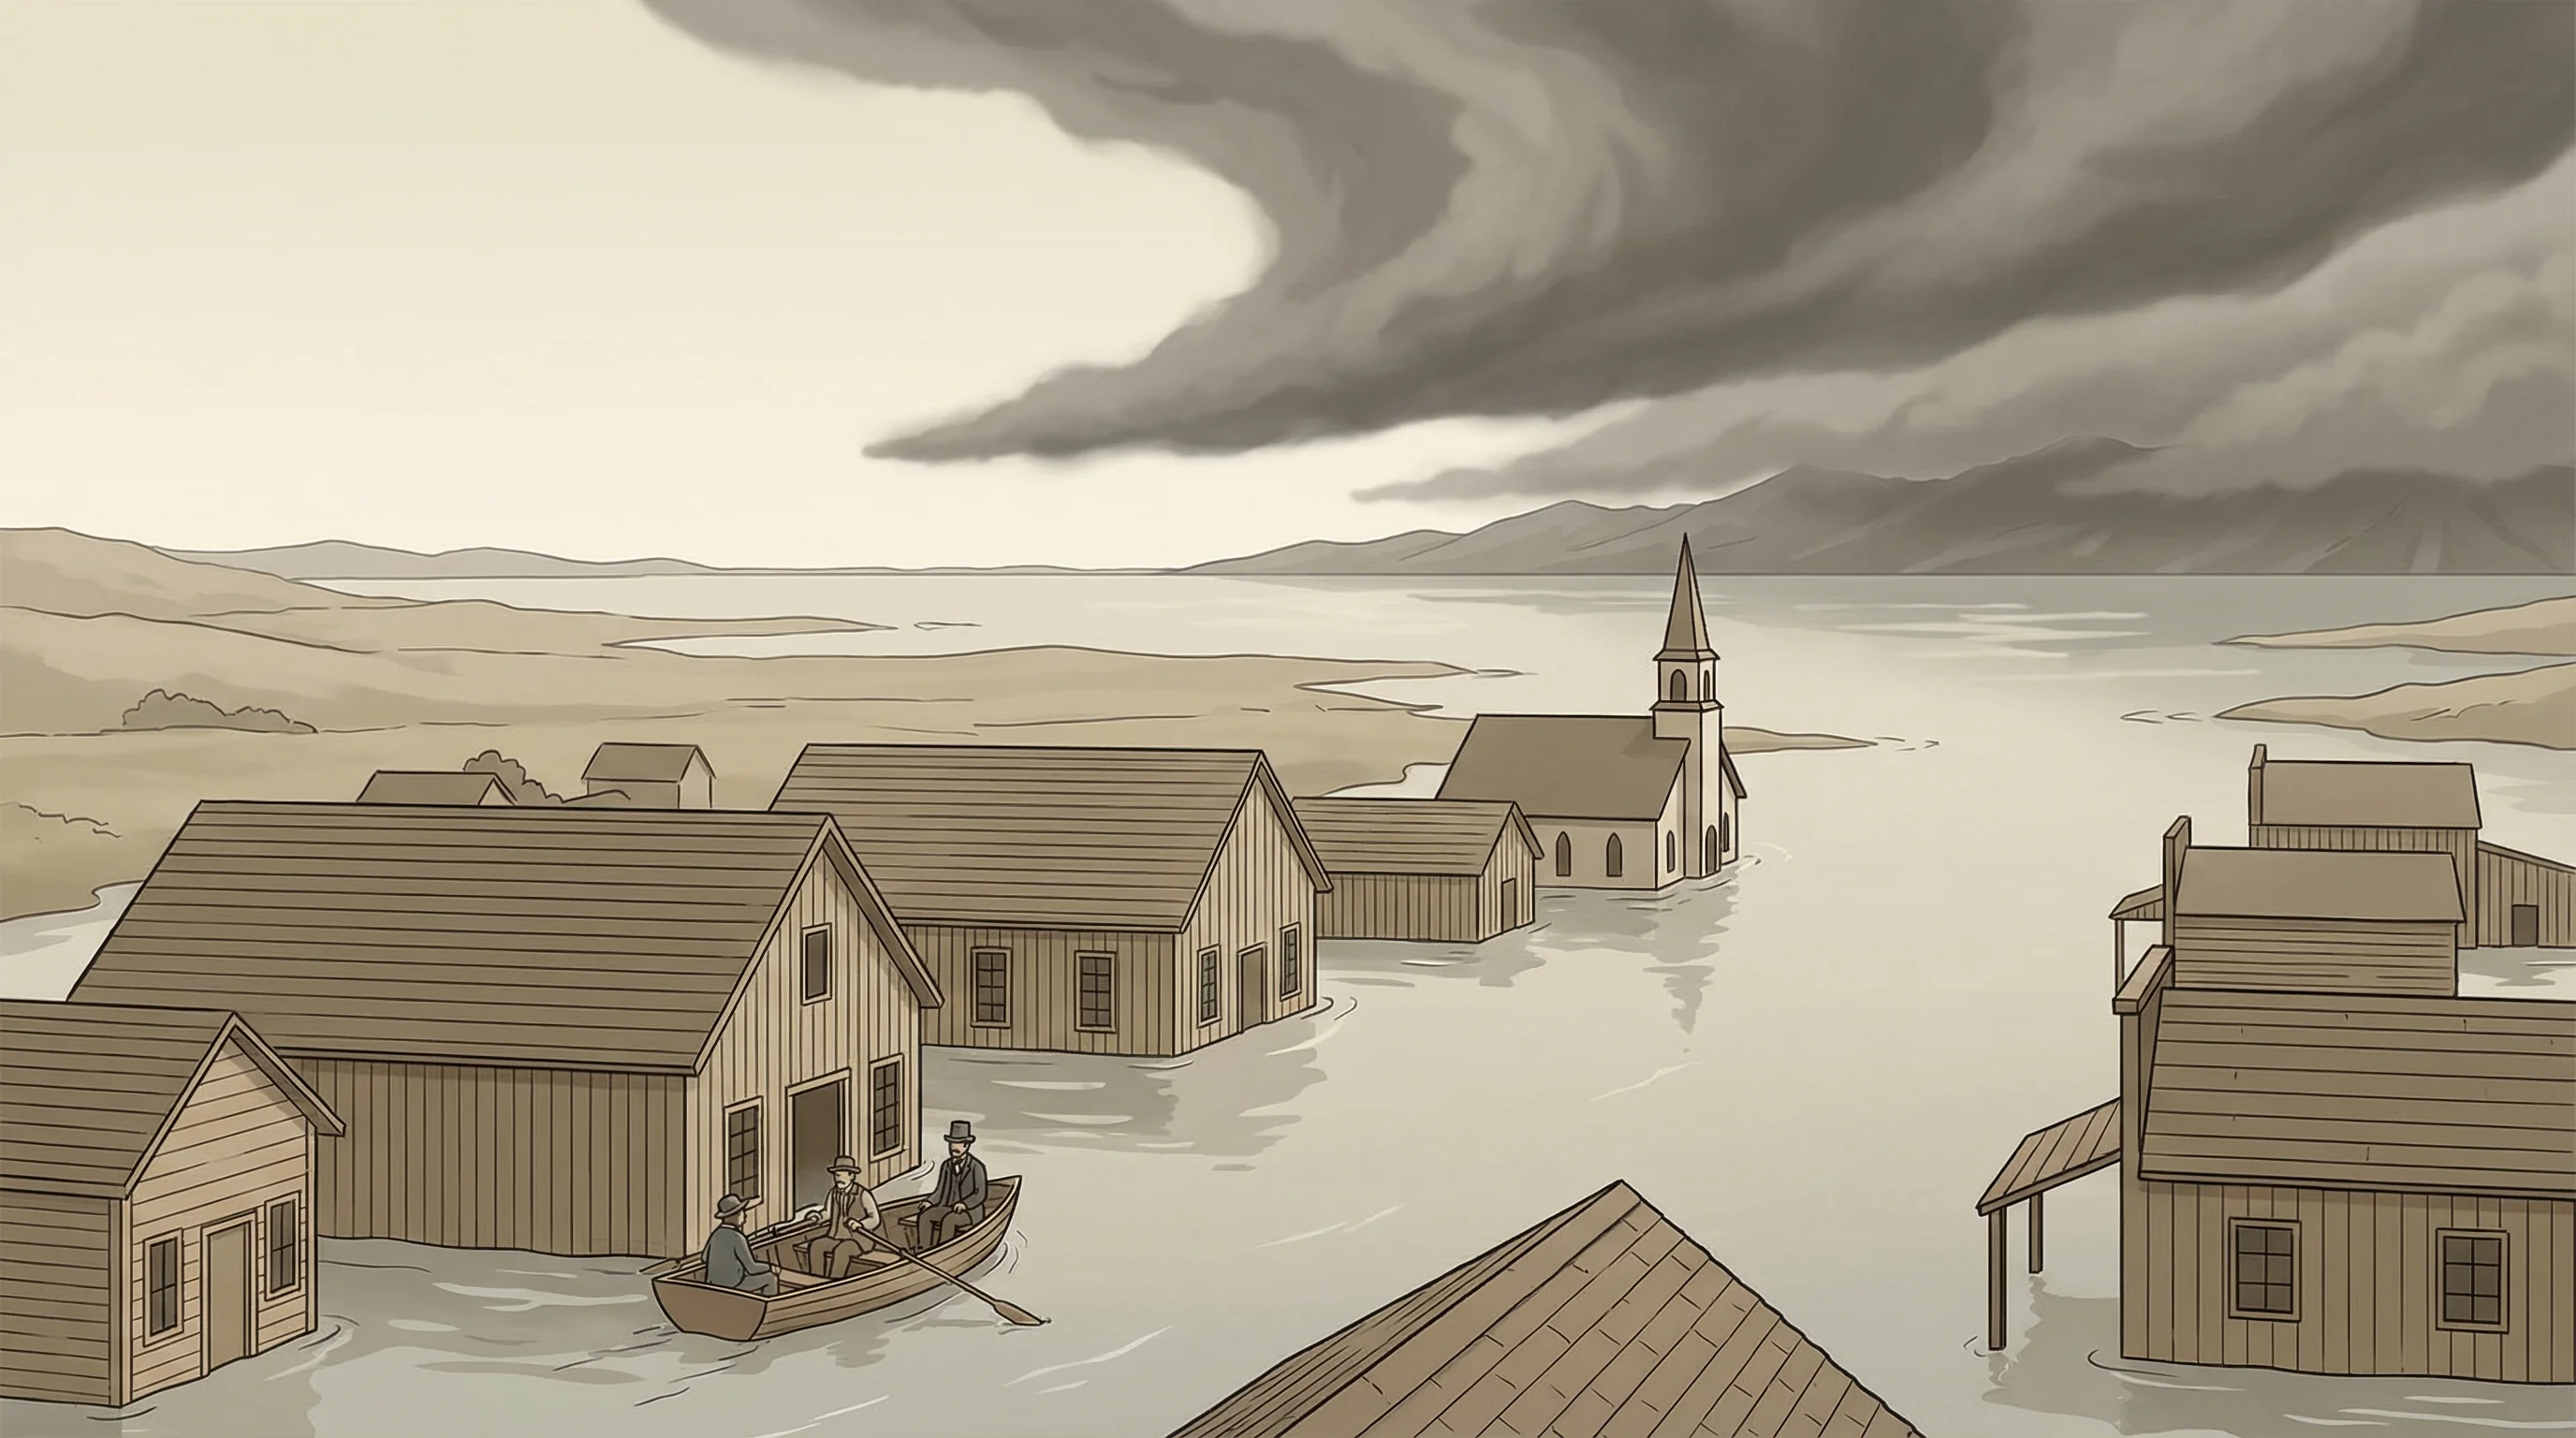
The winter of 1861-62 brought a series of atmospheric rivers that turned California's Central Valley into an inland sea and submerged Bay Area lowlands for weeks. The Great Flood remains the benchmark for catastrophic California flooding.
6min read →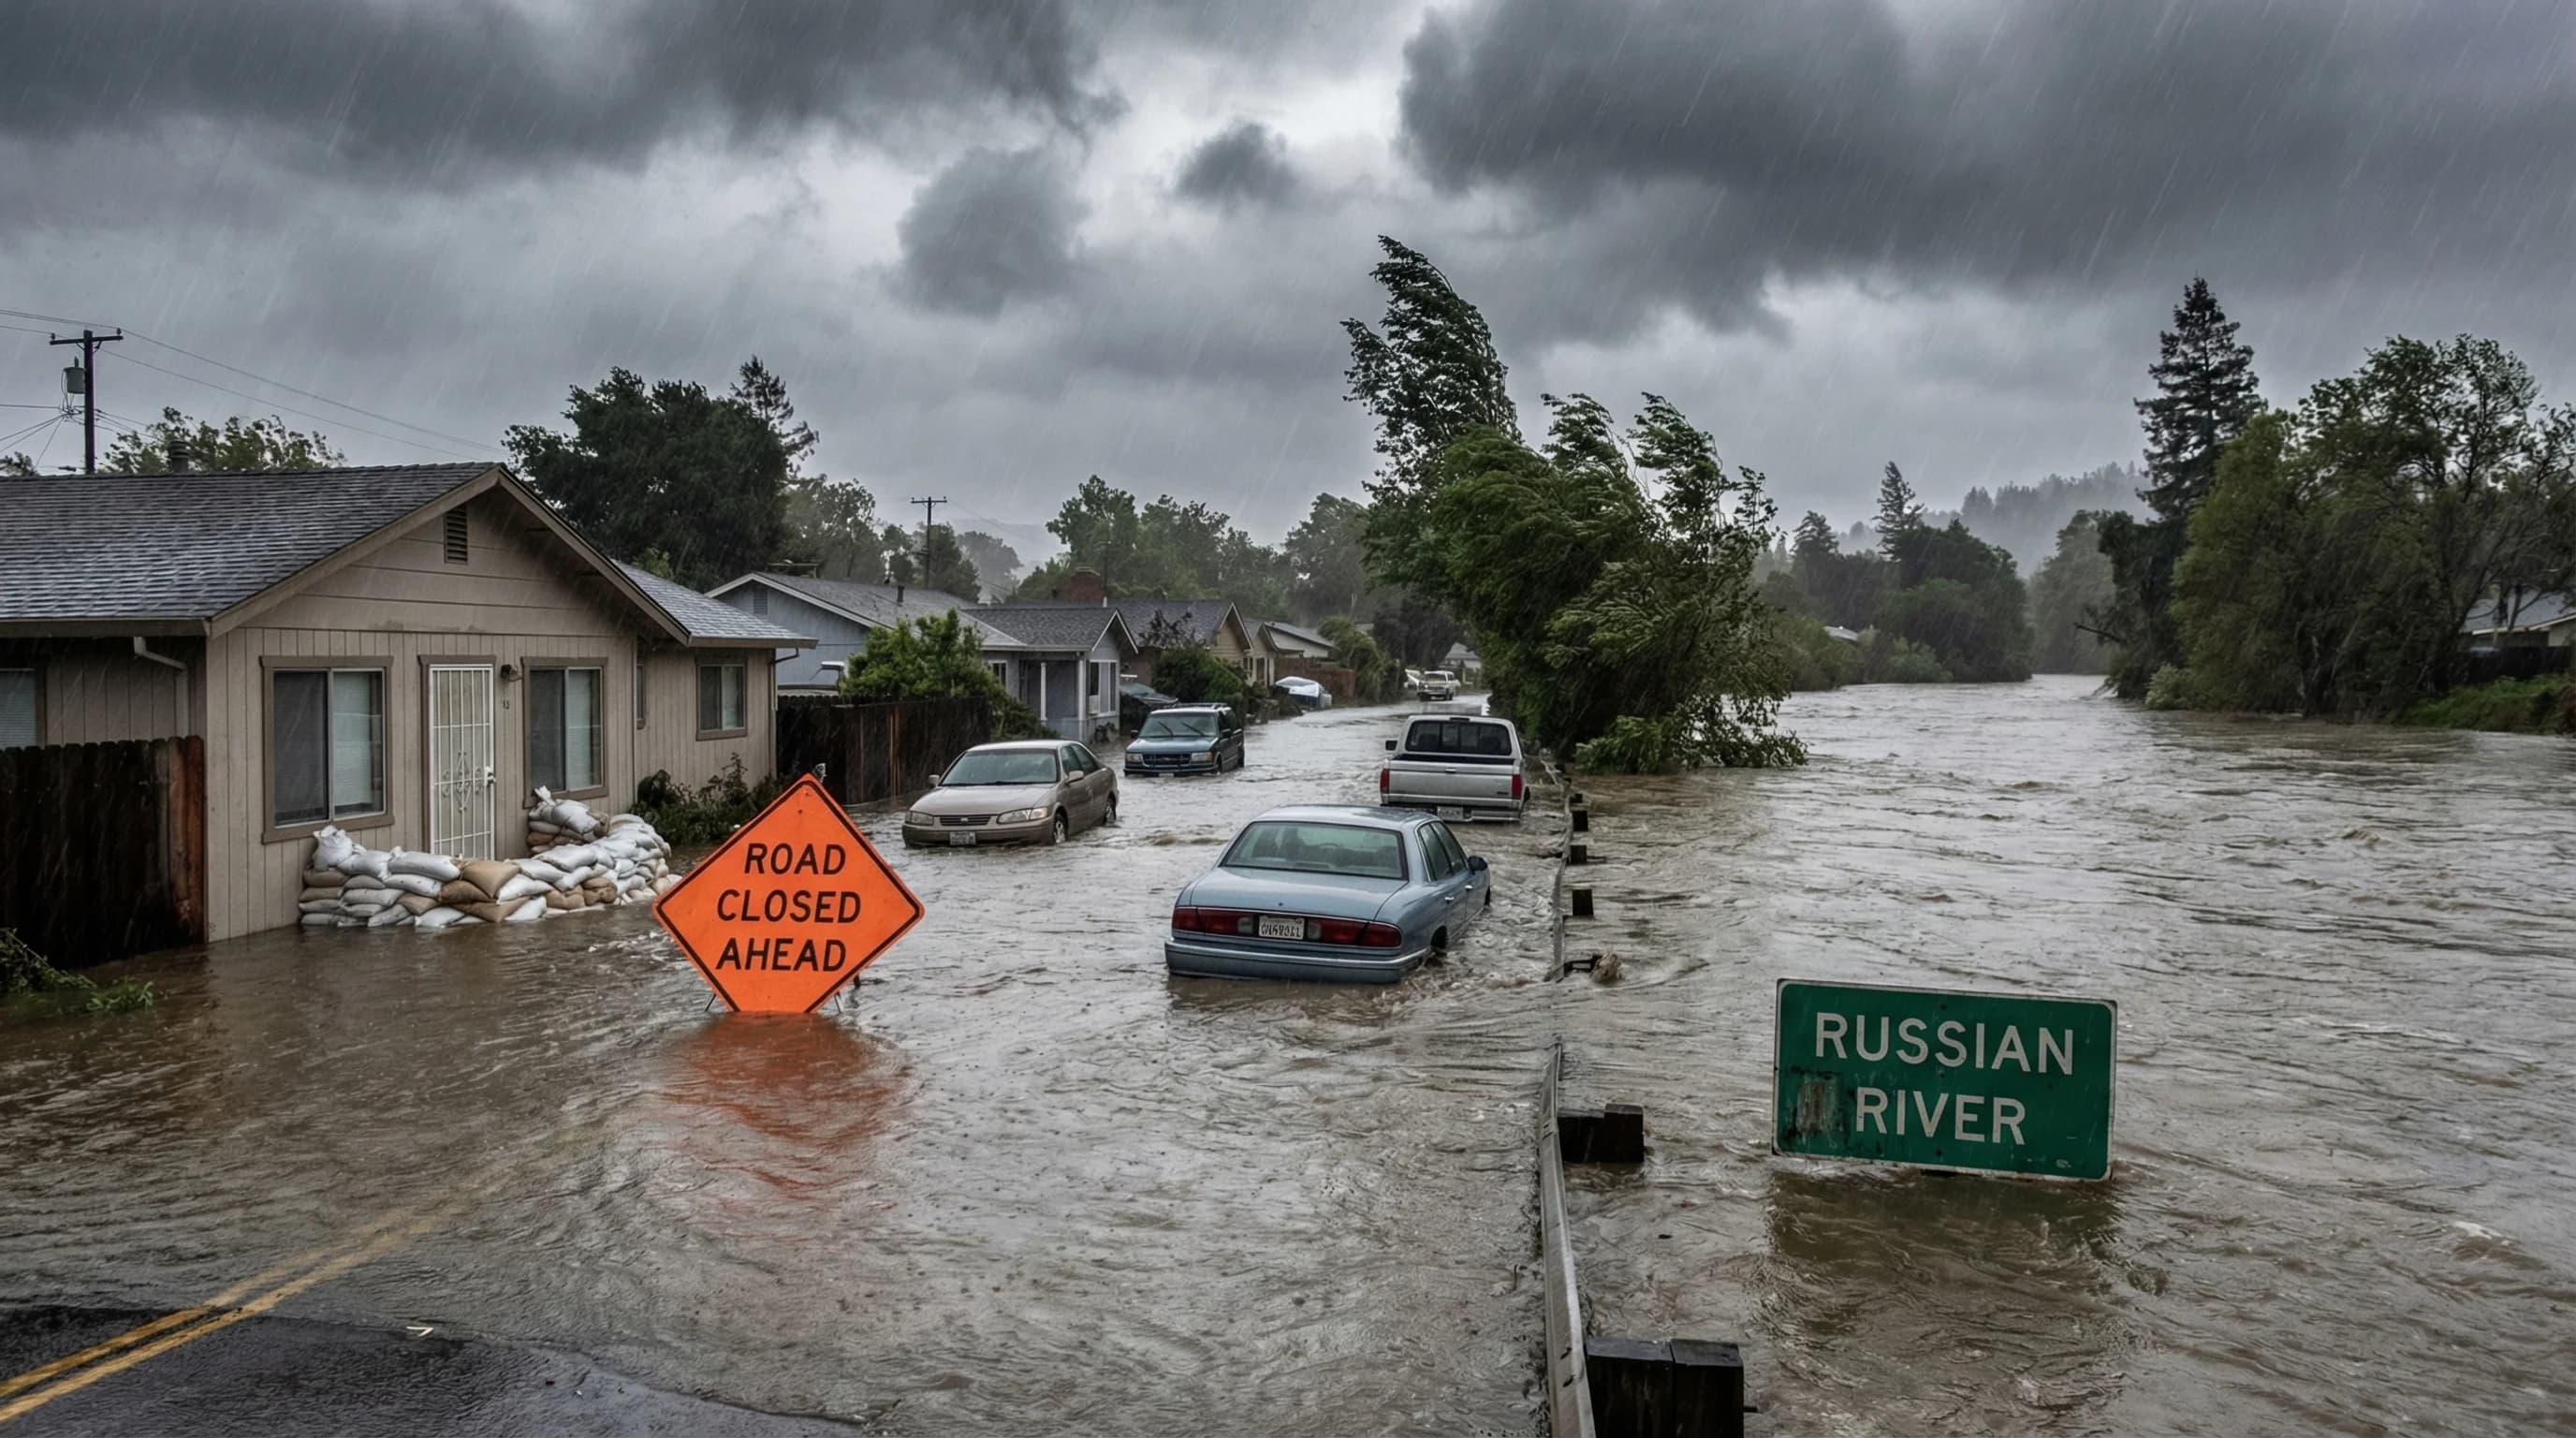
The 1997-98 El Niño, the strongest on record, delivered the Bay Area's most intense storm sequence in modern history. The Russian River hit record levels, hillsides failed throughout the region, and damage ran into the billions.
6min read →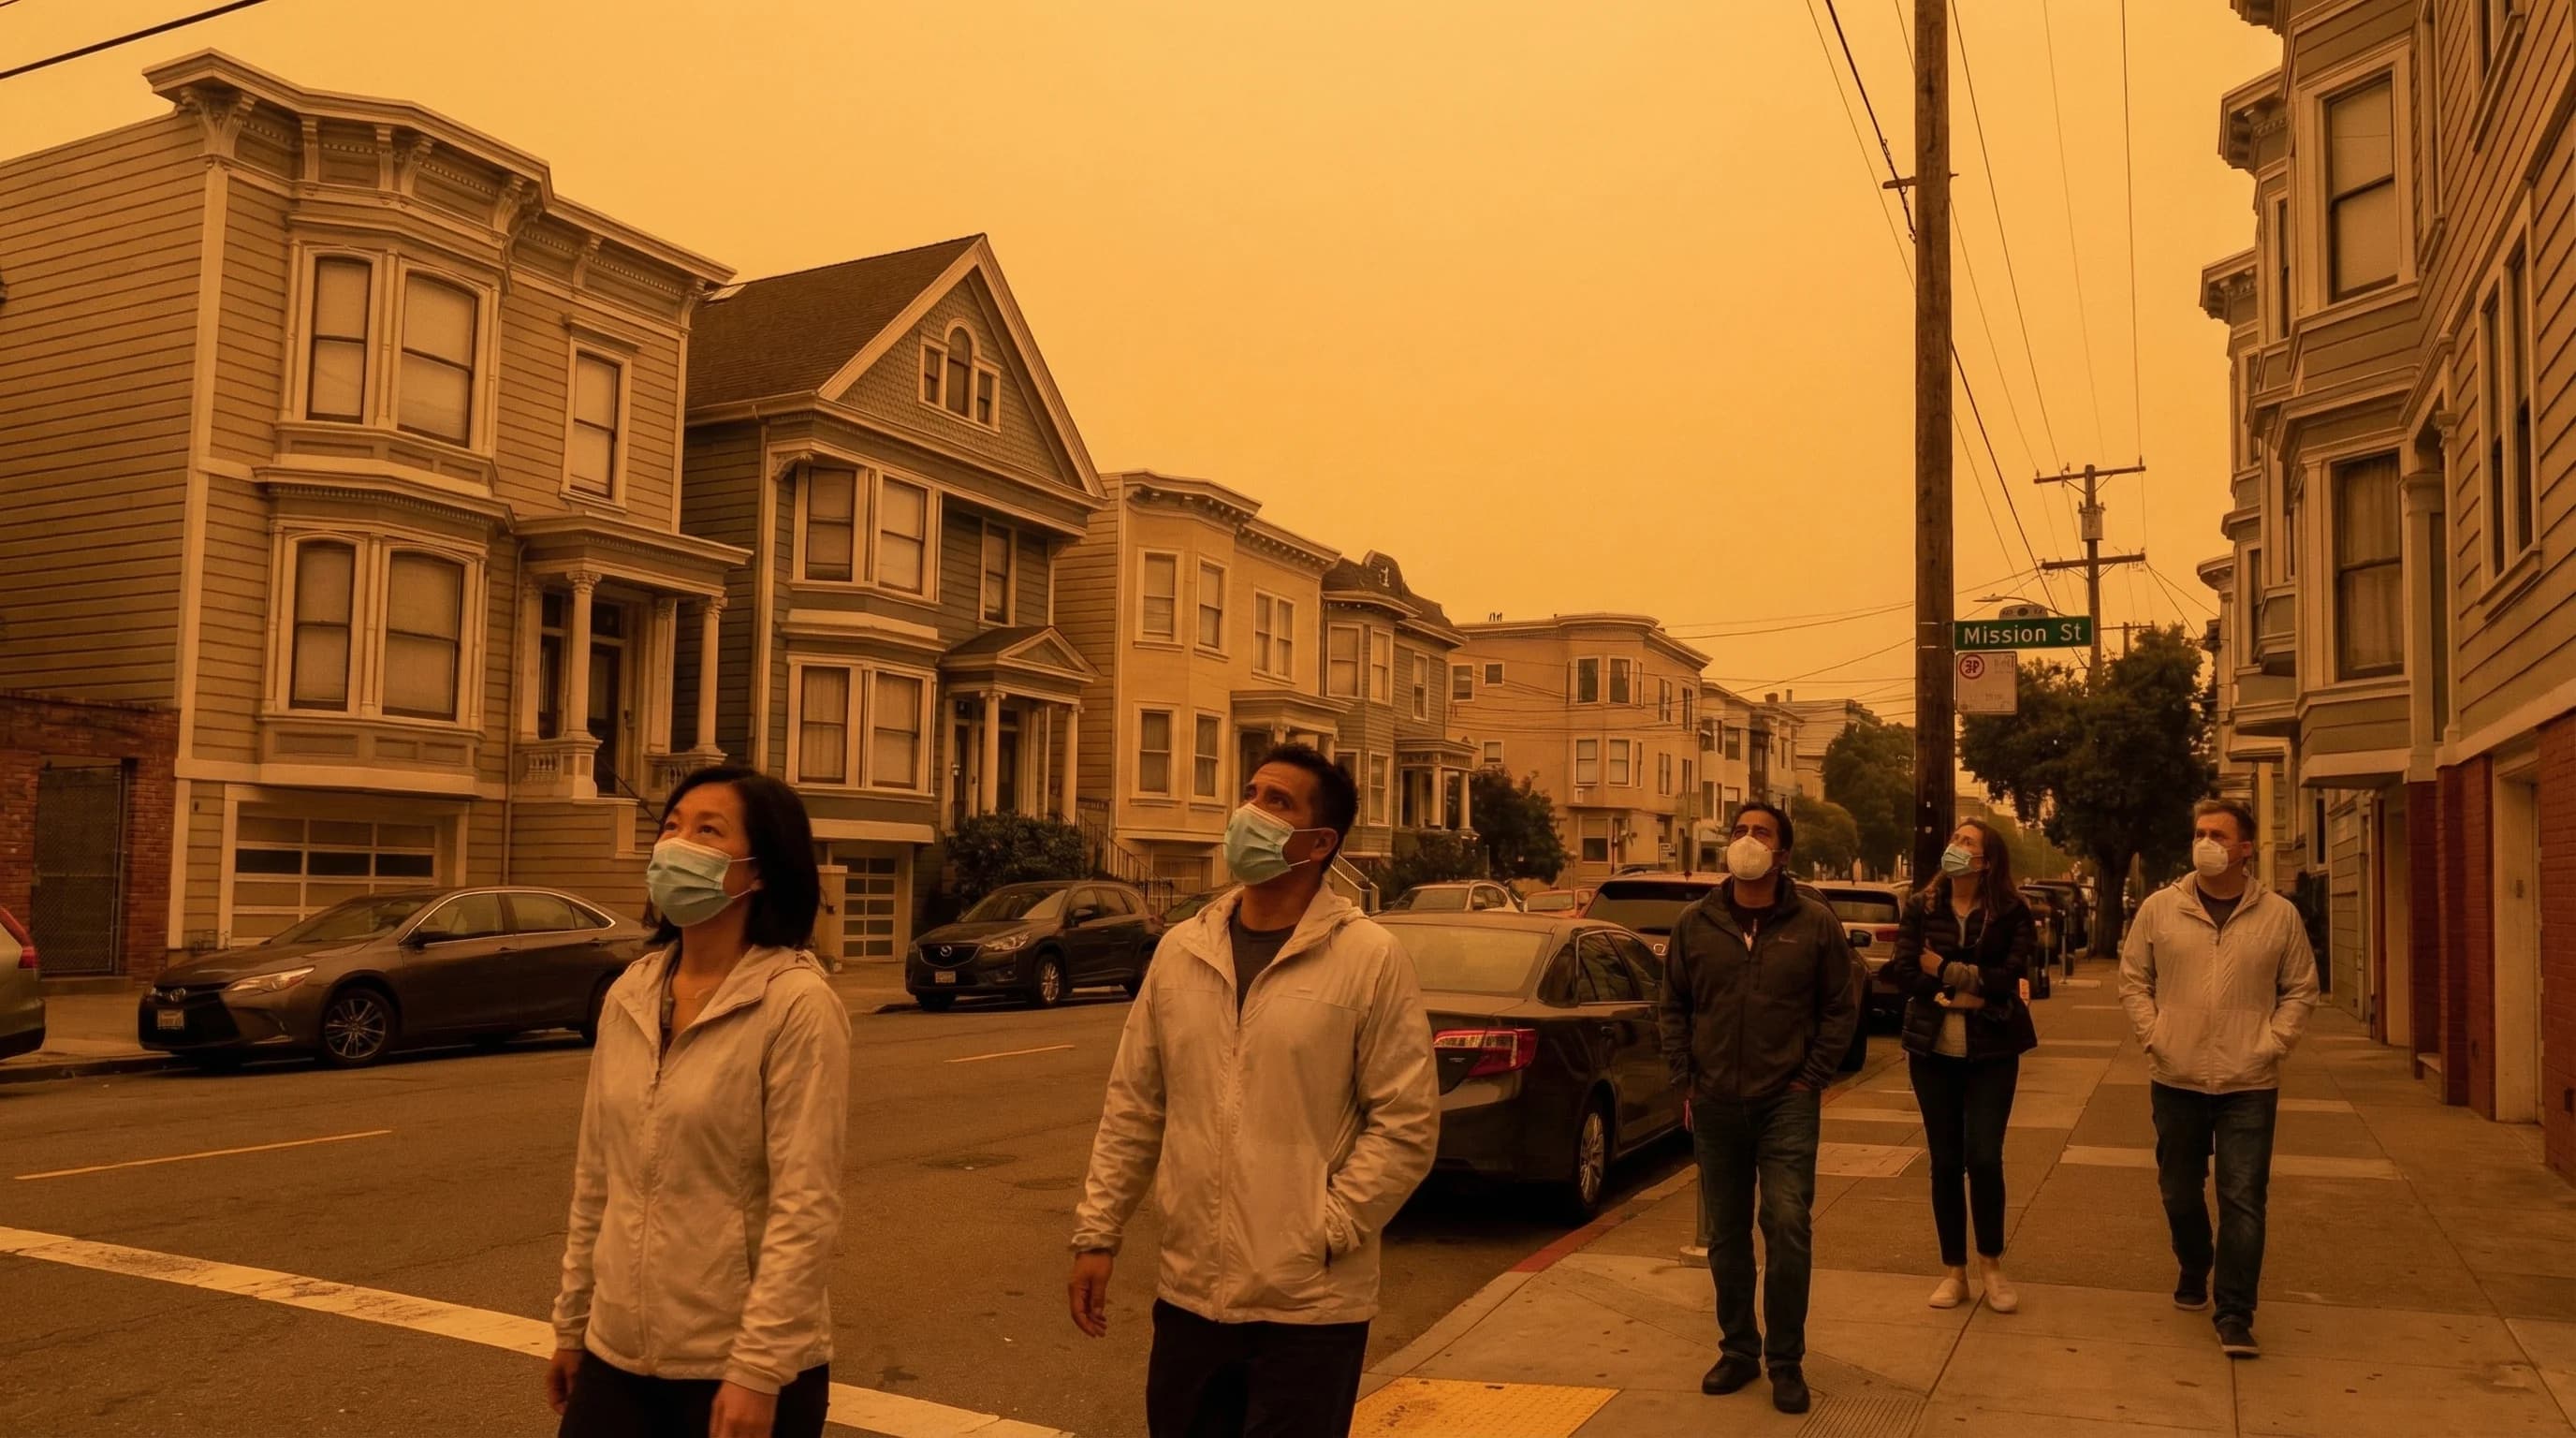
The August 2020 heat dome was the Bay Area's most extreme compound weather event in modern history: record temperatures, 560 simultaneous lightning-sparked fires, orange skies from smoke, and rolling blackouts, all at once.
6min read →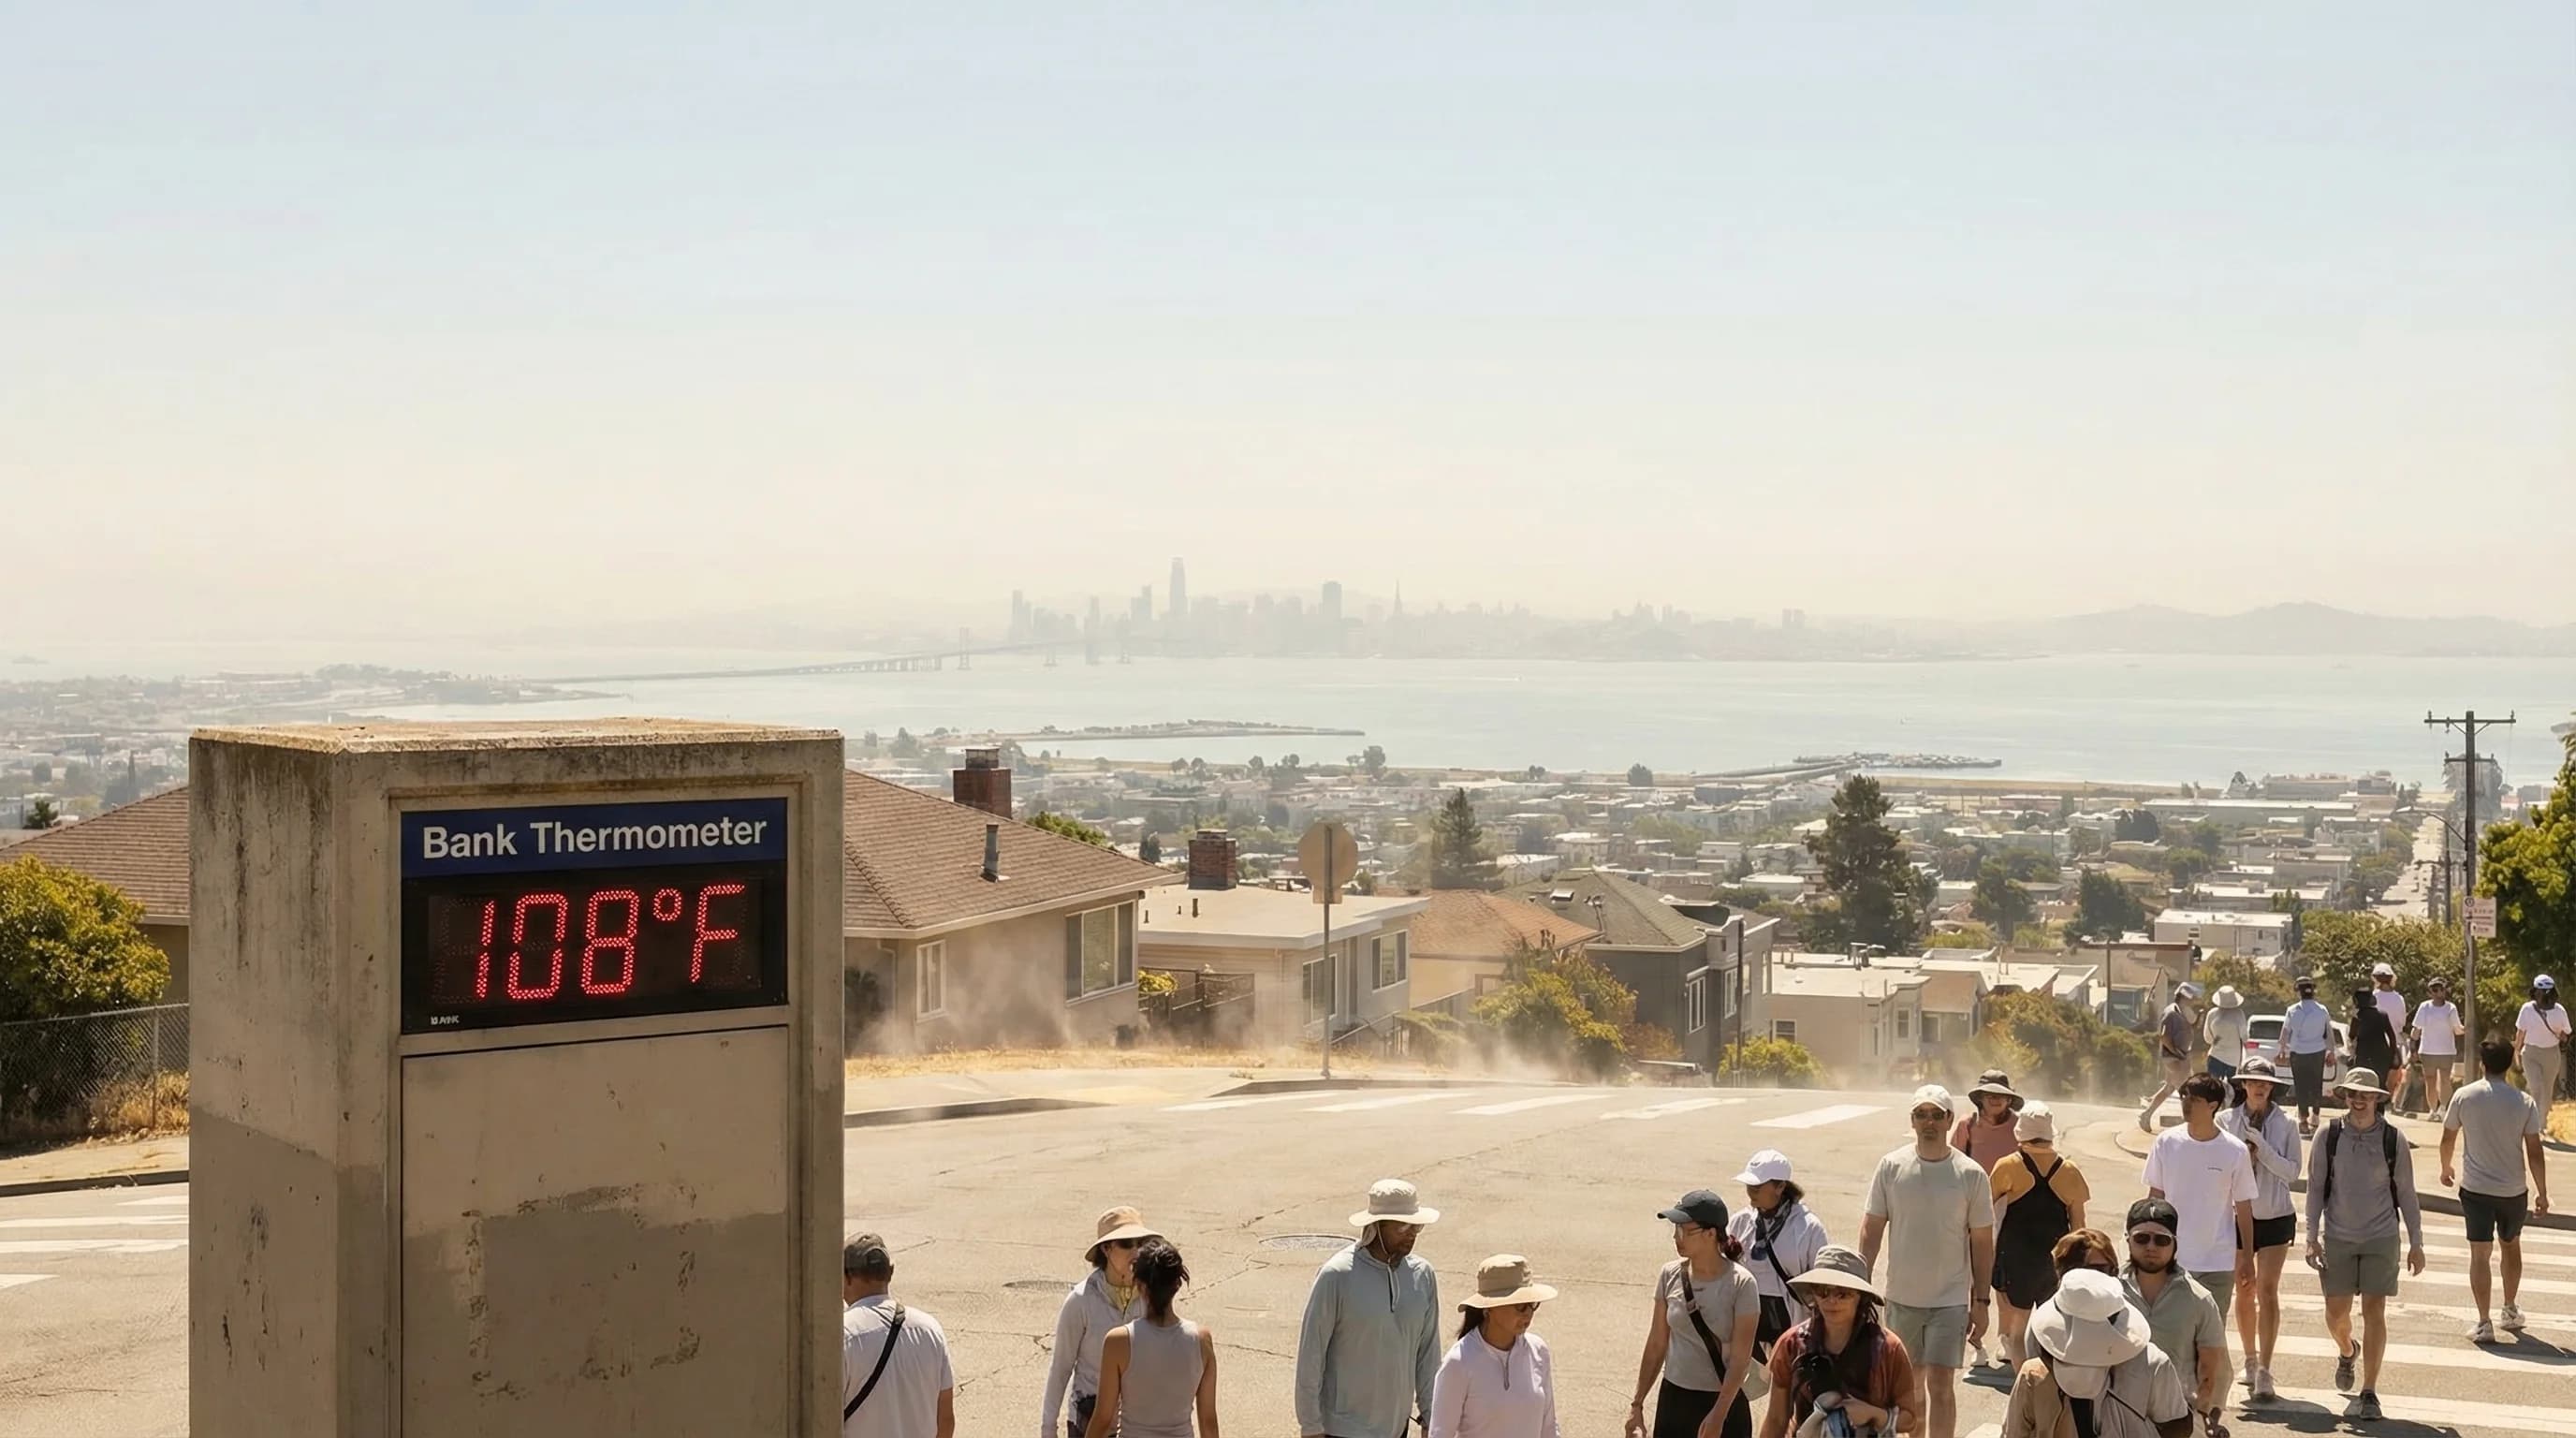
San Francisco has officially hit 107°F and inland East Bay cities have reached 115°F+ during heat dome events. These records reveal what happens when the marine layer completely fails, and they're becoming more frequent.
6min read →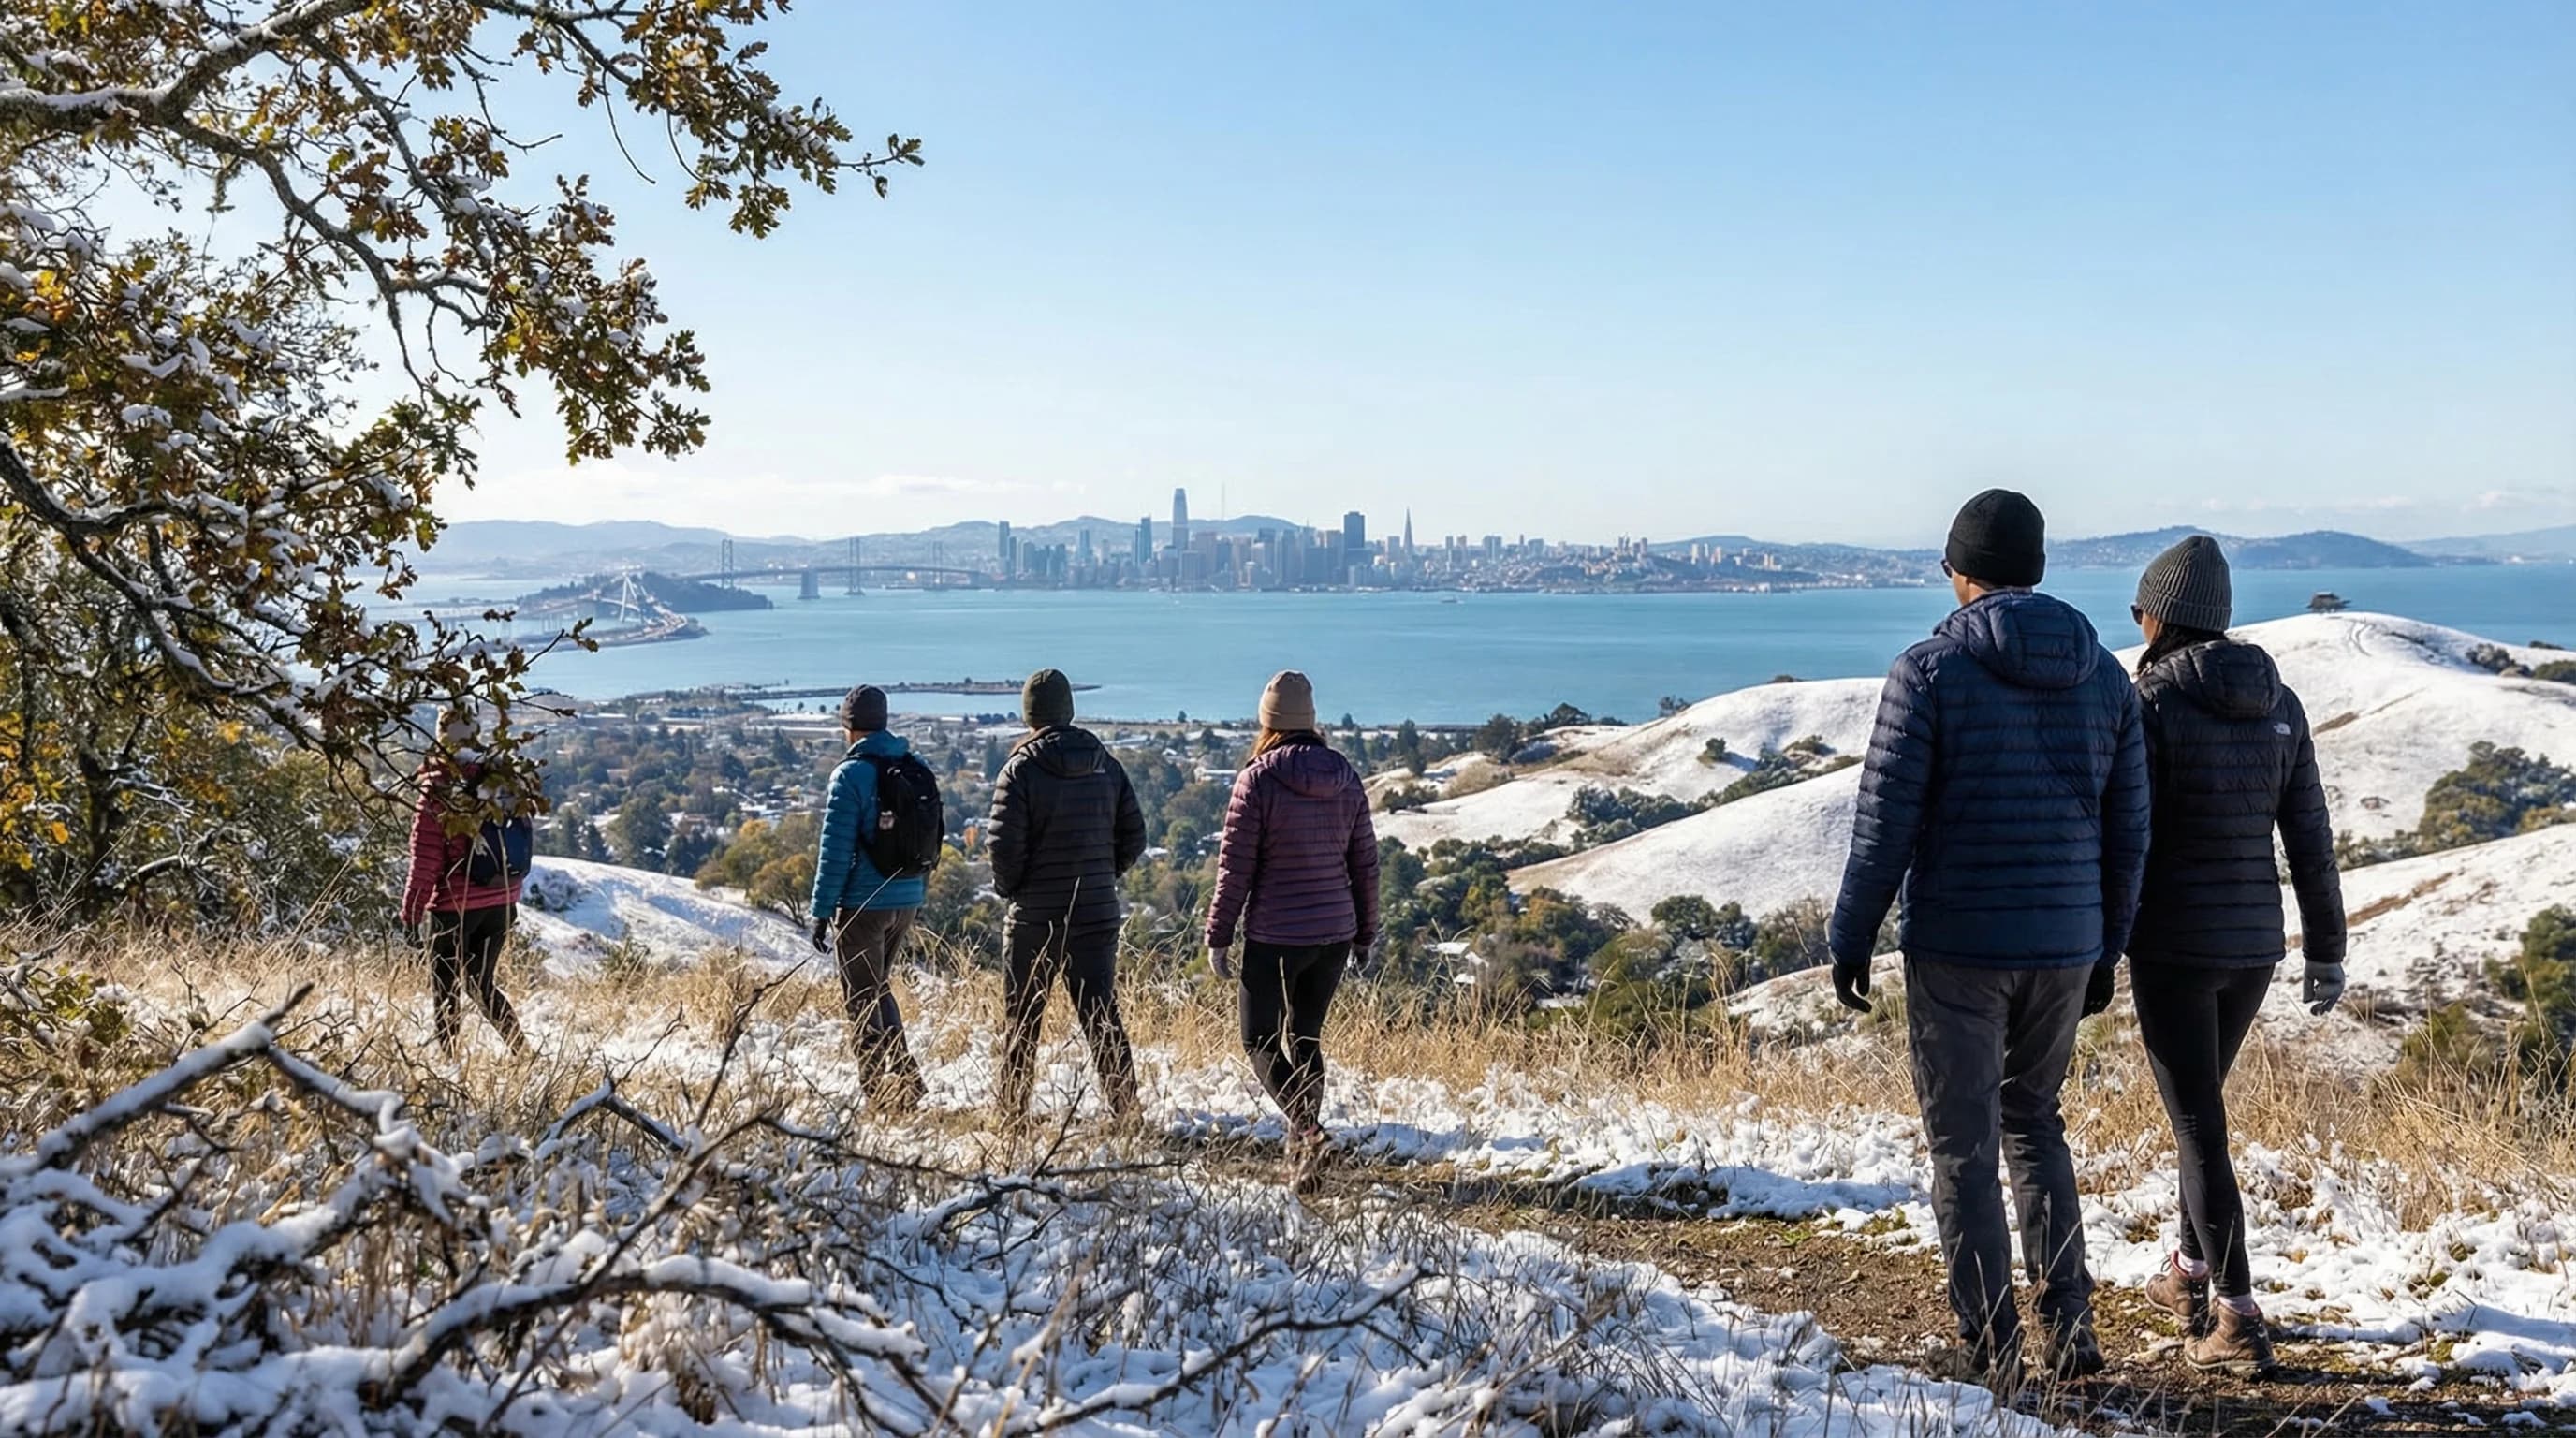
Snow is a generational event at Bay Area sea level, San Francisco last recorded measurable accumulation in 1976. Higher ridgelines above 1,500 feet see occasional dustings, and Mount Diablo at 3,849 feet is the region's most reliable snow location.
6min read →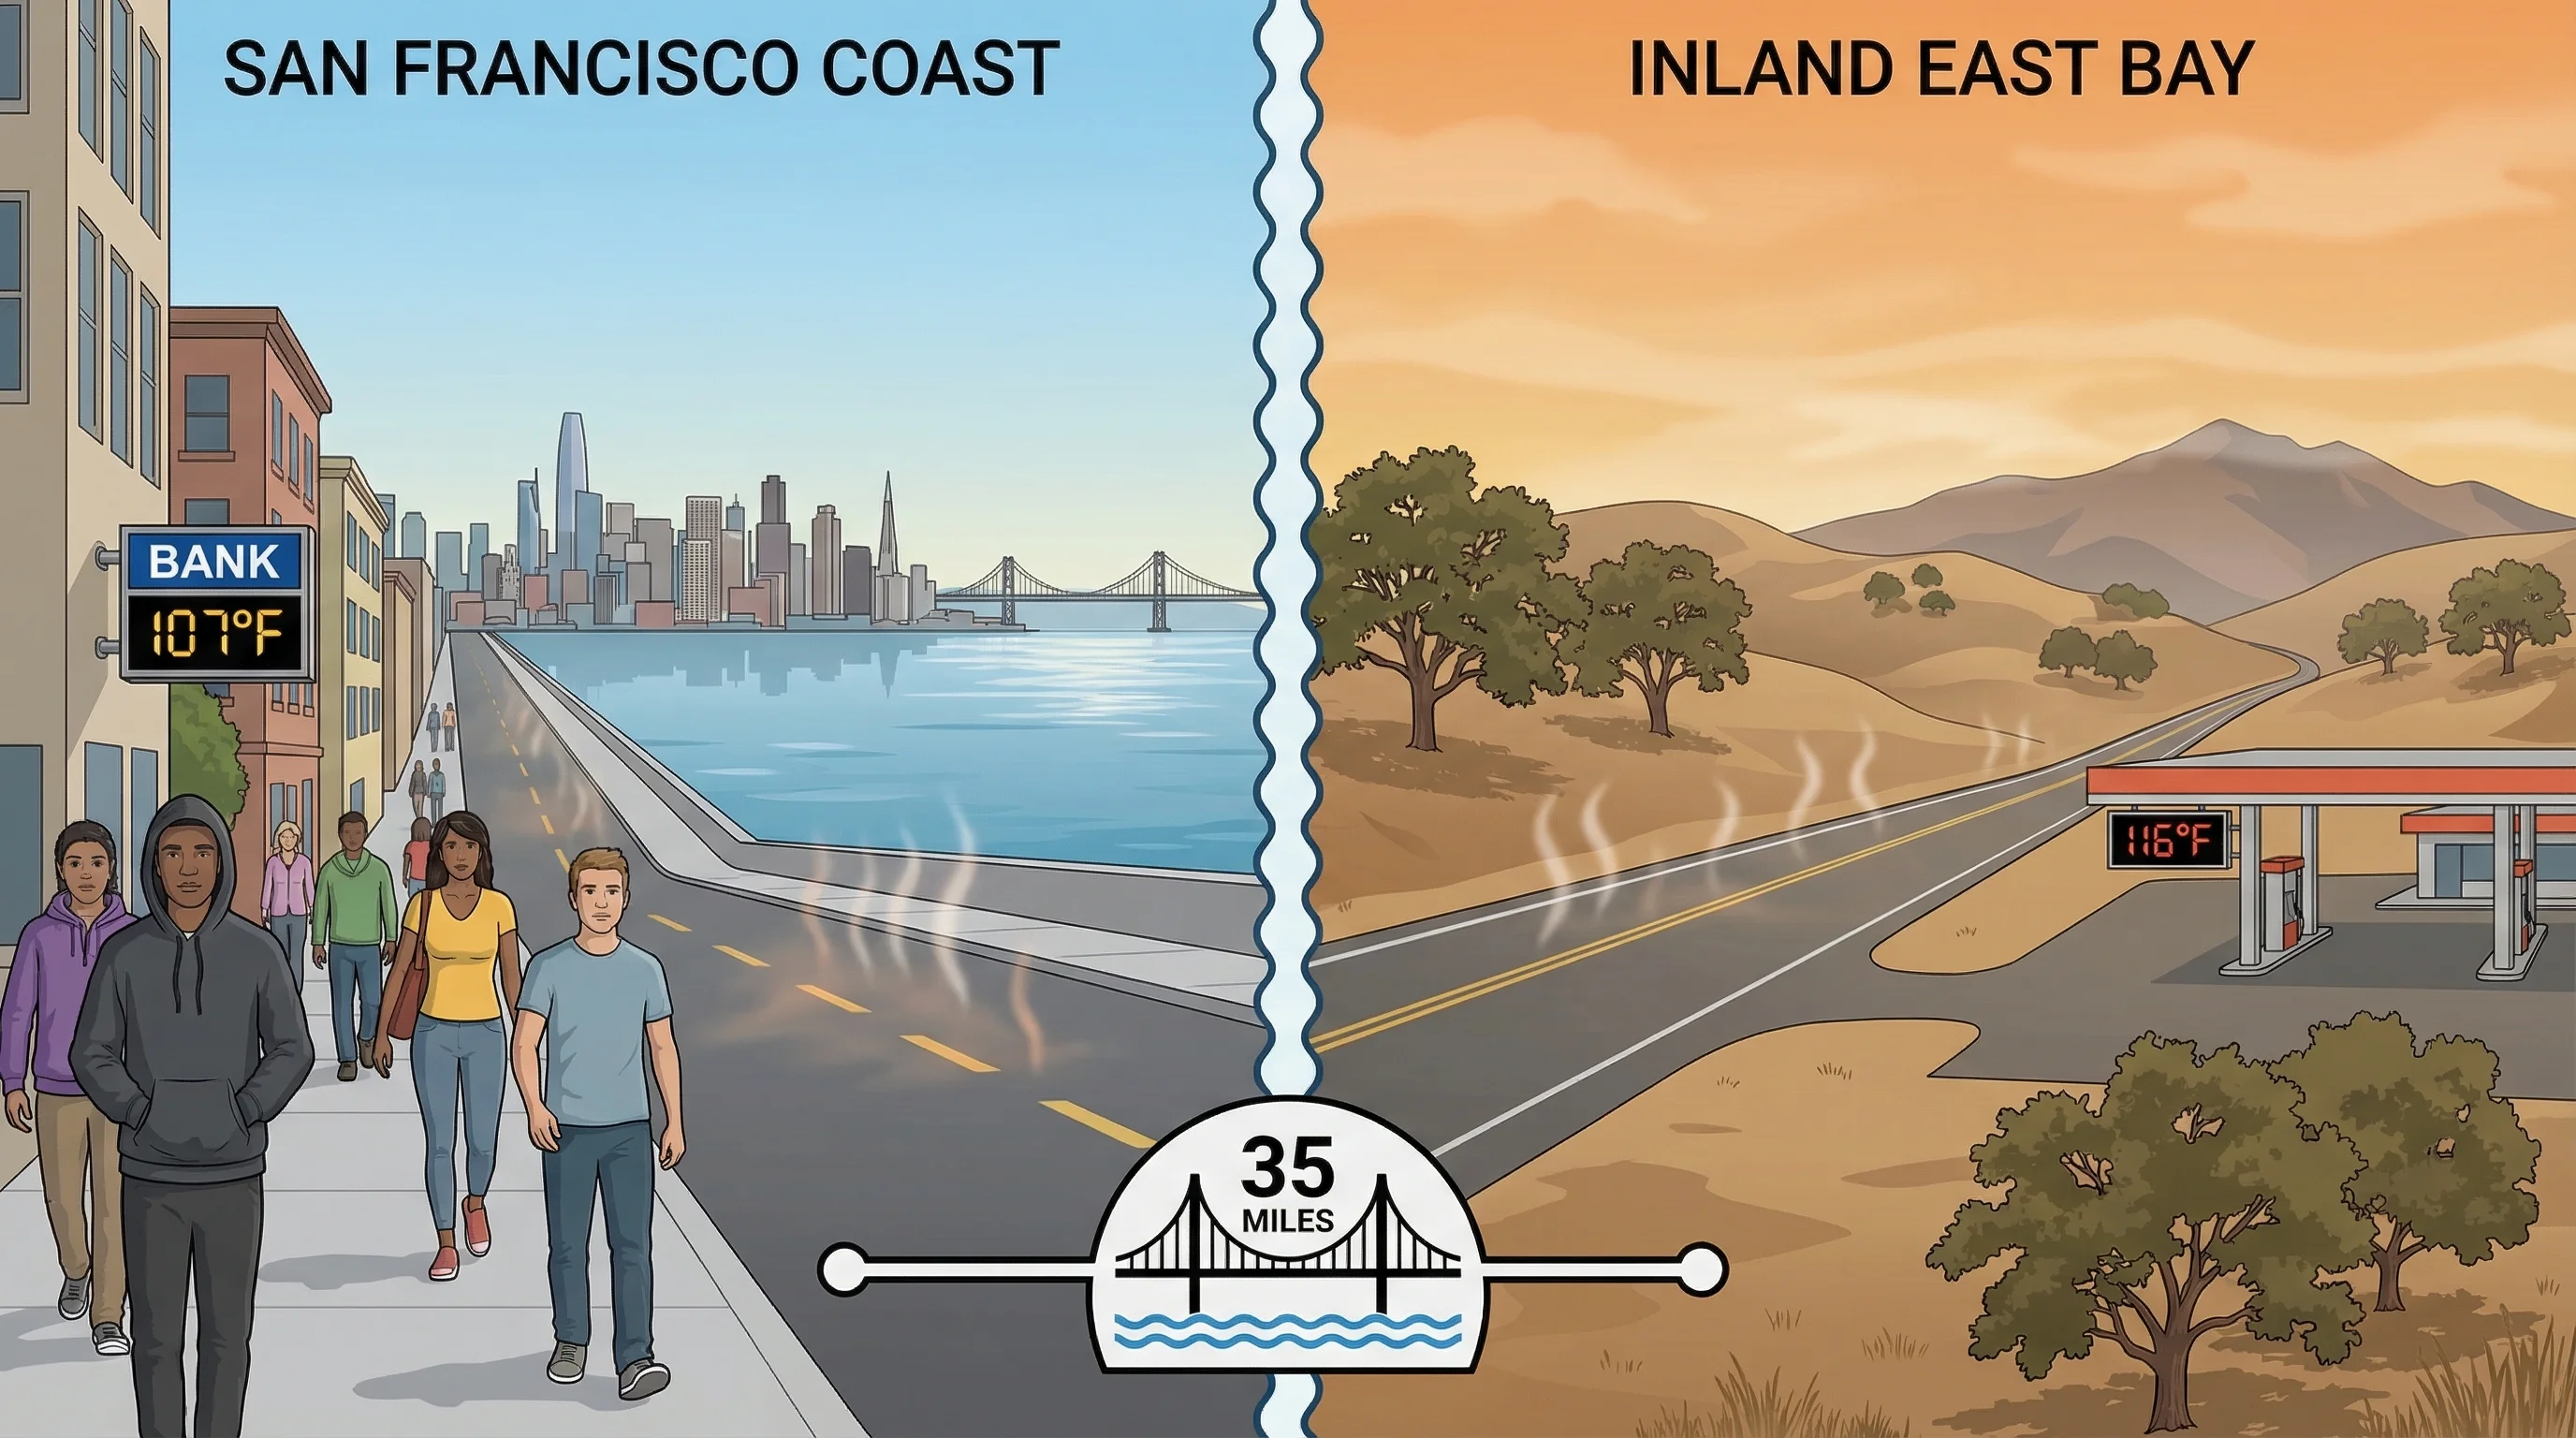
San Francisco's all-time high of 107°F (2022) broke a record set just 5 years earlier. Inland cities like Concord and Livermore have hit 115-116°F during heat domes. The pattern shows the Bay Area's heat ceiling is rising.
5min read →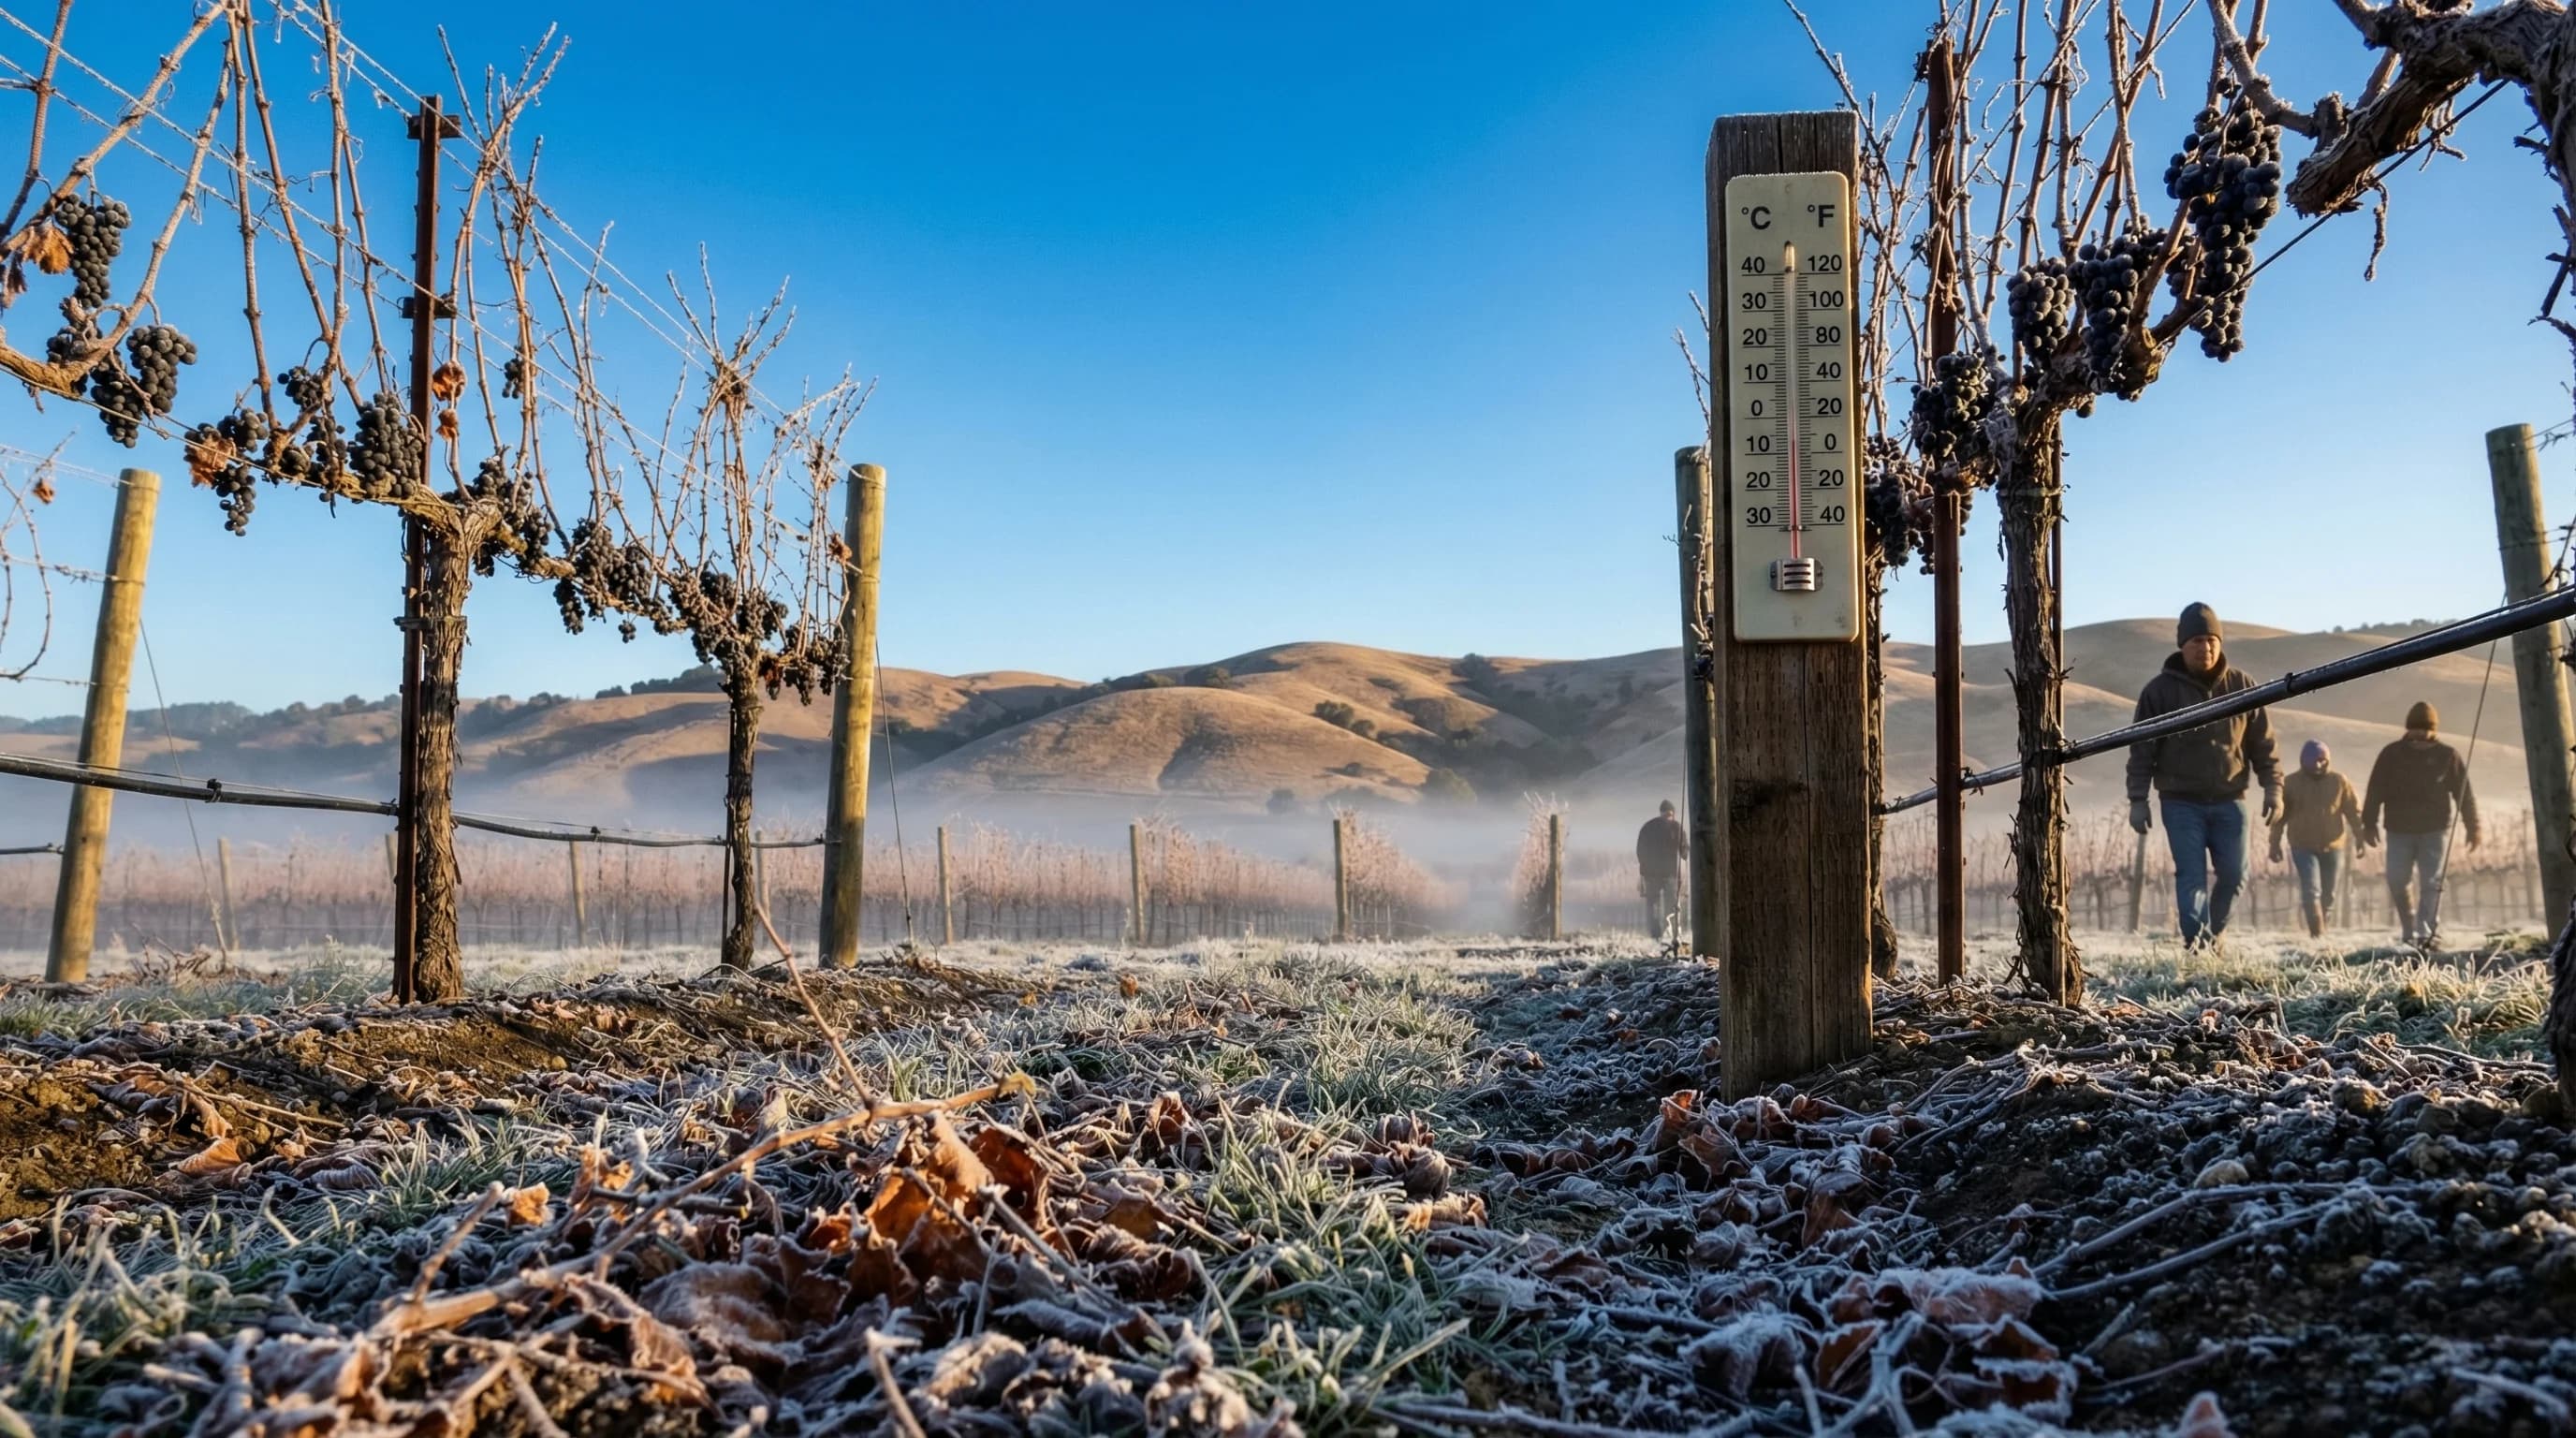
Bay Area cold records are produced by radiation cooling in sheltered inland valleys, not Arctic air. San Francisco's 27°F all-time low (1932) reflects marine buffering. Livermore and the Napa Valley floor regularly reach the mid-20s in hard freeze events.
5min read →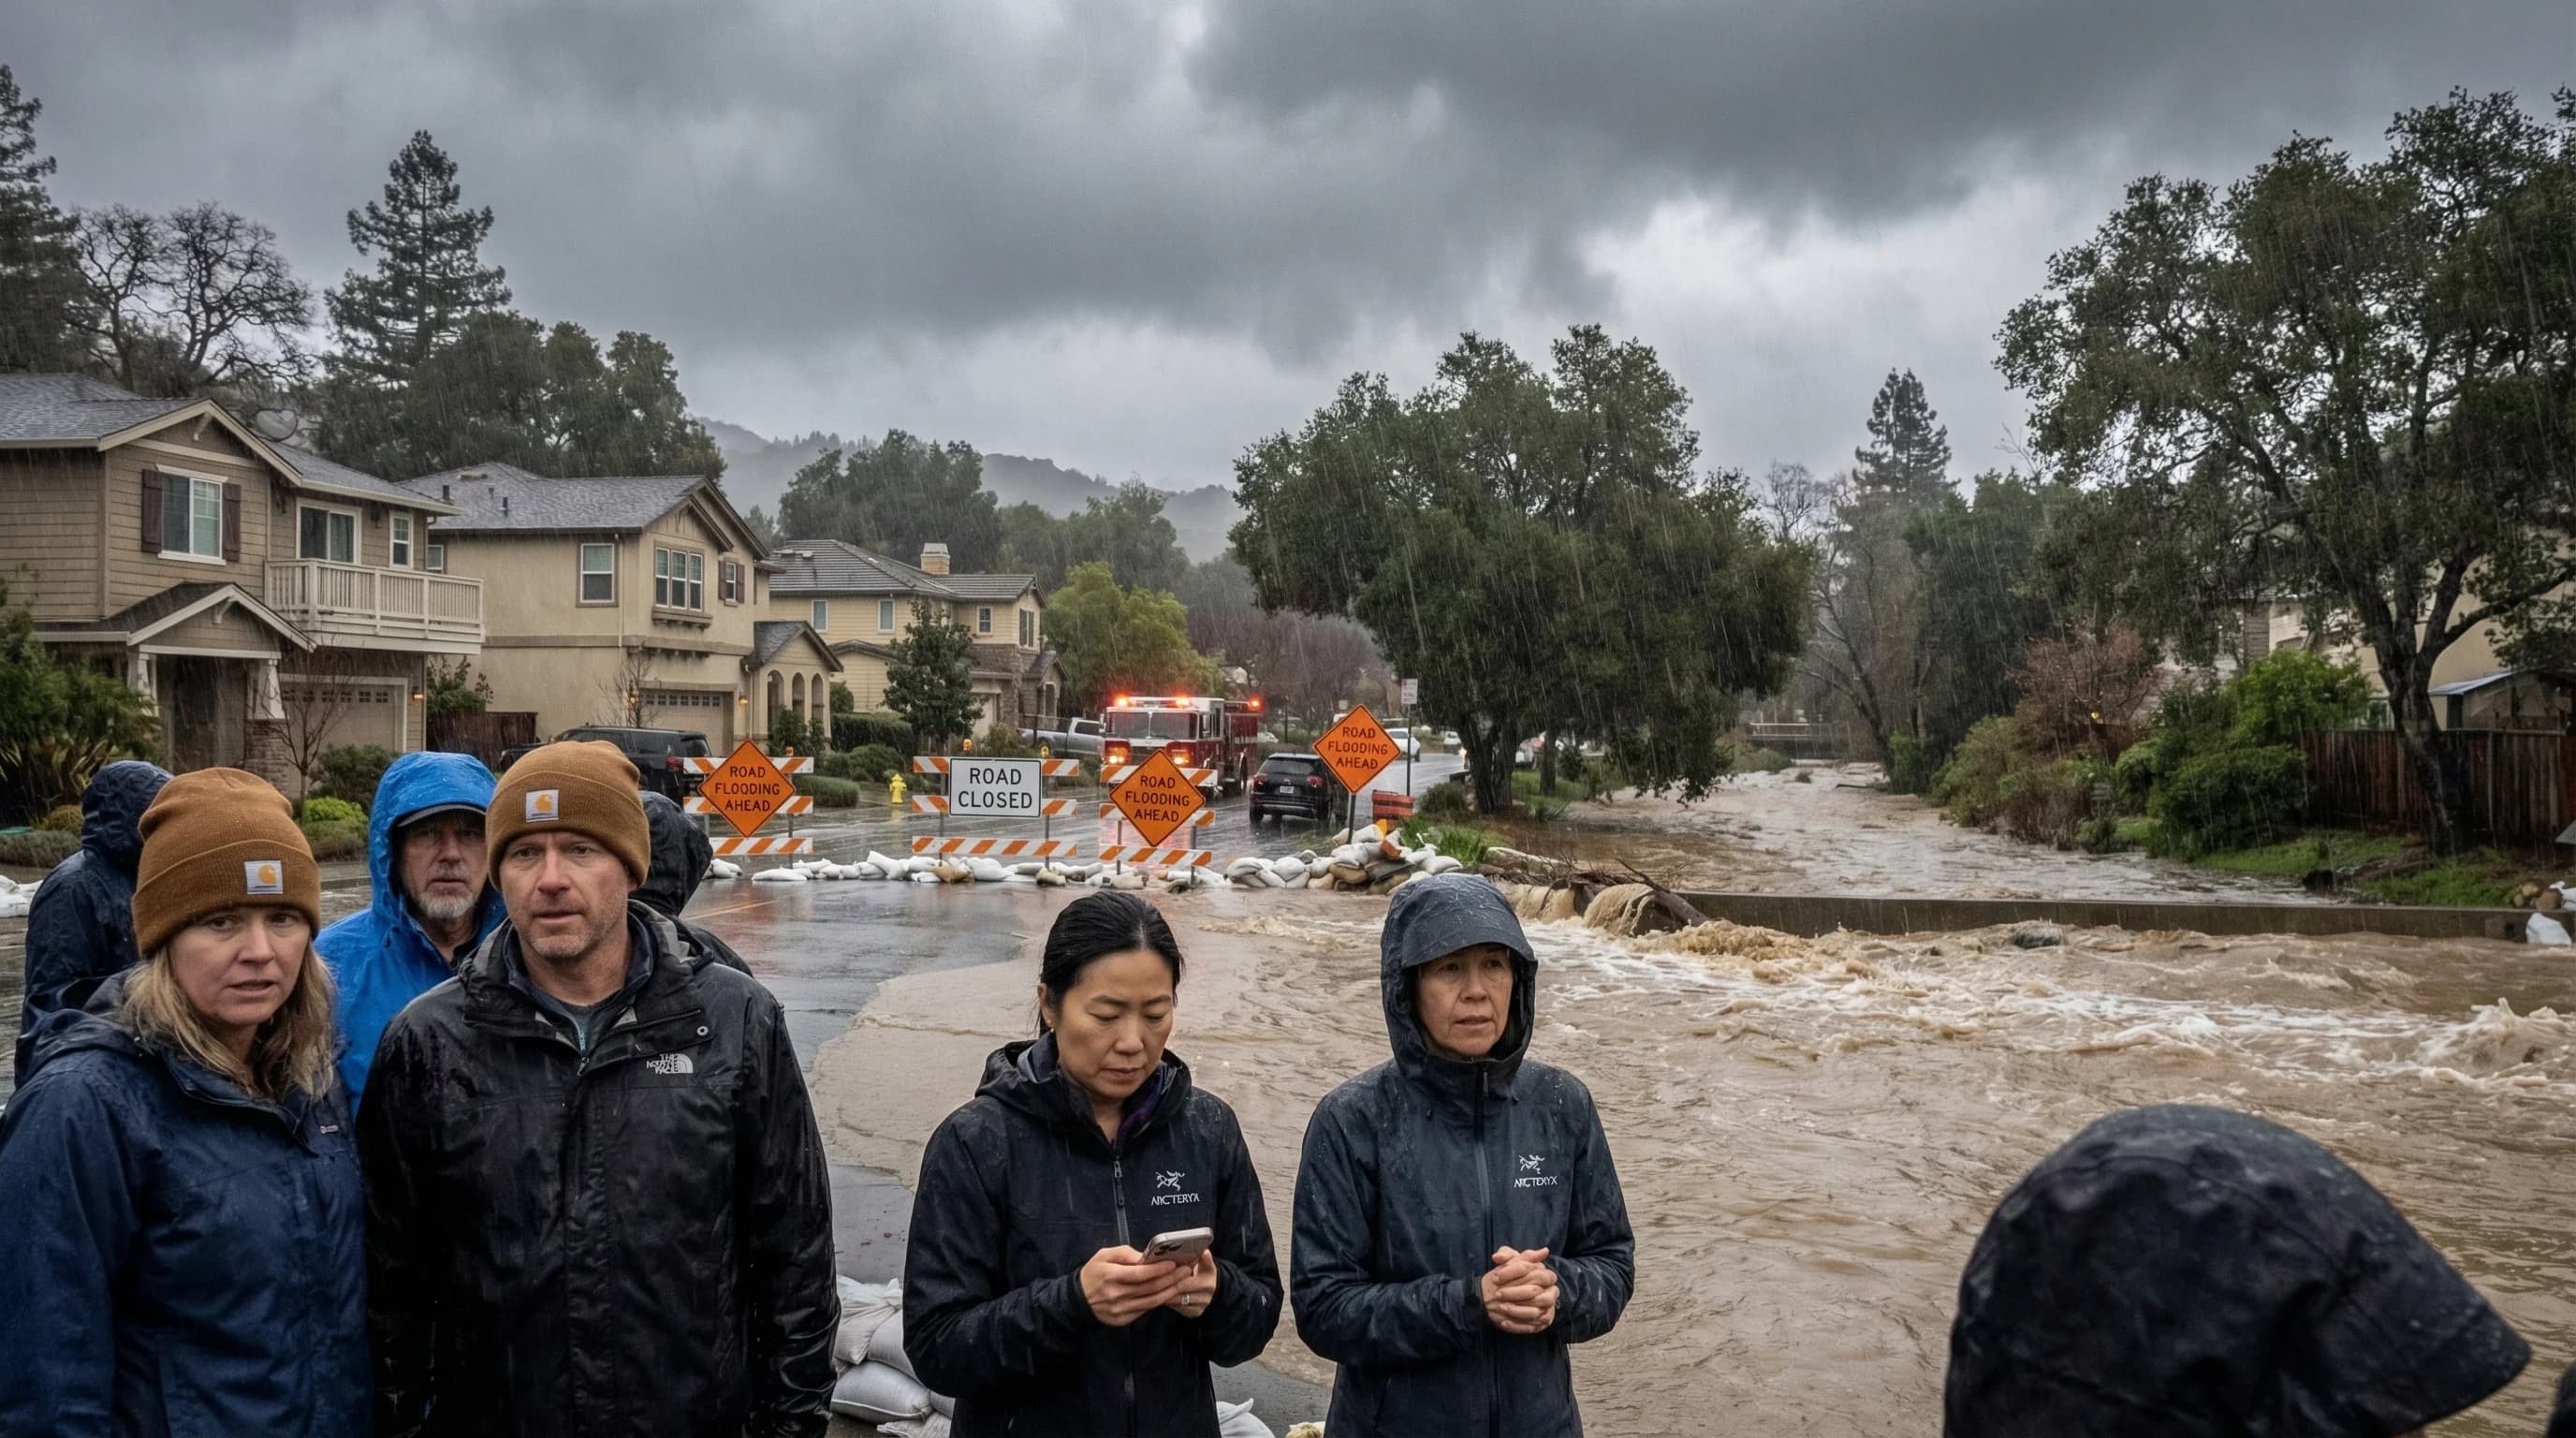
The Bay Area's wettest single days come from intense atmospheric rivers hitting orographic terrain. The Marin watershed has recorded 10+ inches in 24 hours; San Francisco has exceeded 5 inches. These events overwhelm flood infrastructure designed for moderate rain.
5min read →Category
How Bay Area weather drives air quality, wildfire smoke events, and what AQI readings mean for your health.
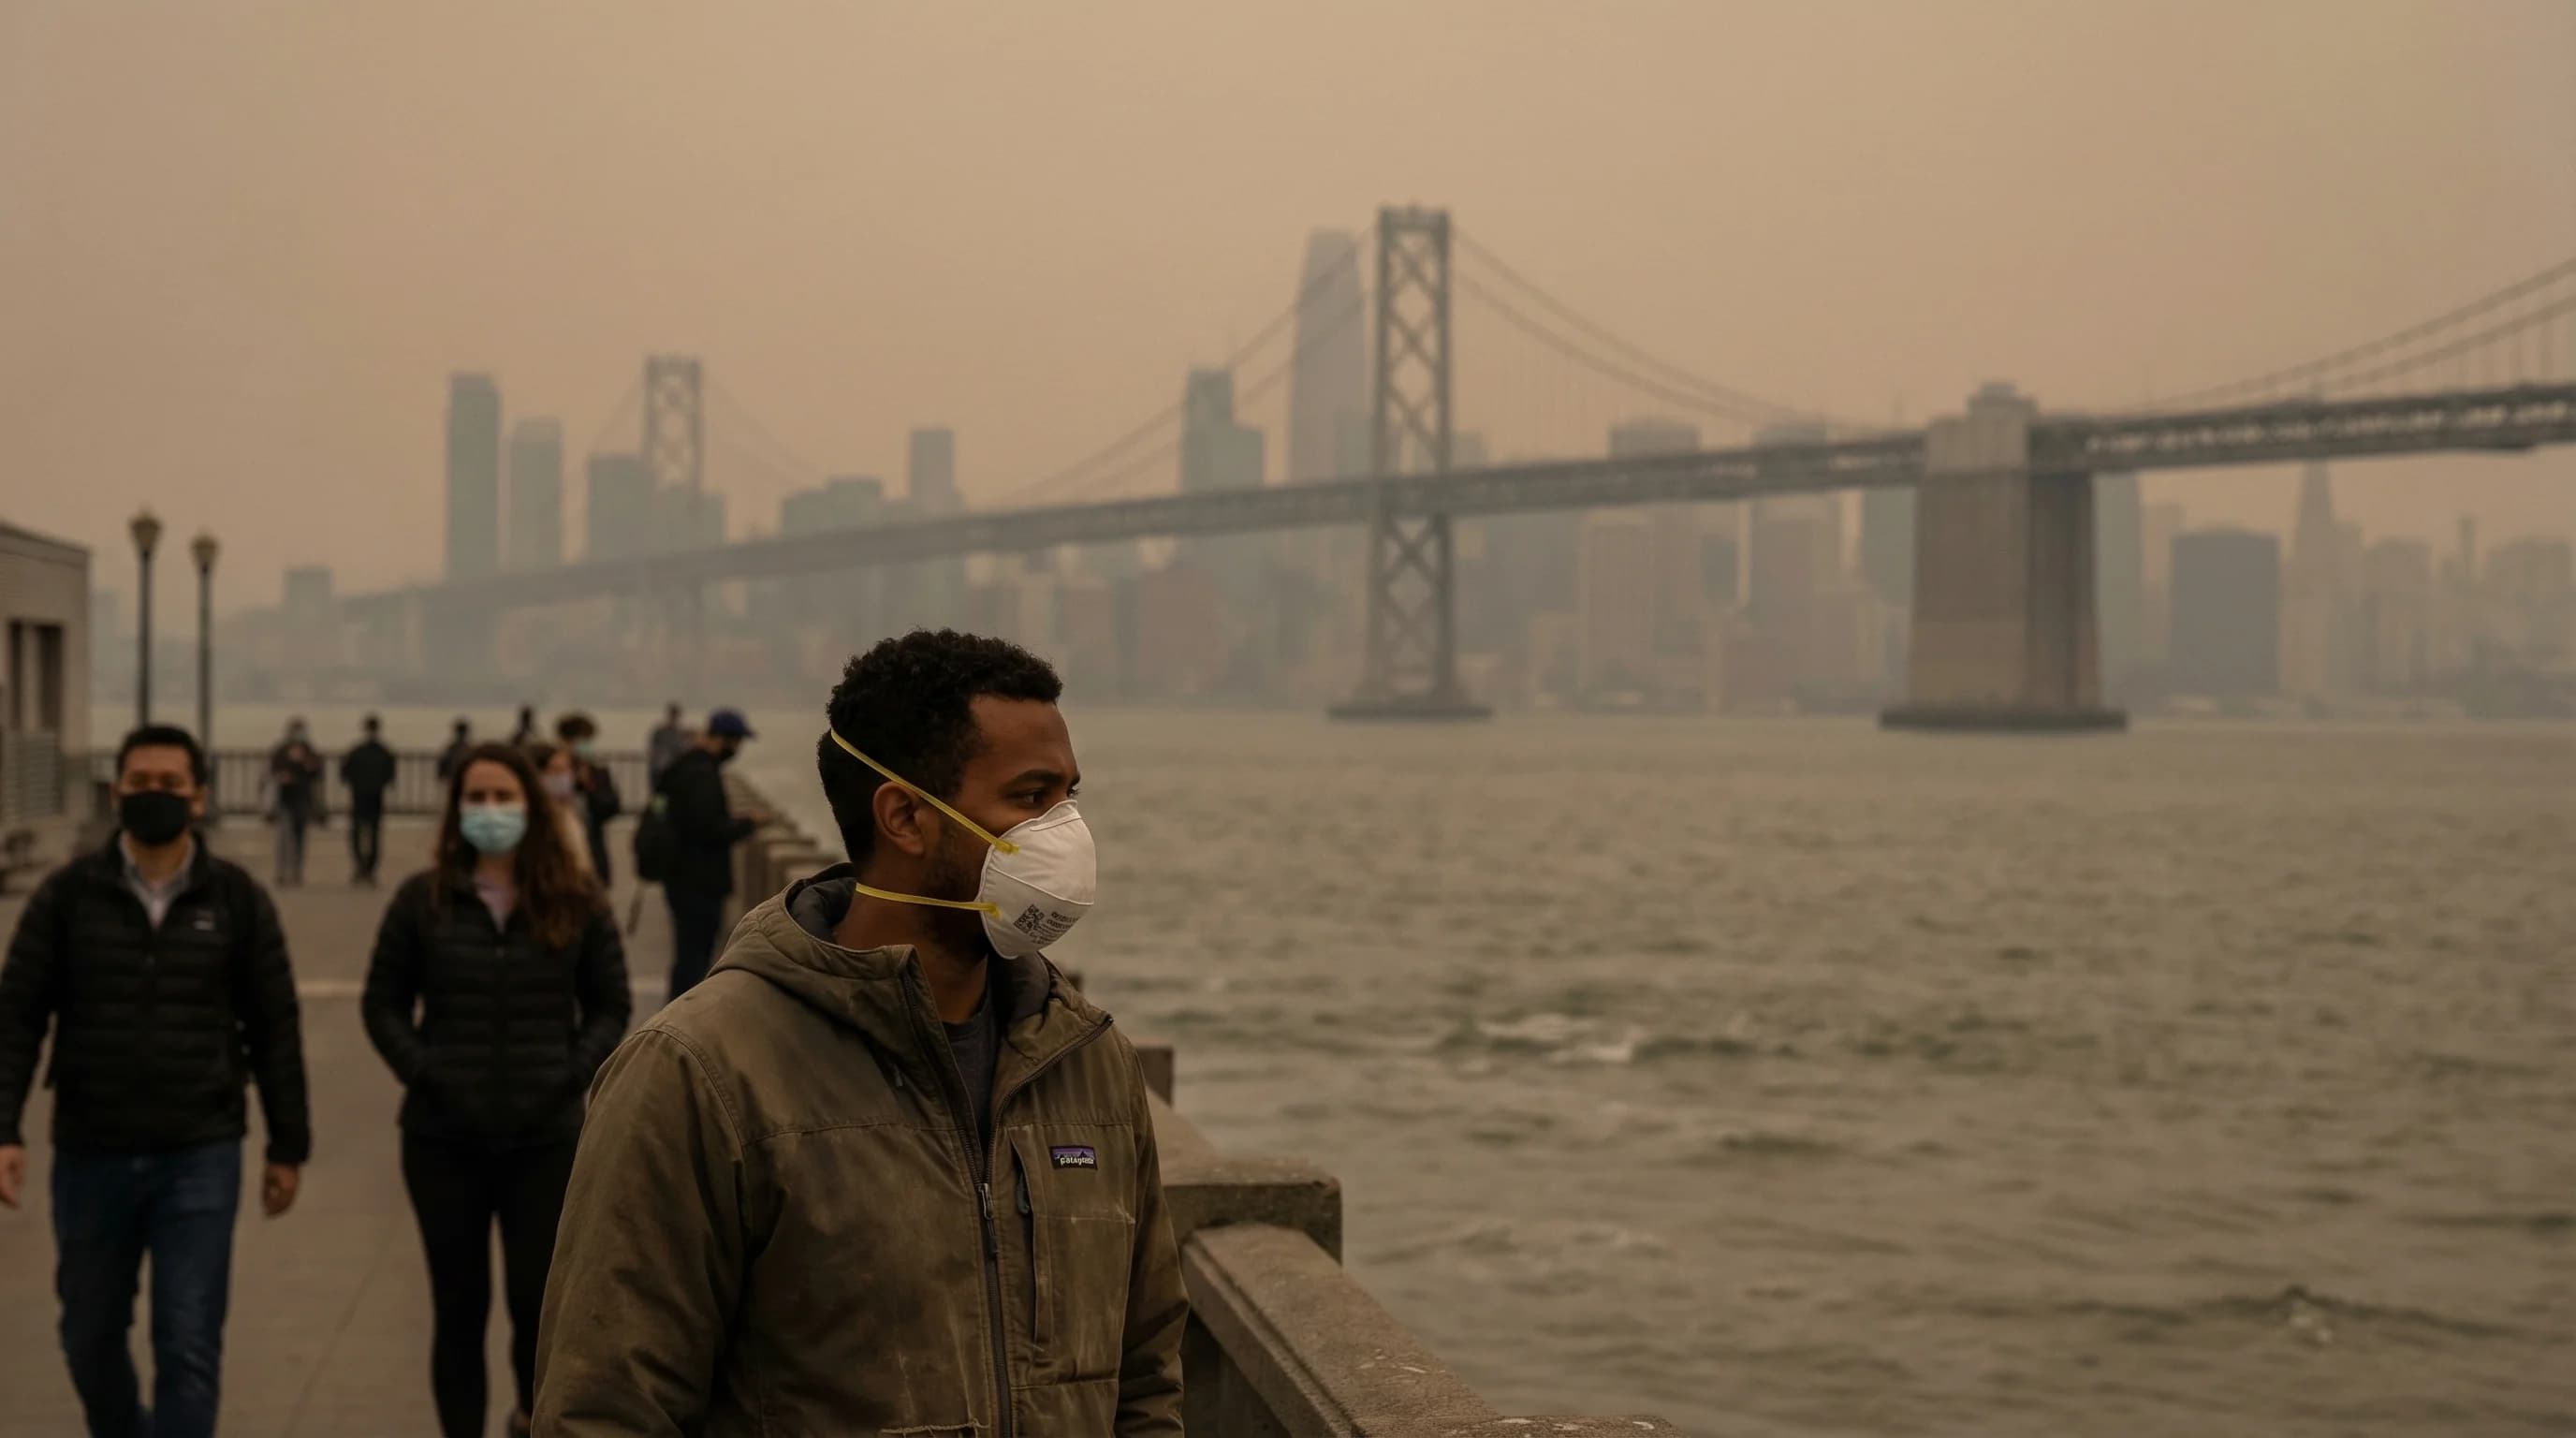
Wildfire smoke from fires hundreds of miles away can produce hazardous Bay Area air quality within hours. Temperature inversions trap smoke at ground level, and the 2018 Camp Fire delivered two weeks of the worst air in the region's recorded history.
6min read →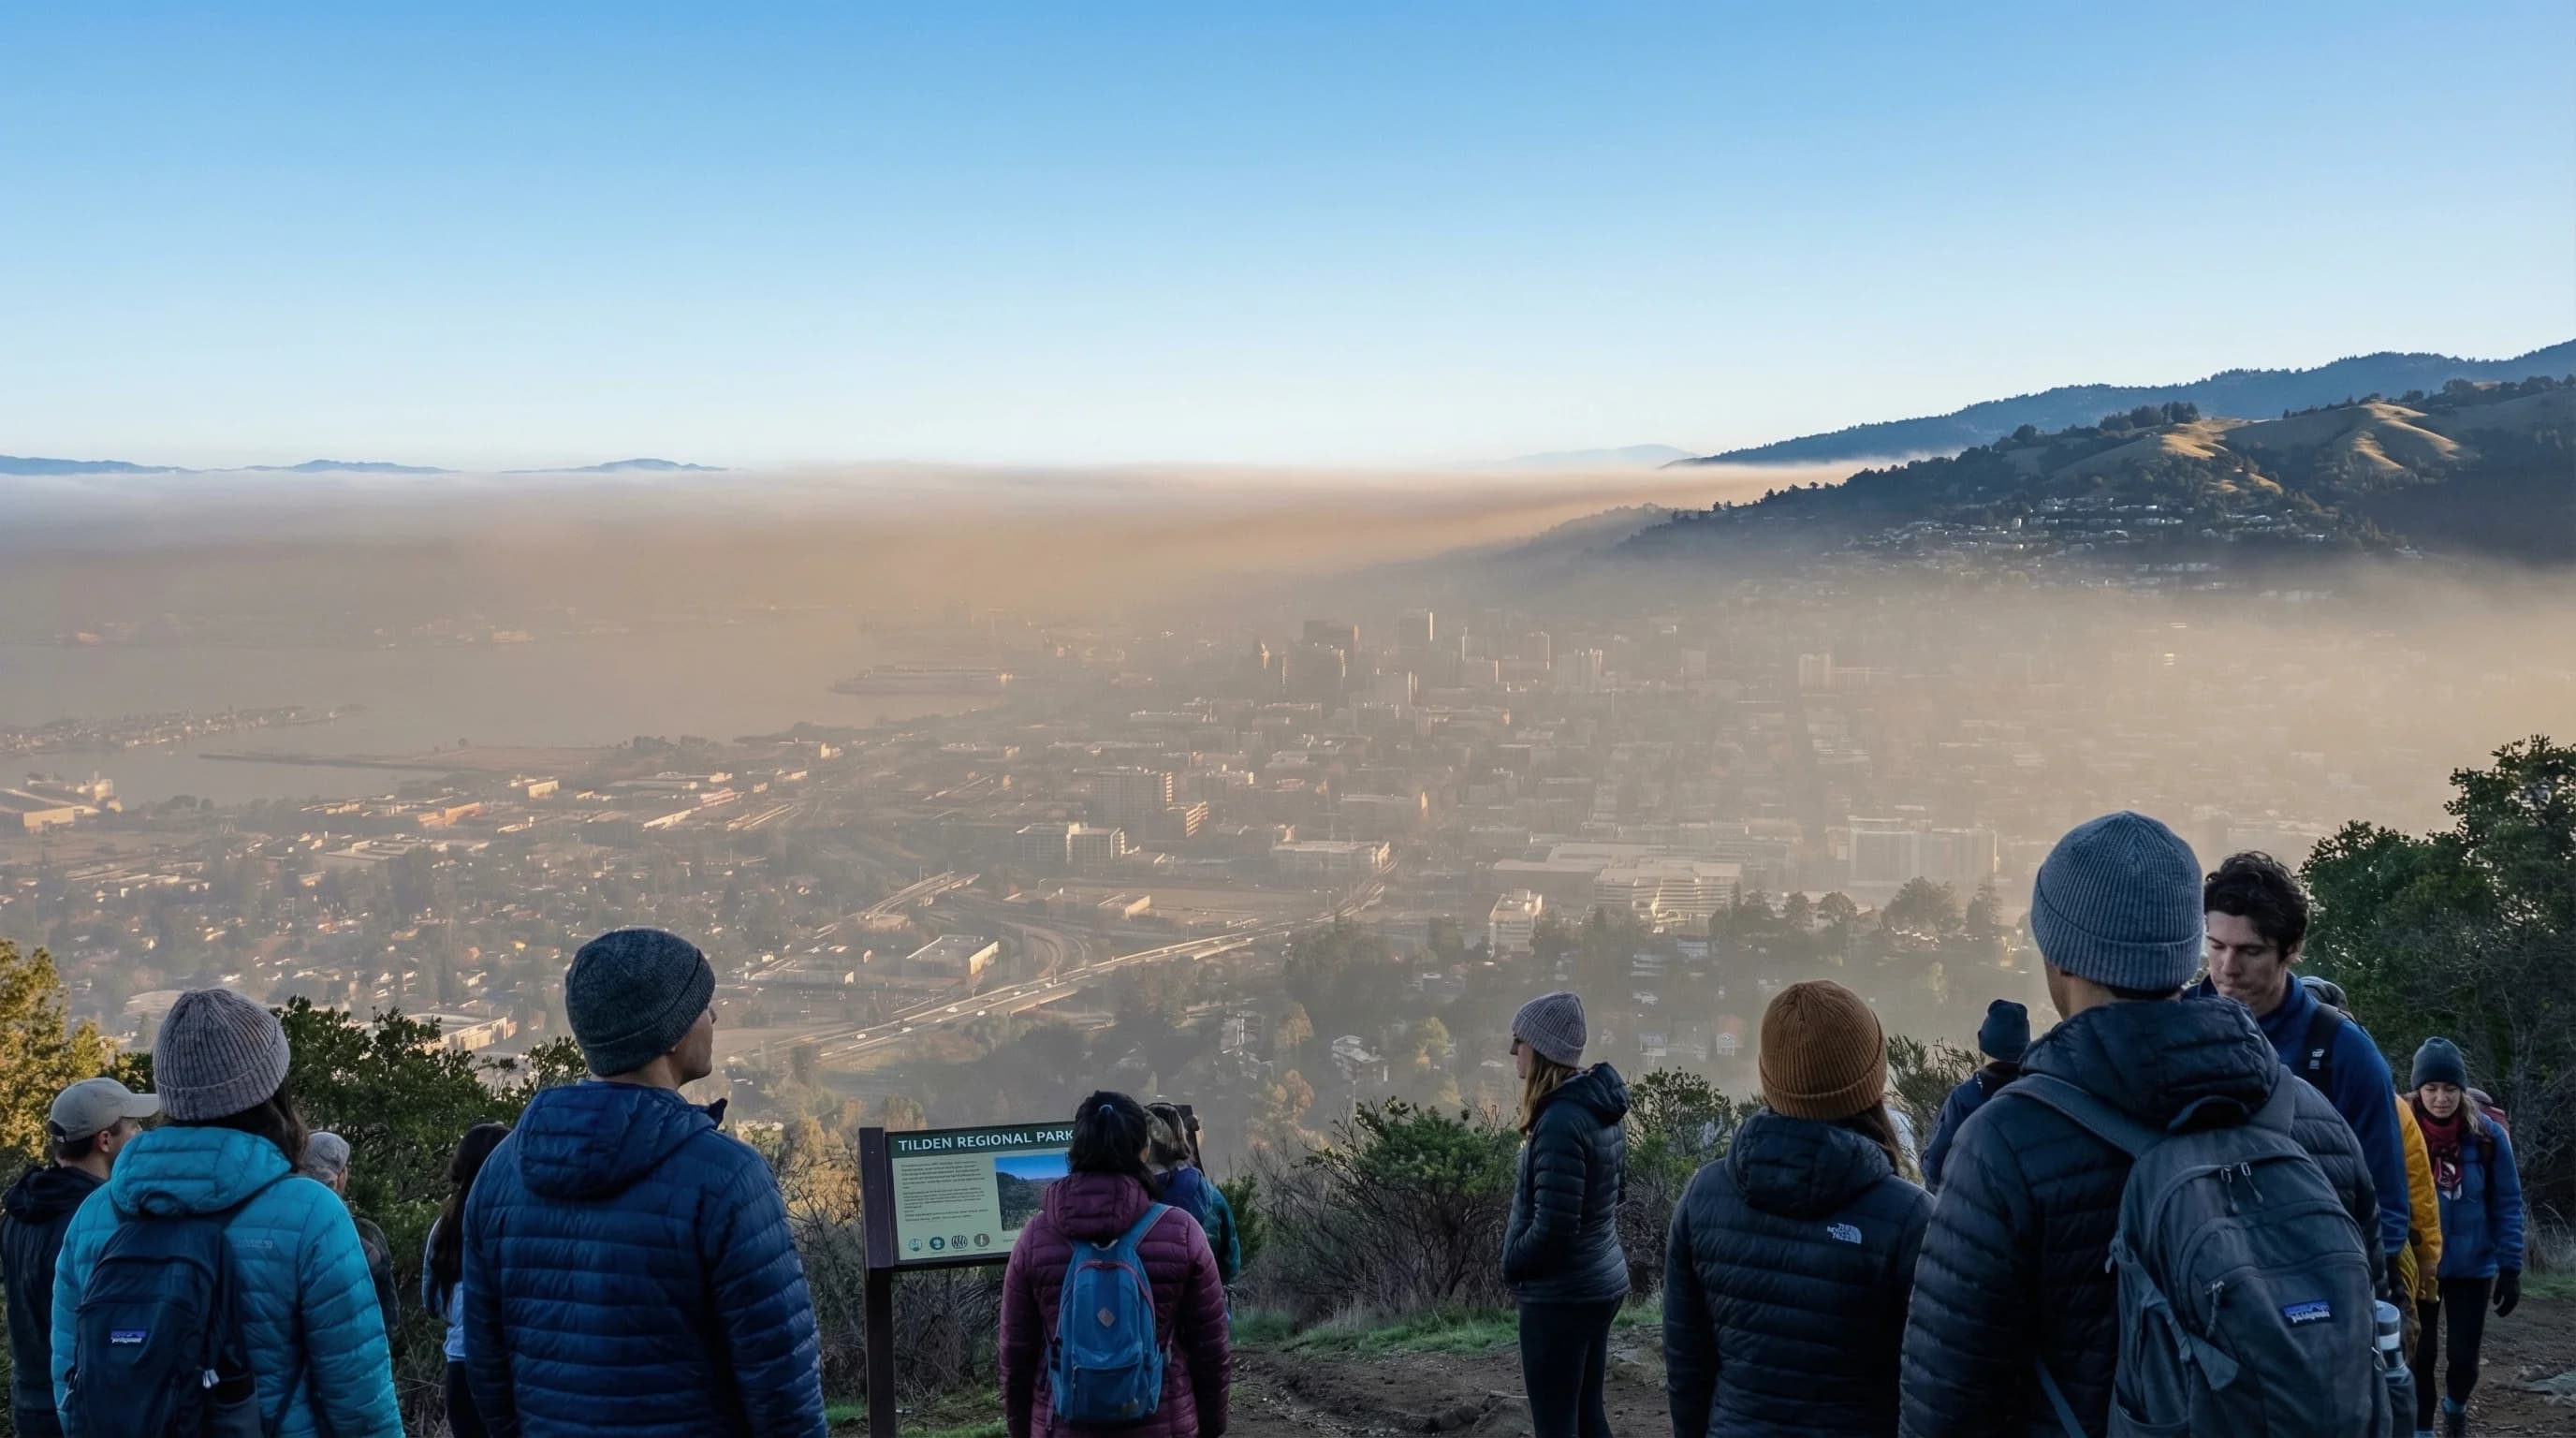
Bay Area air quality is weather-driven. Winter temperature inversions trap vehicle emissions and wood smoke for days, creating the region's worst non-smoke air quality. Summer sea breezes flush pollutants continuously. Spare the Air alerts target the worst inversion days.
6min read →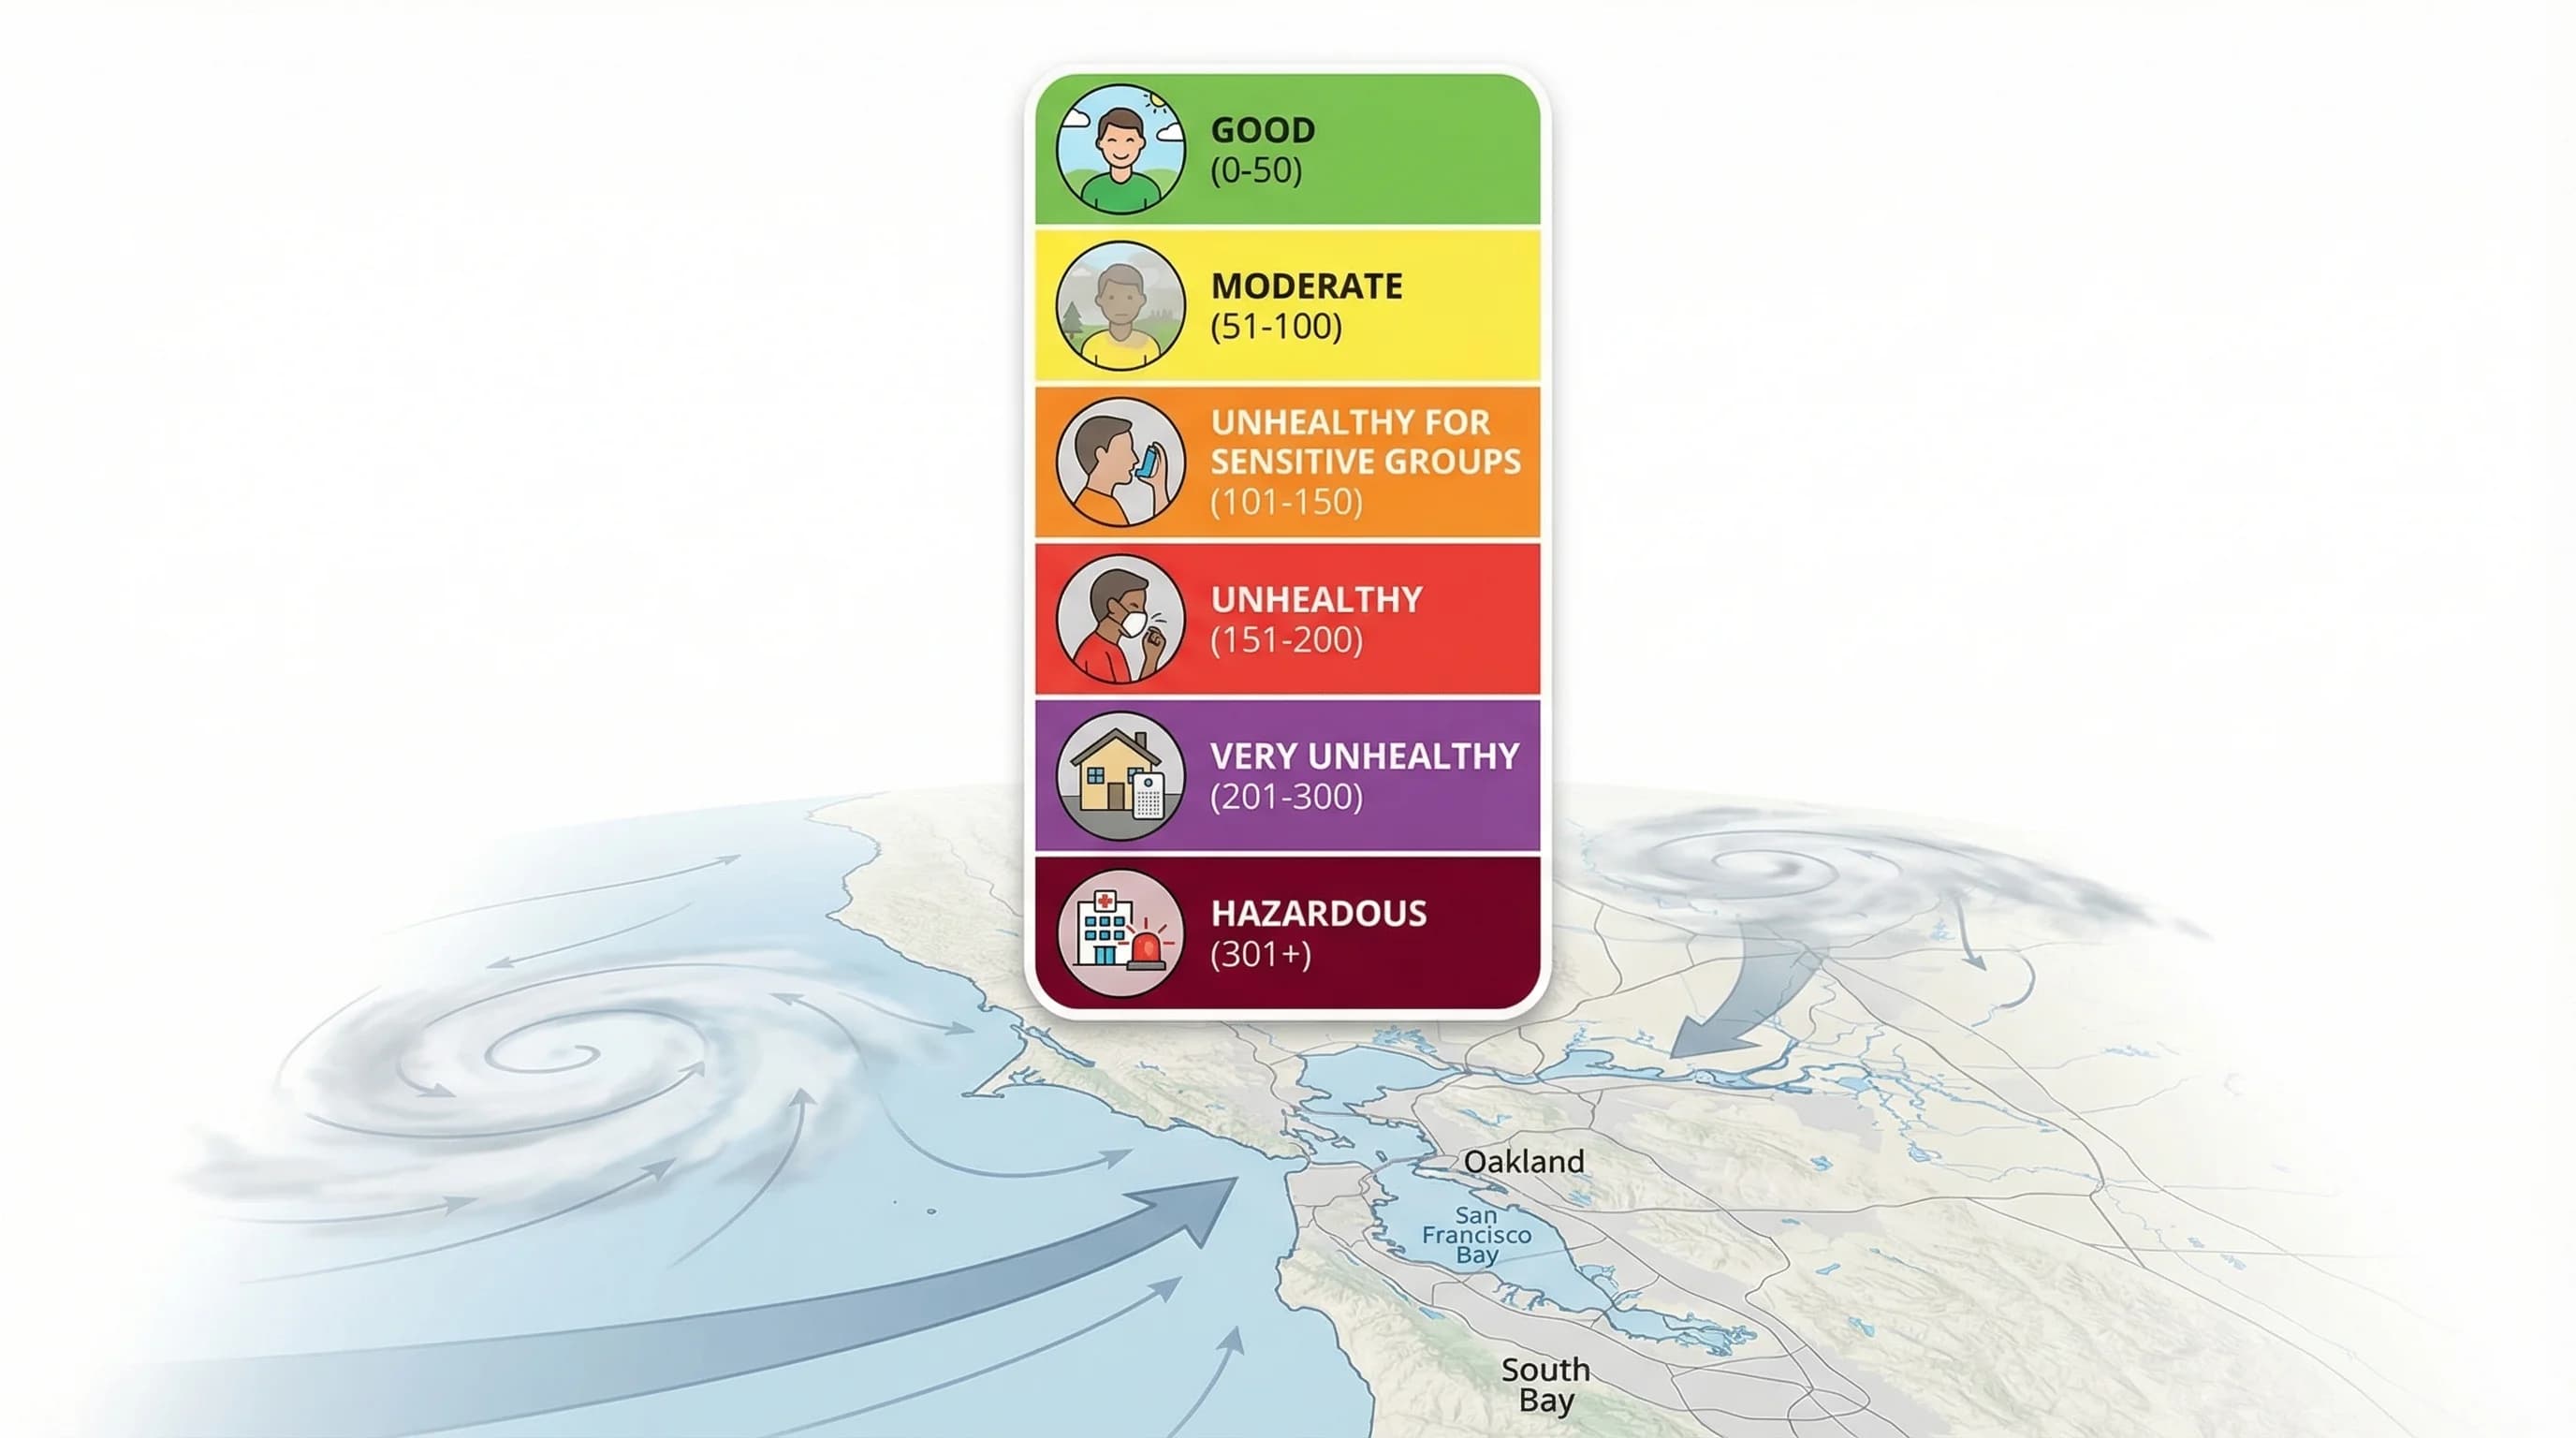
The Air Quality Index translates complex pollution measurements into a single number with health guidance. In the Bay Area, PM2.5 from wildfire smoke and wood burning drives most elevated readings. Here's how to read AQI and what to do at each level.
6min read →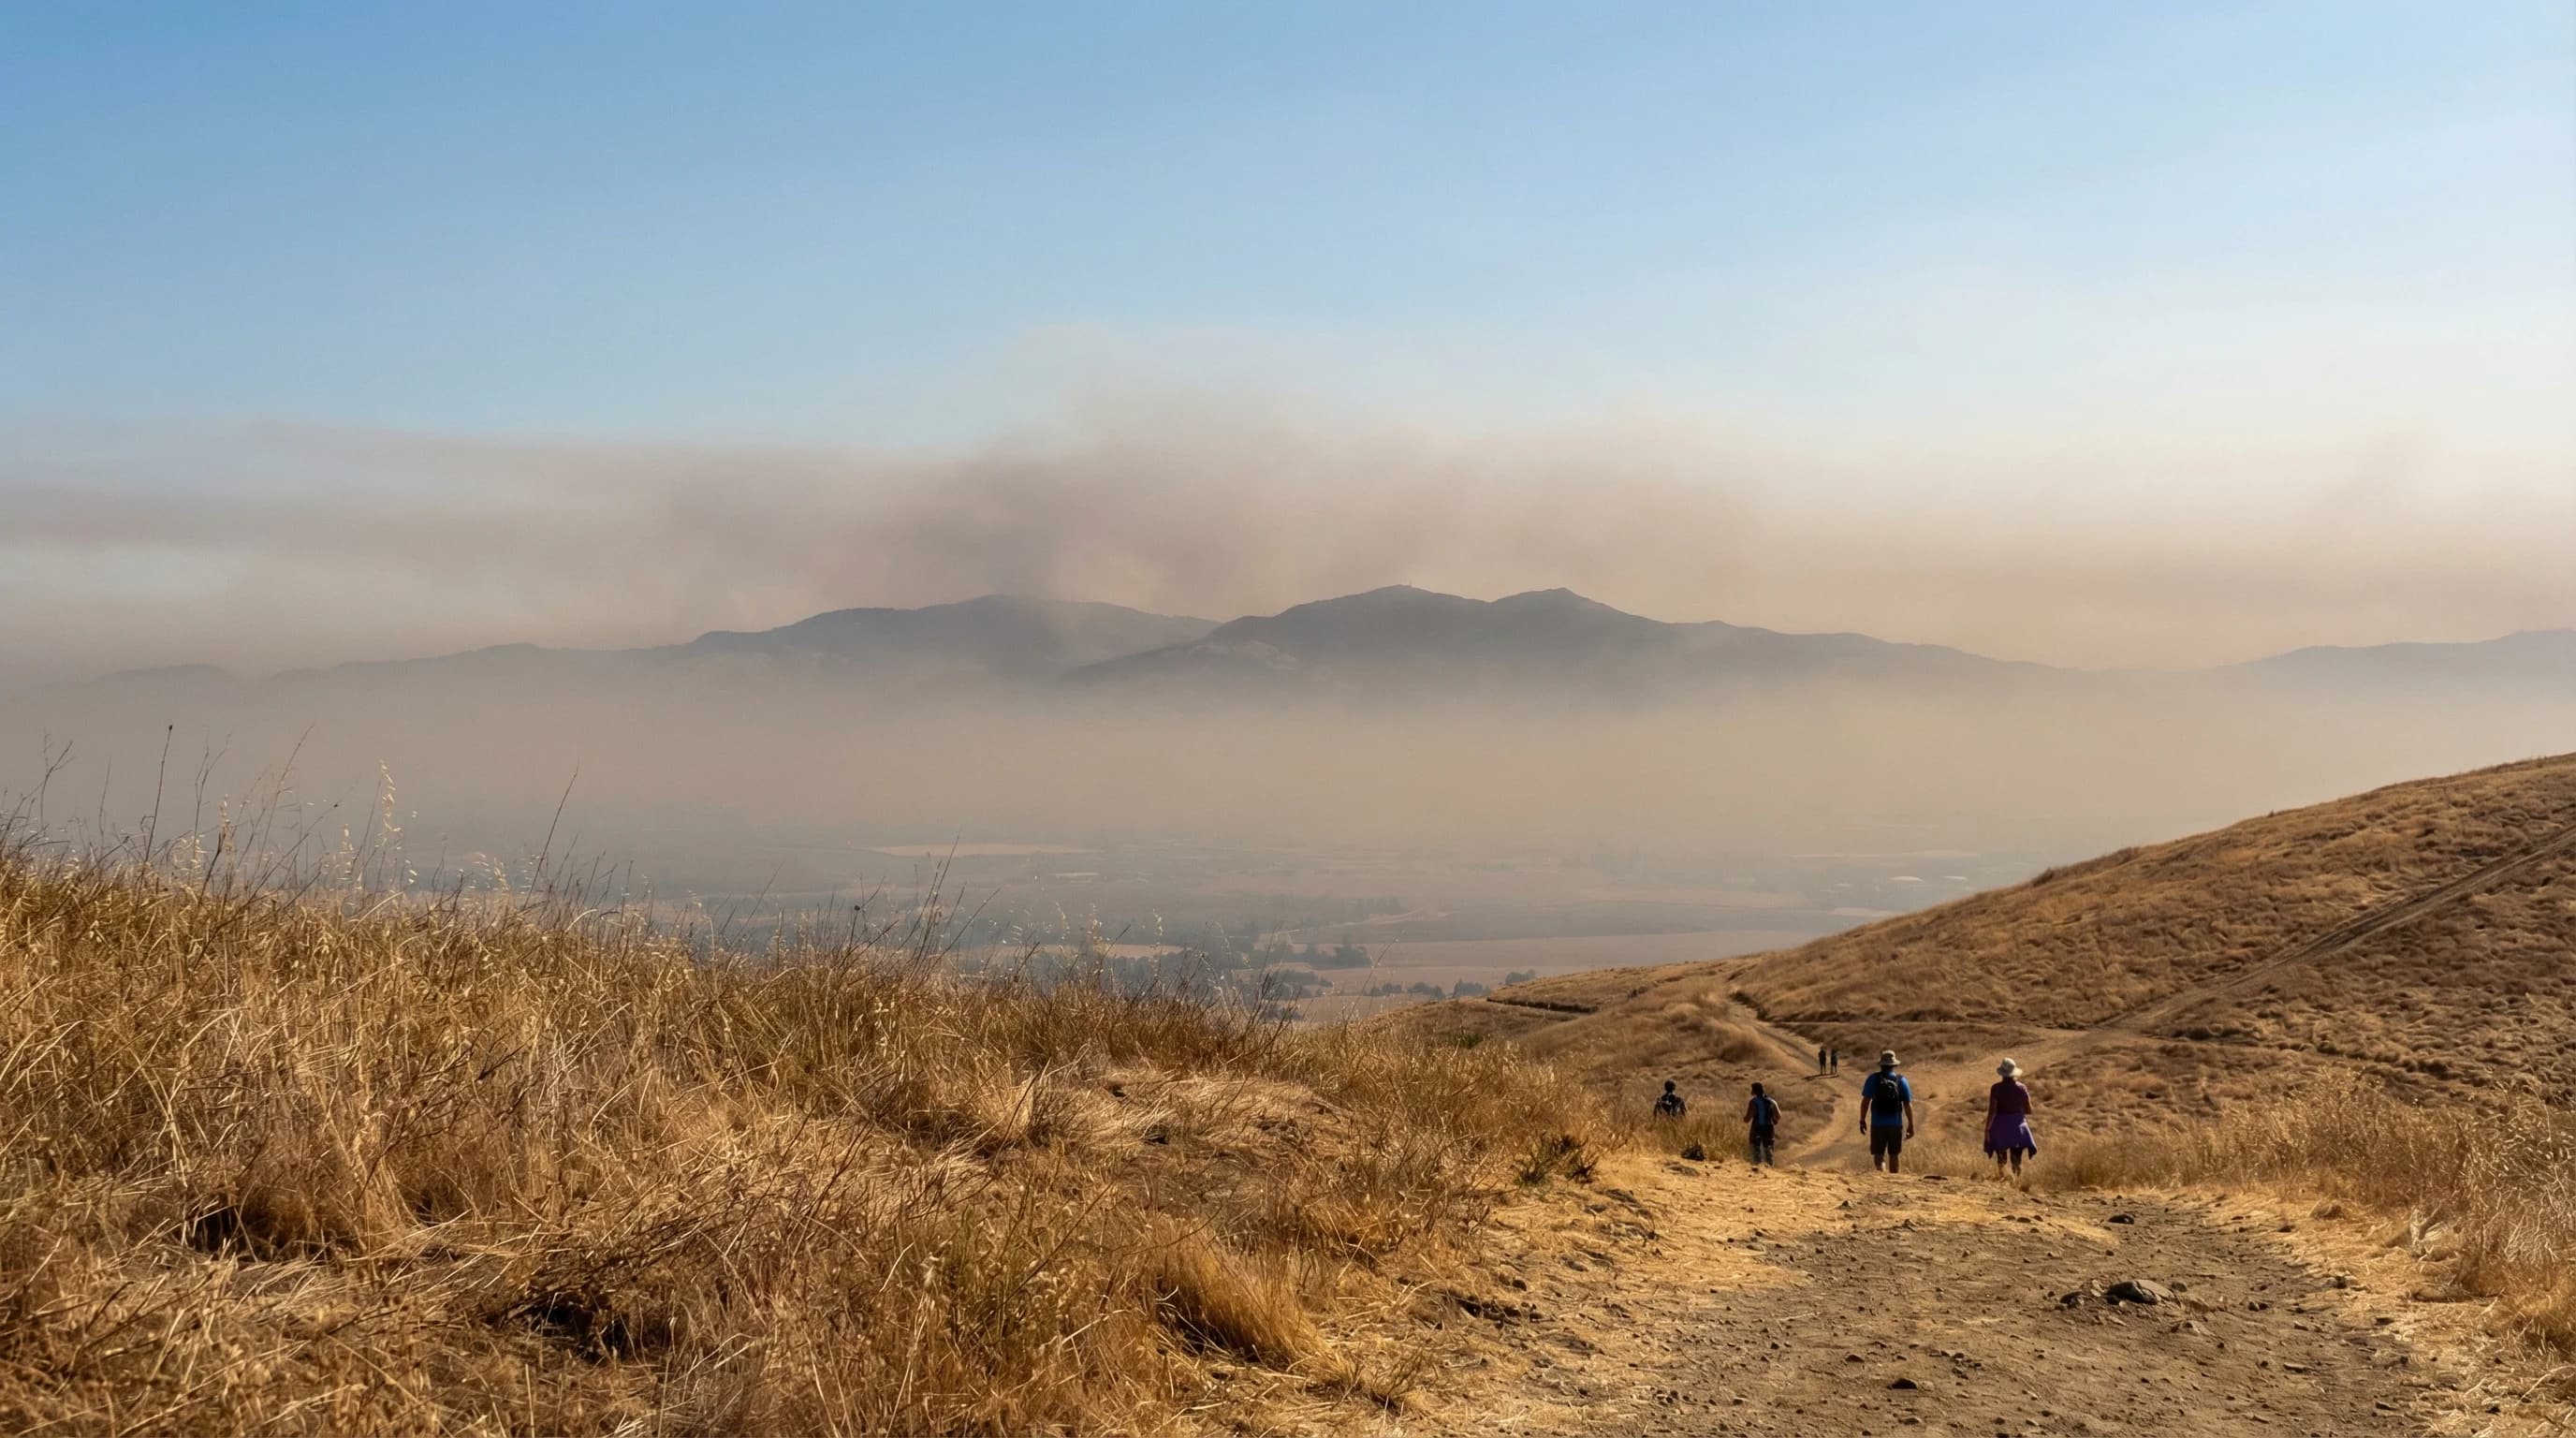
Ground-level ozone is the Bay Area's most persistent air quality challenge. It forms on hot summer afternoons in inland valleys where sunlight converts vehicle emissions to smog. Livermore consistently records the region's highest ozone levels.
6min read →Category
Flood zones, fog driving, and storm preparedness for Bay Area residents and visitors.
Bay Area flooding comes from creeks, bay tidal flooding, overwhelmed storm drains, and hillside debris flows. Learn where the highest-risk areas are and how to check your specific flood risk using FEMA maps.
7min read →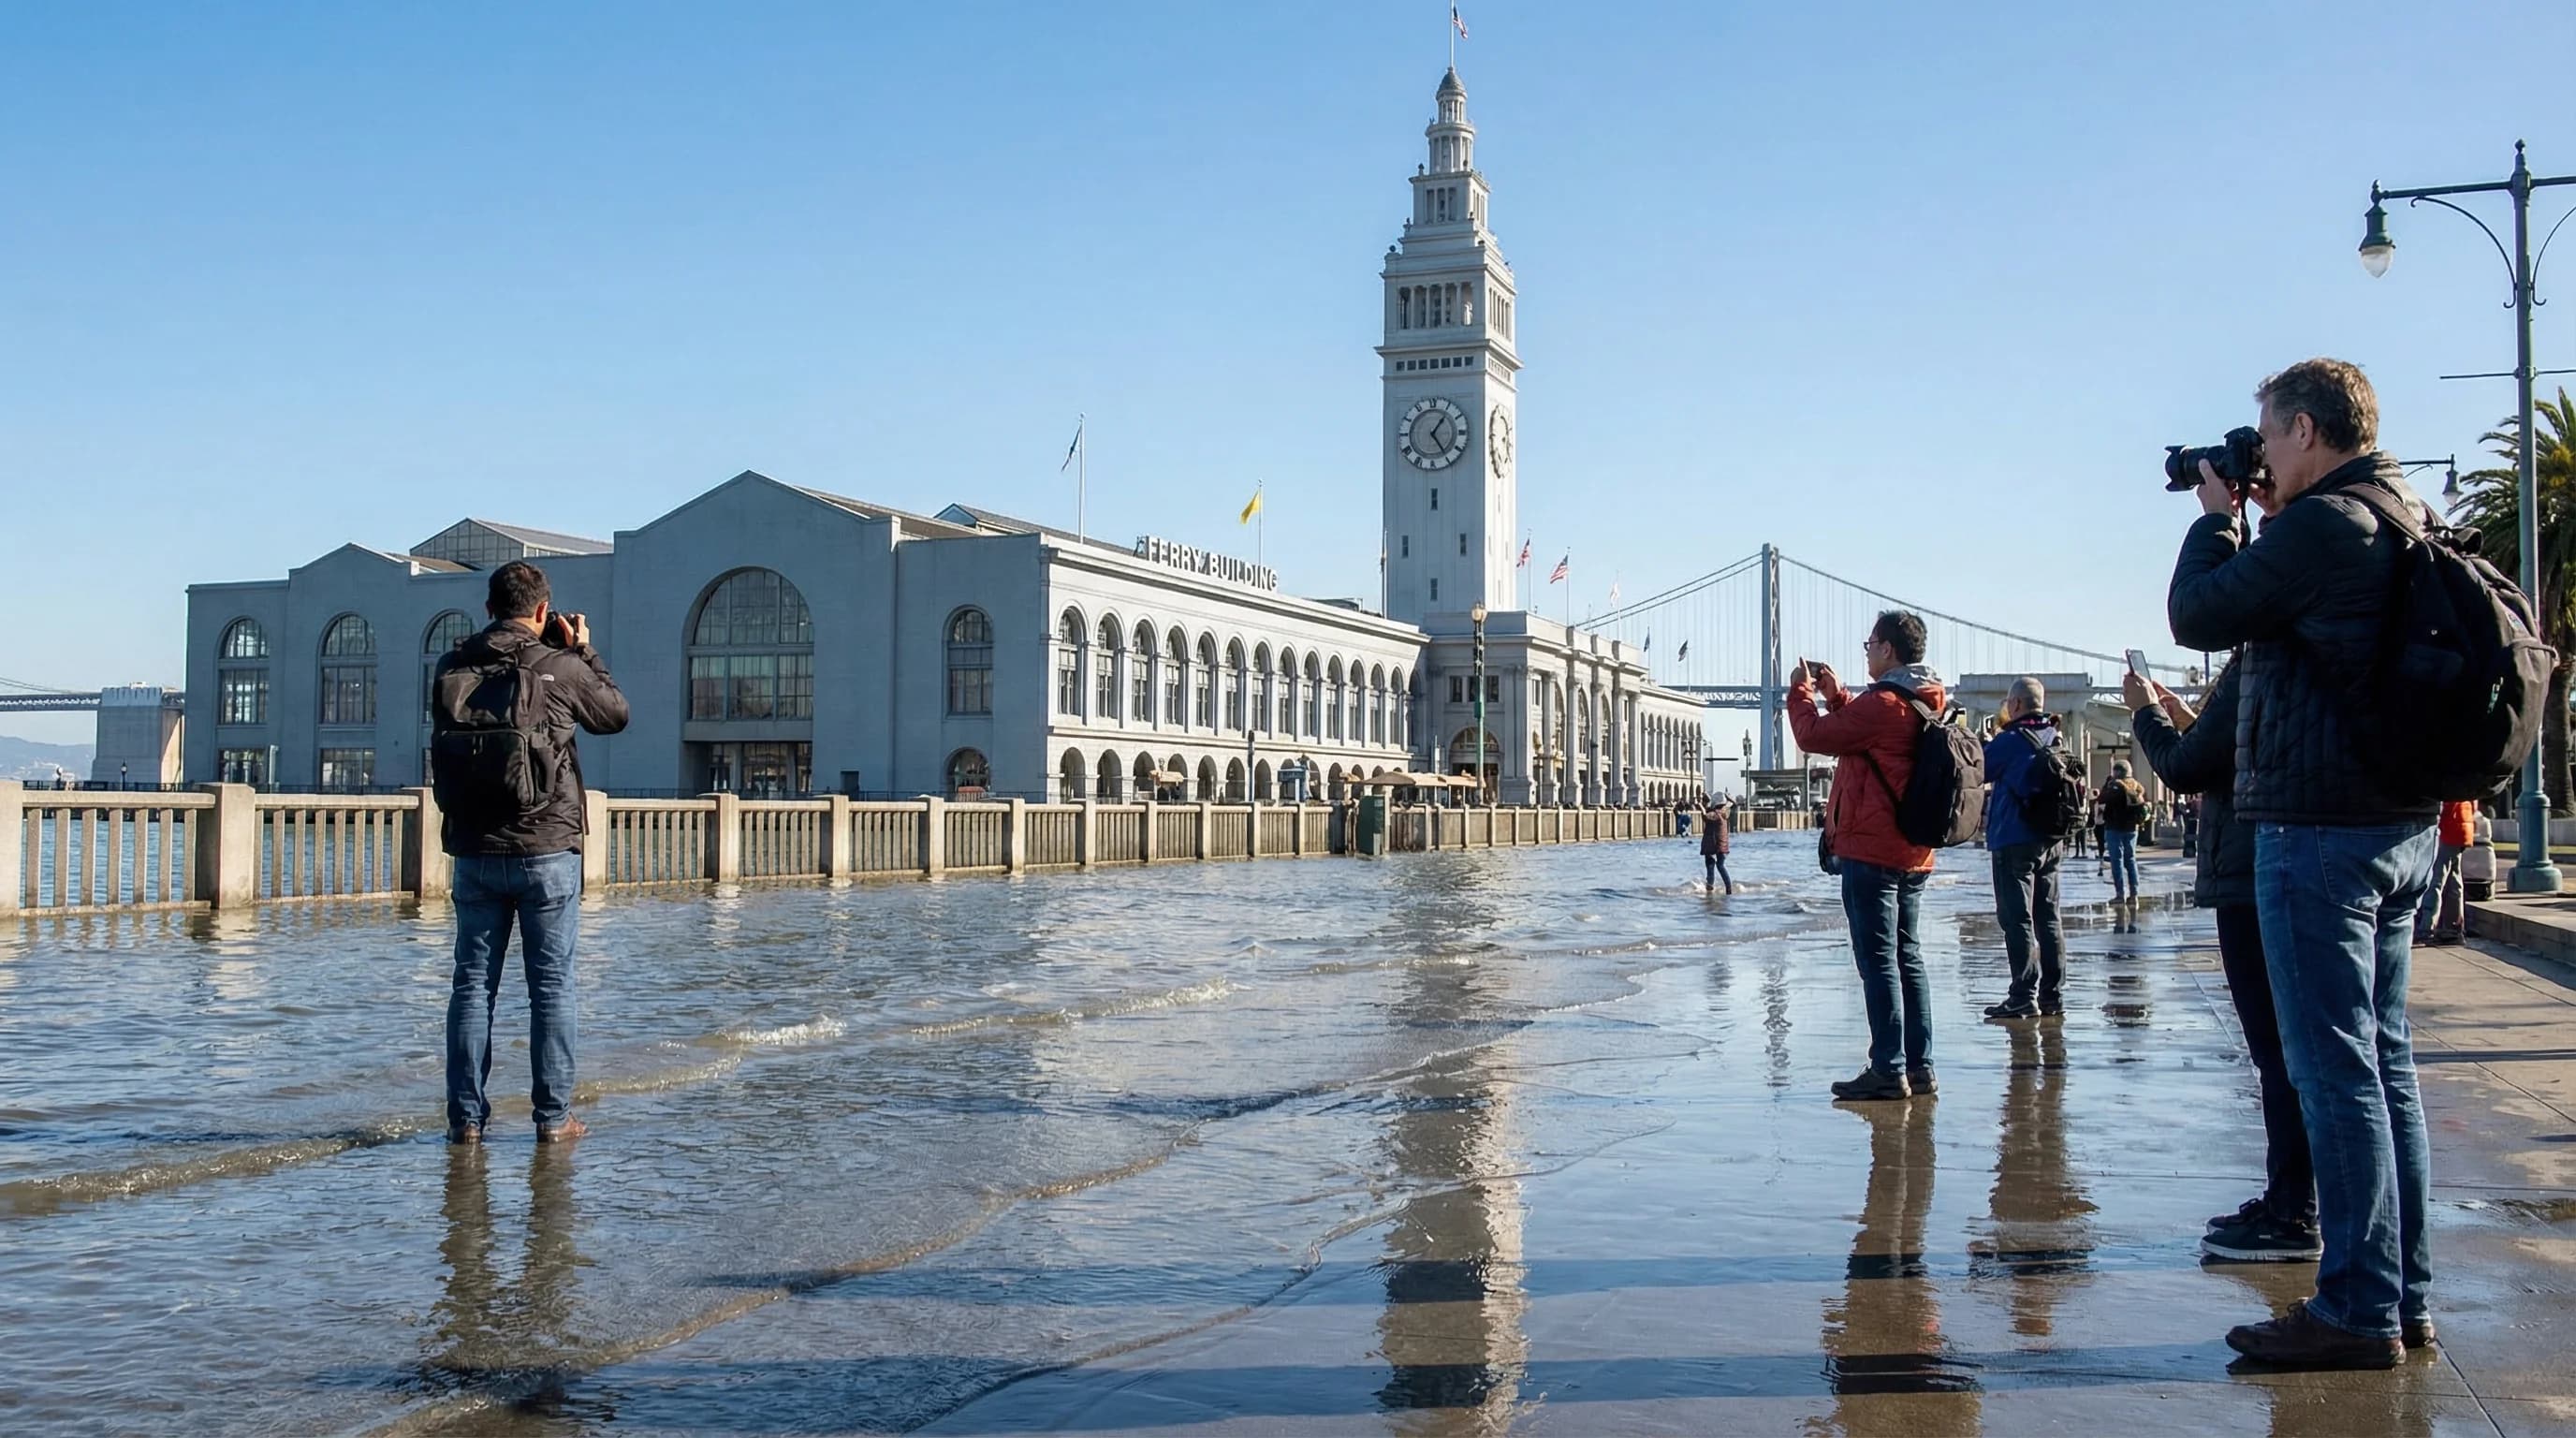
King tides flood Bay Area streets a few times each year without any storm. Alviso, Foster City, and the Embarcadero are among the first to go under. More importantly, today's king tide is tomorrow's normal high tide as sea levels rise.
7min read →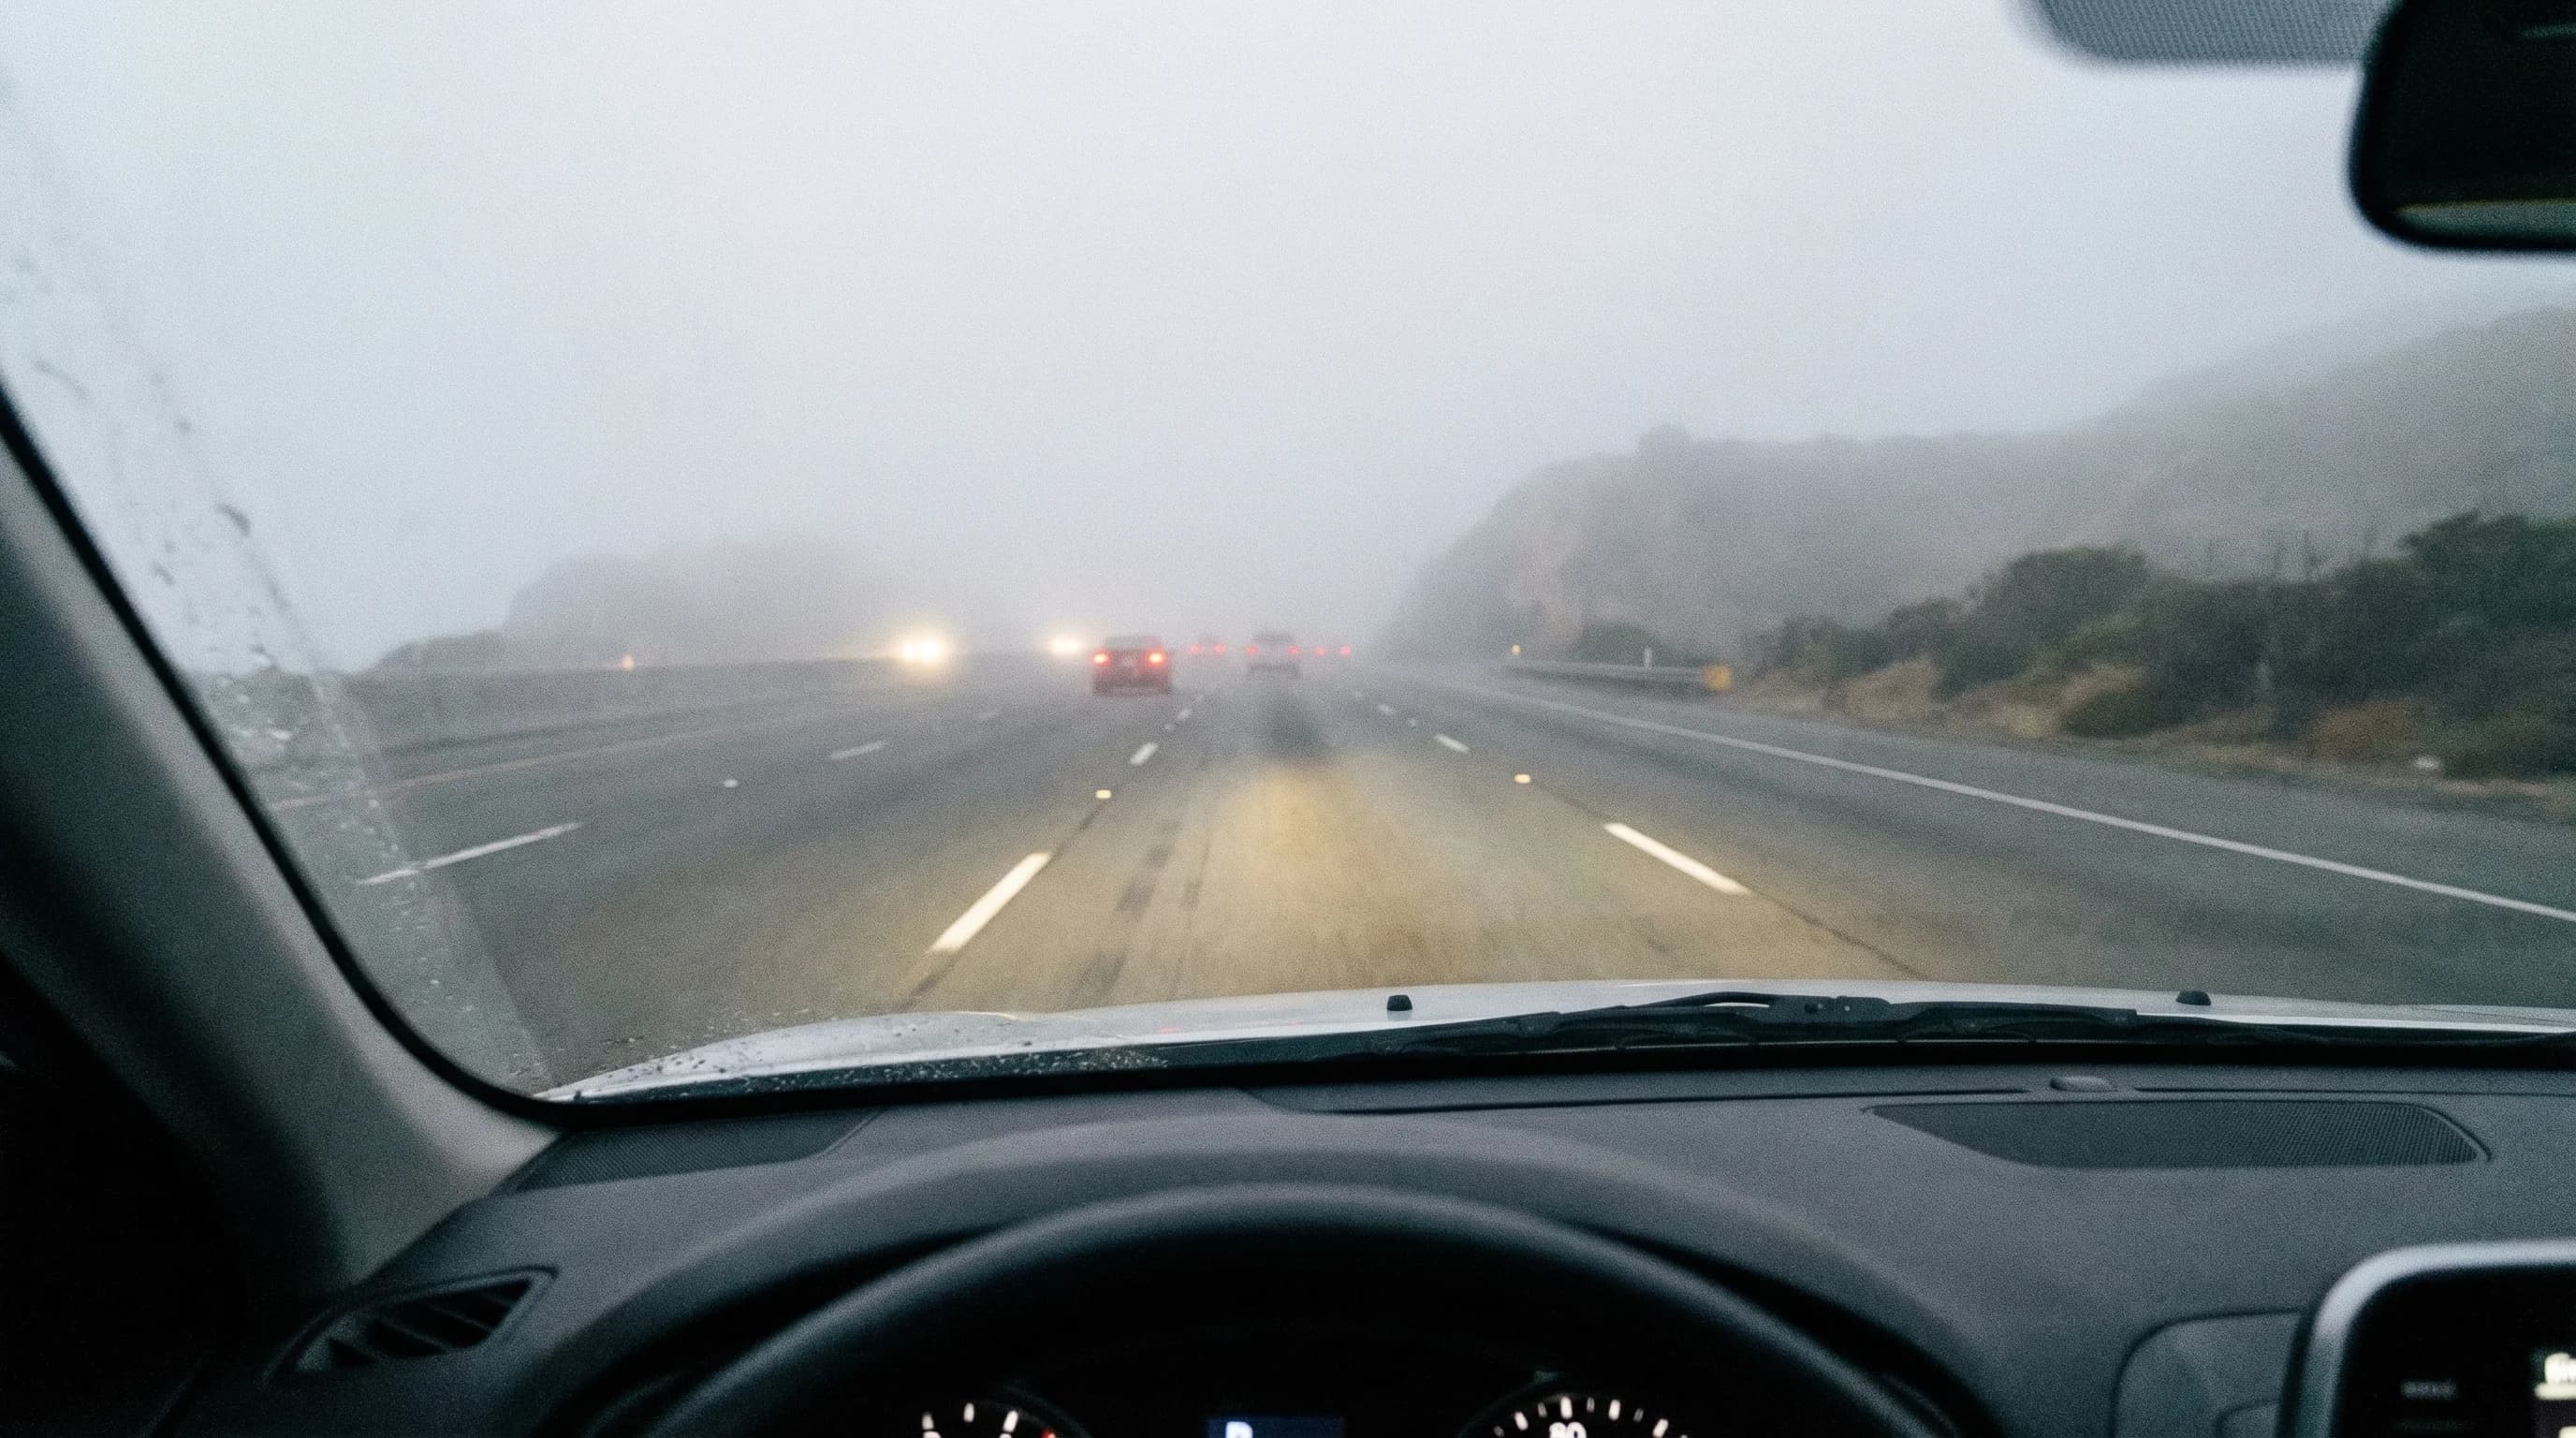
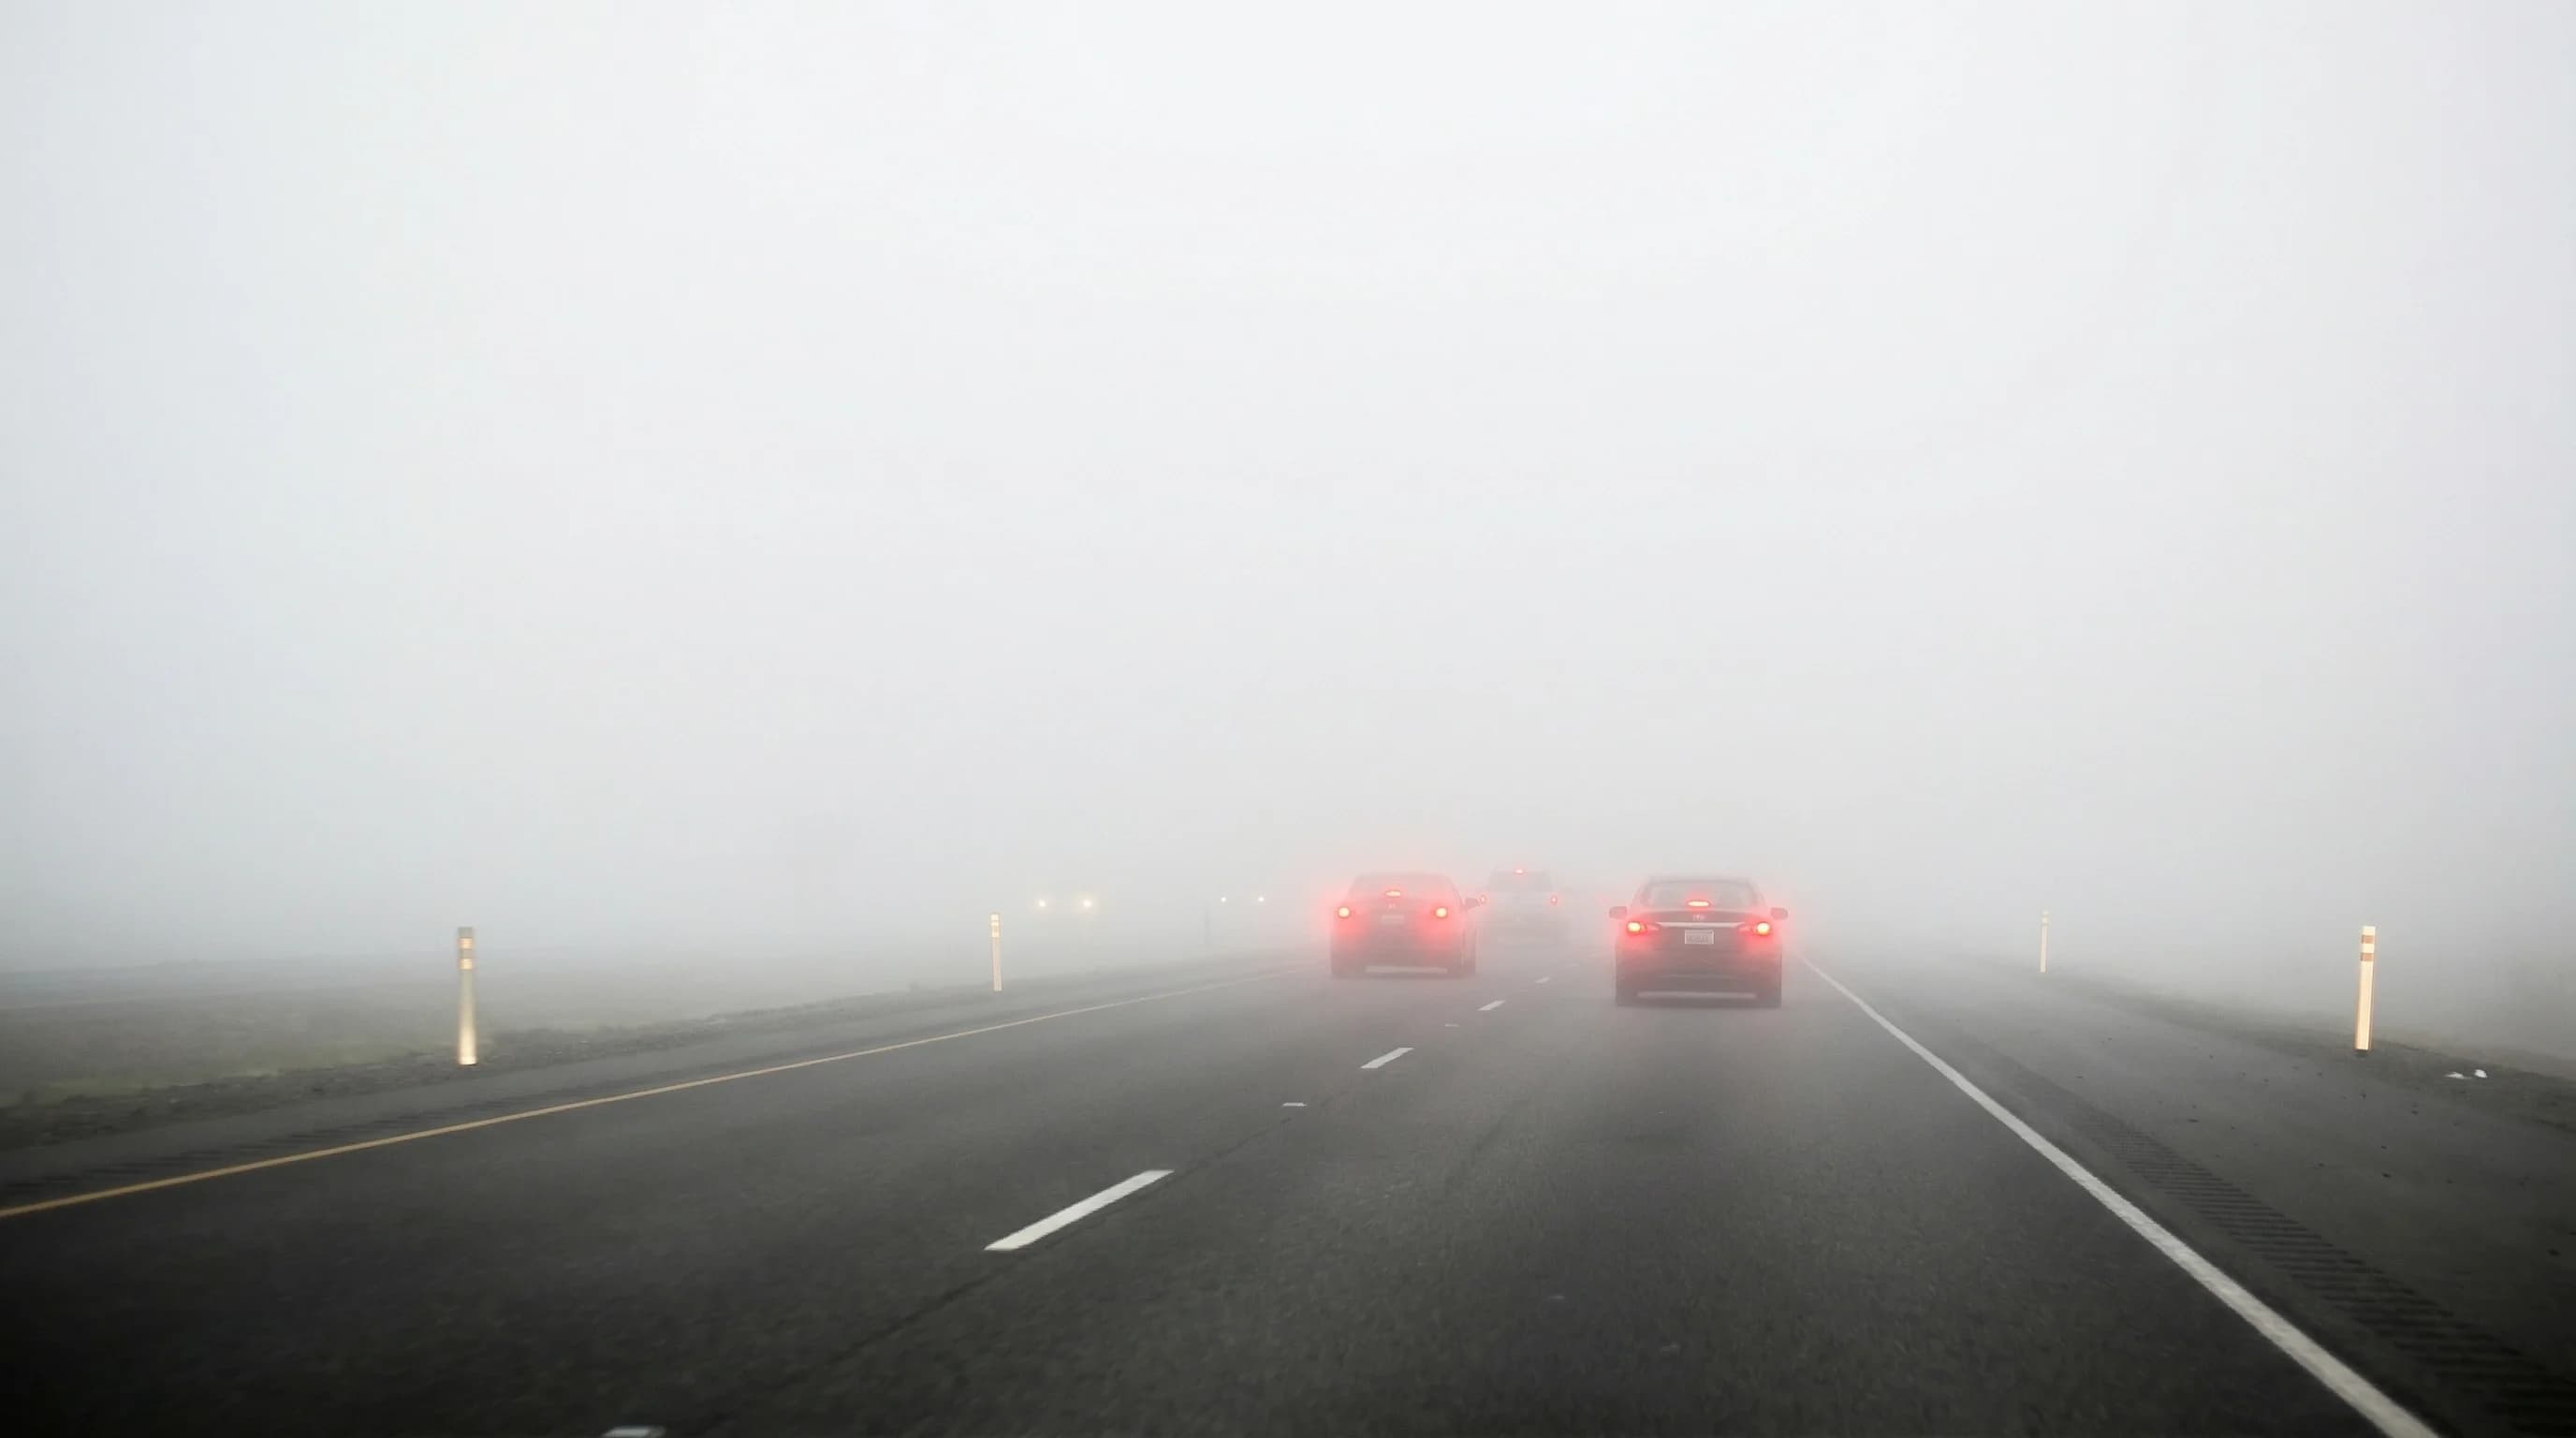
Bay Area marine layer fog can drop highway visibility to 200 feet. Here are the safety rules that matter most, from headlight use to following distance to the foggiest routes.
7min read →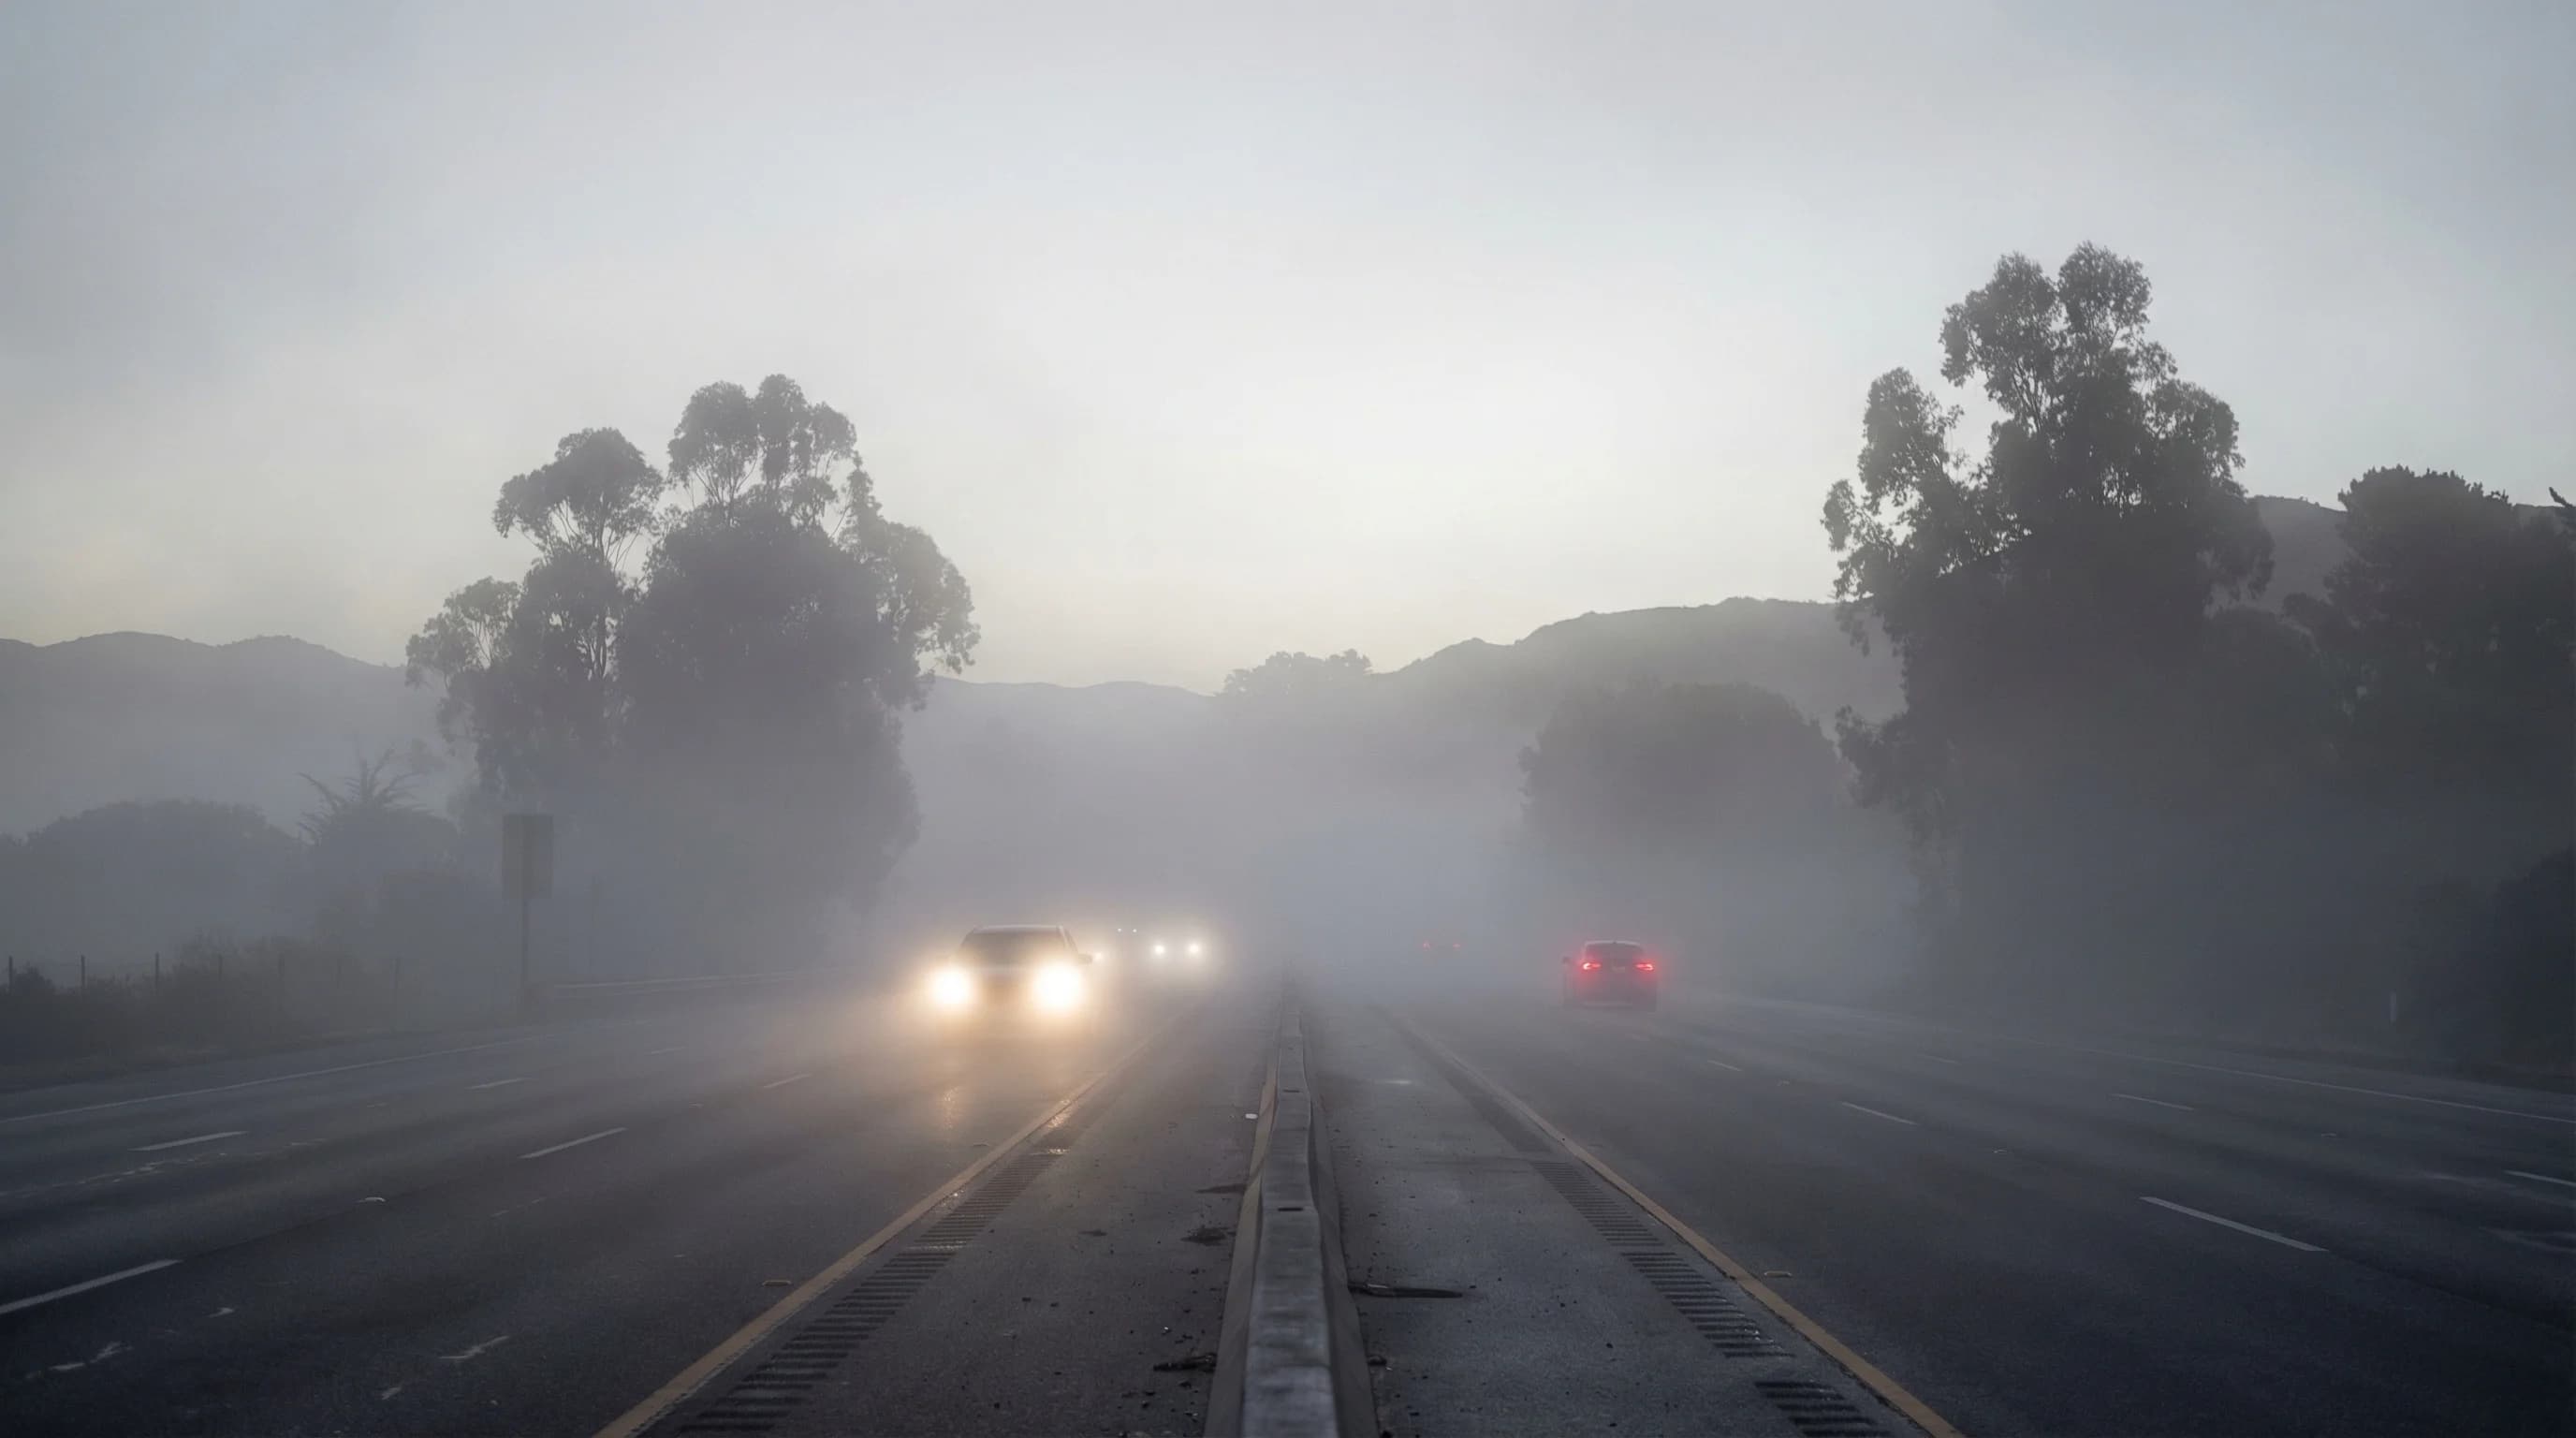
A Dense Fog Advisory means visibility under a quarter mile for at least two hours. Bay Area advisories most often cover inland valleys in winter or Bay-area coastal corridors when the marine layer is especially thick.
6min read →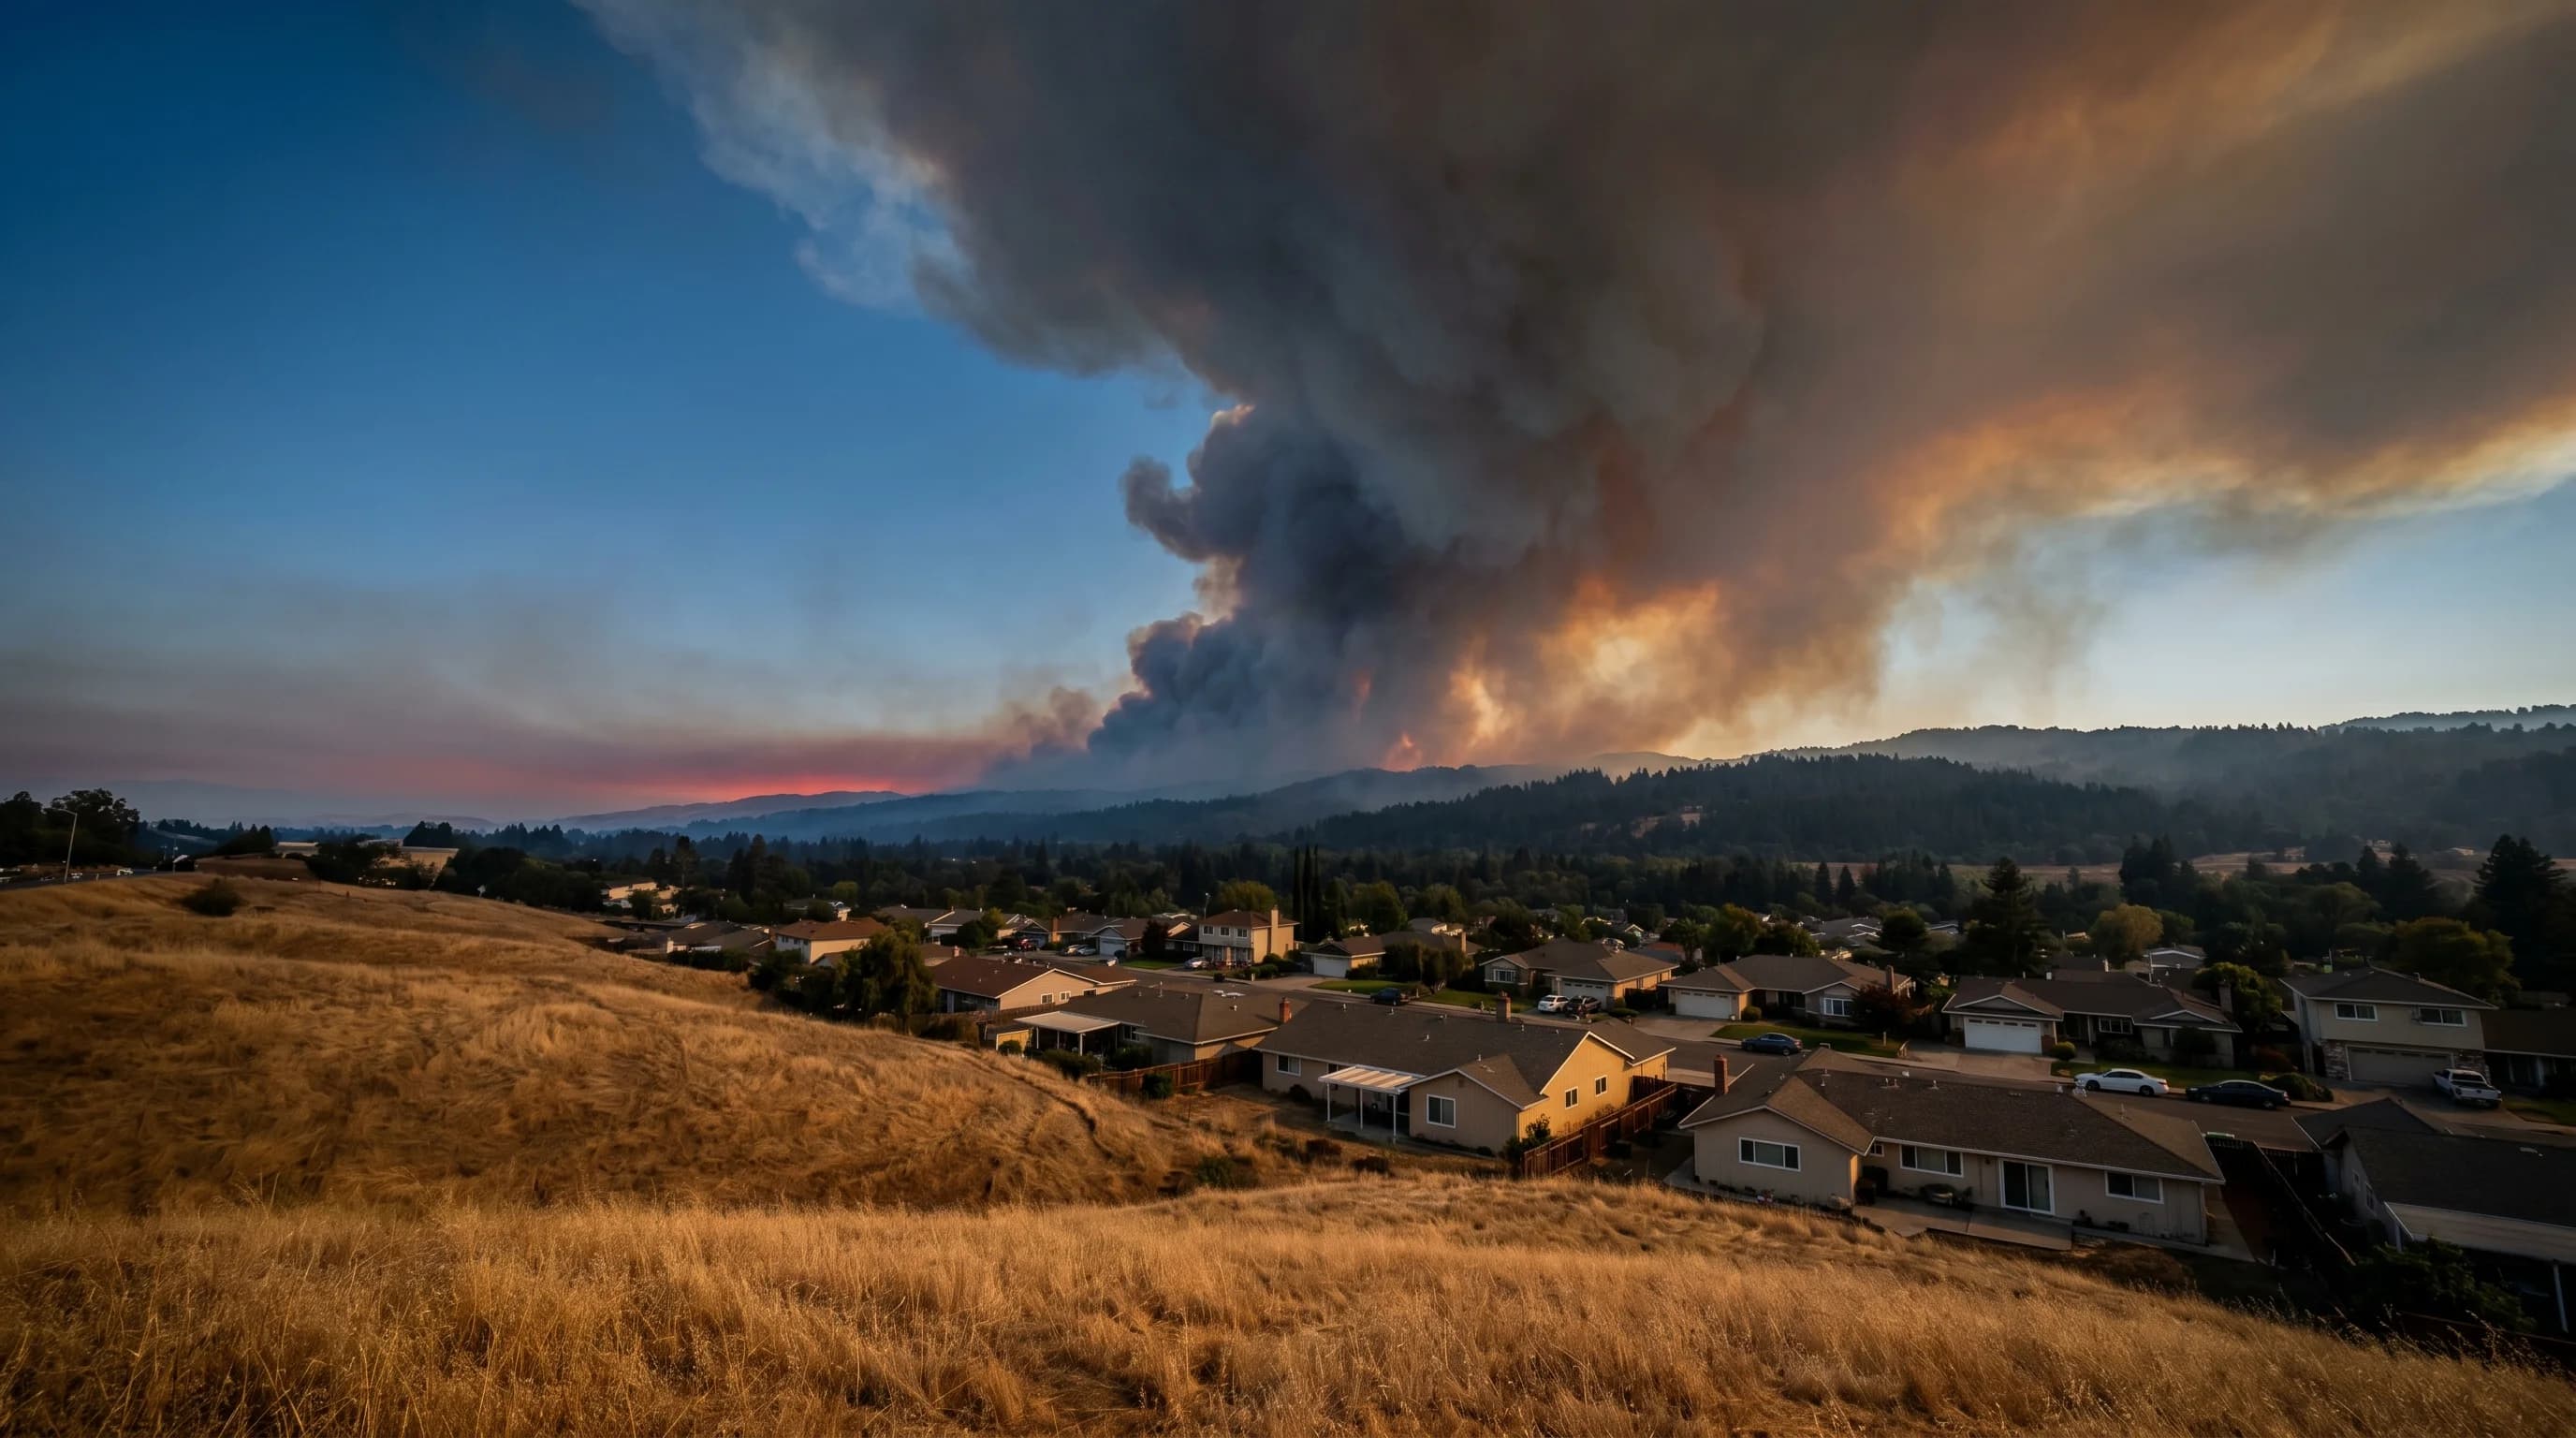
Bay Area fire season peaks in September-November when drought-dry vegetation meets Diablo wind events. The Tubbs, Kincade, and 1991 Oakland Hills fires all struck during fall offshore wind conditions.
8min read →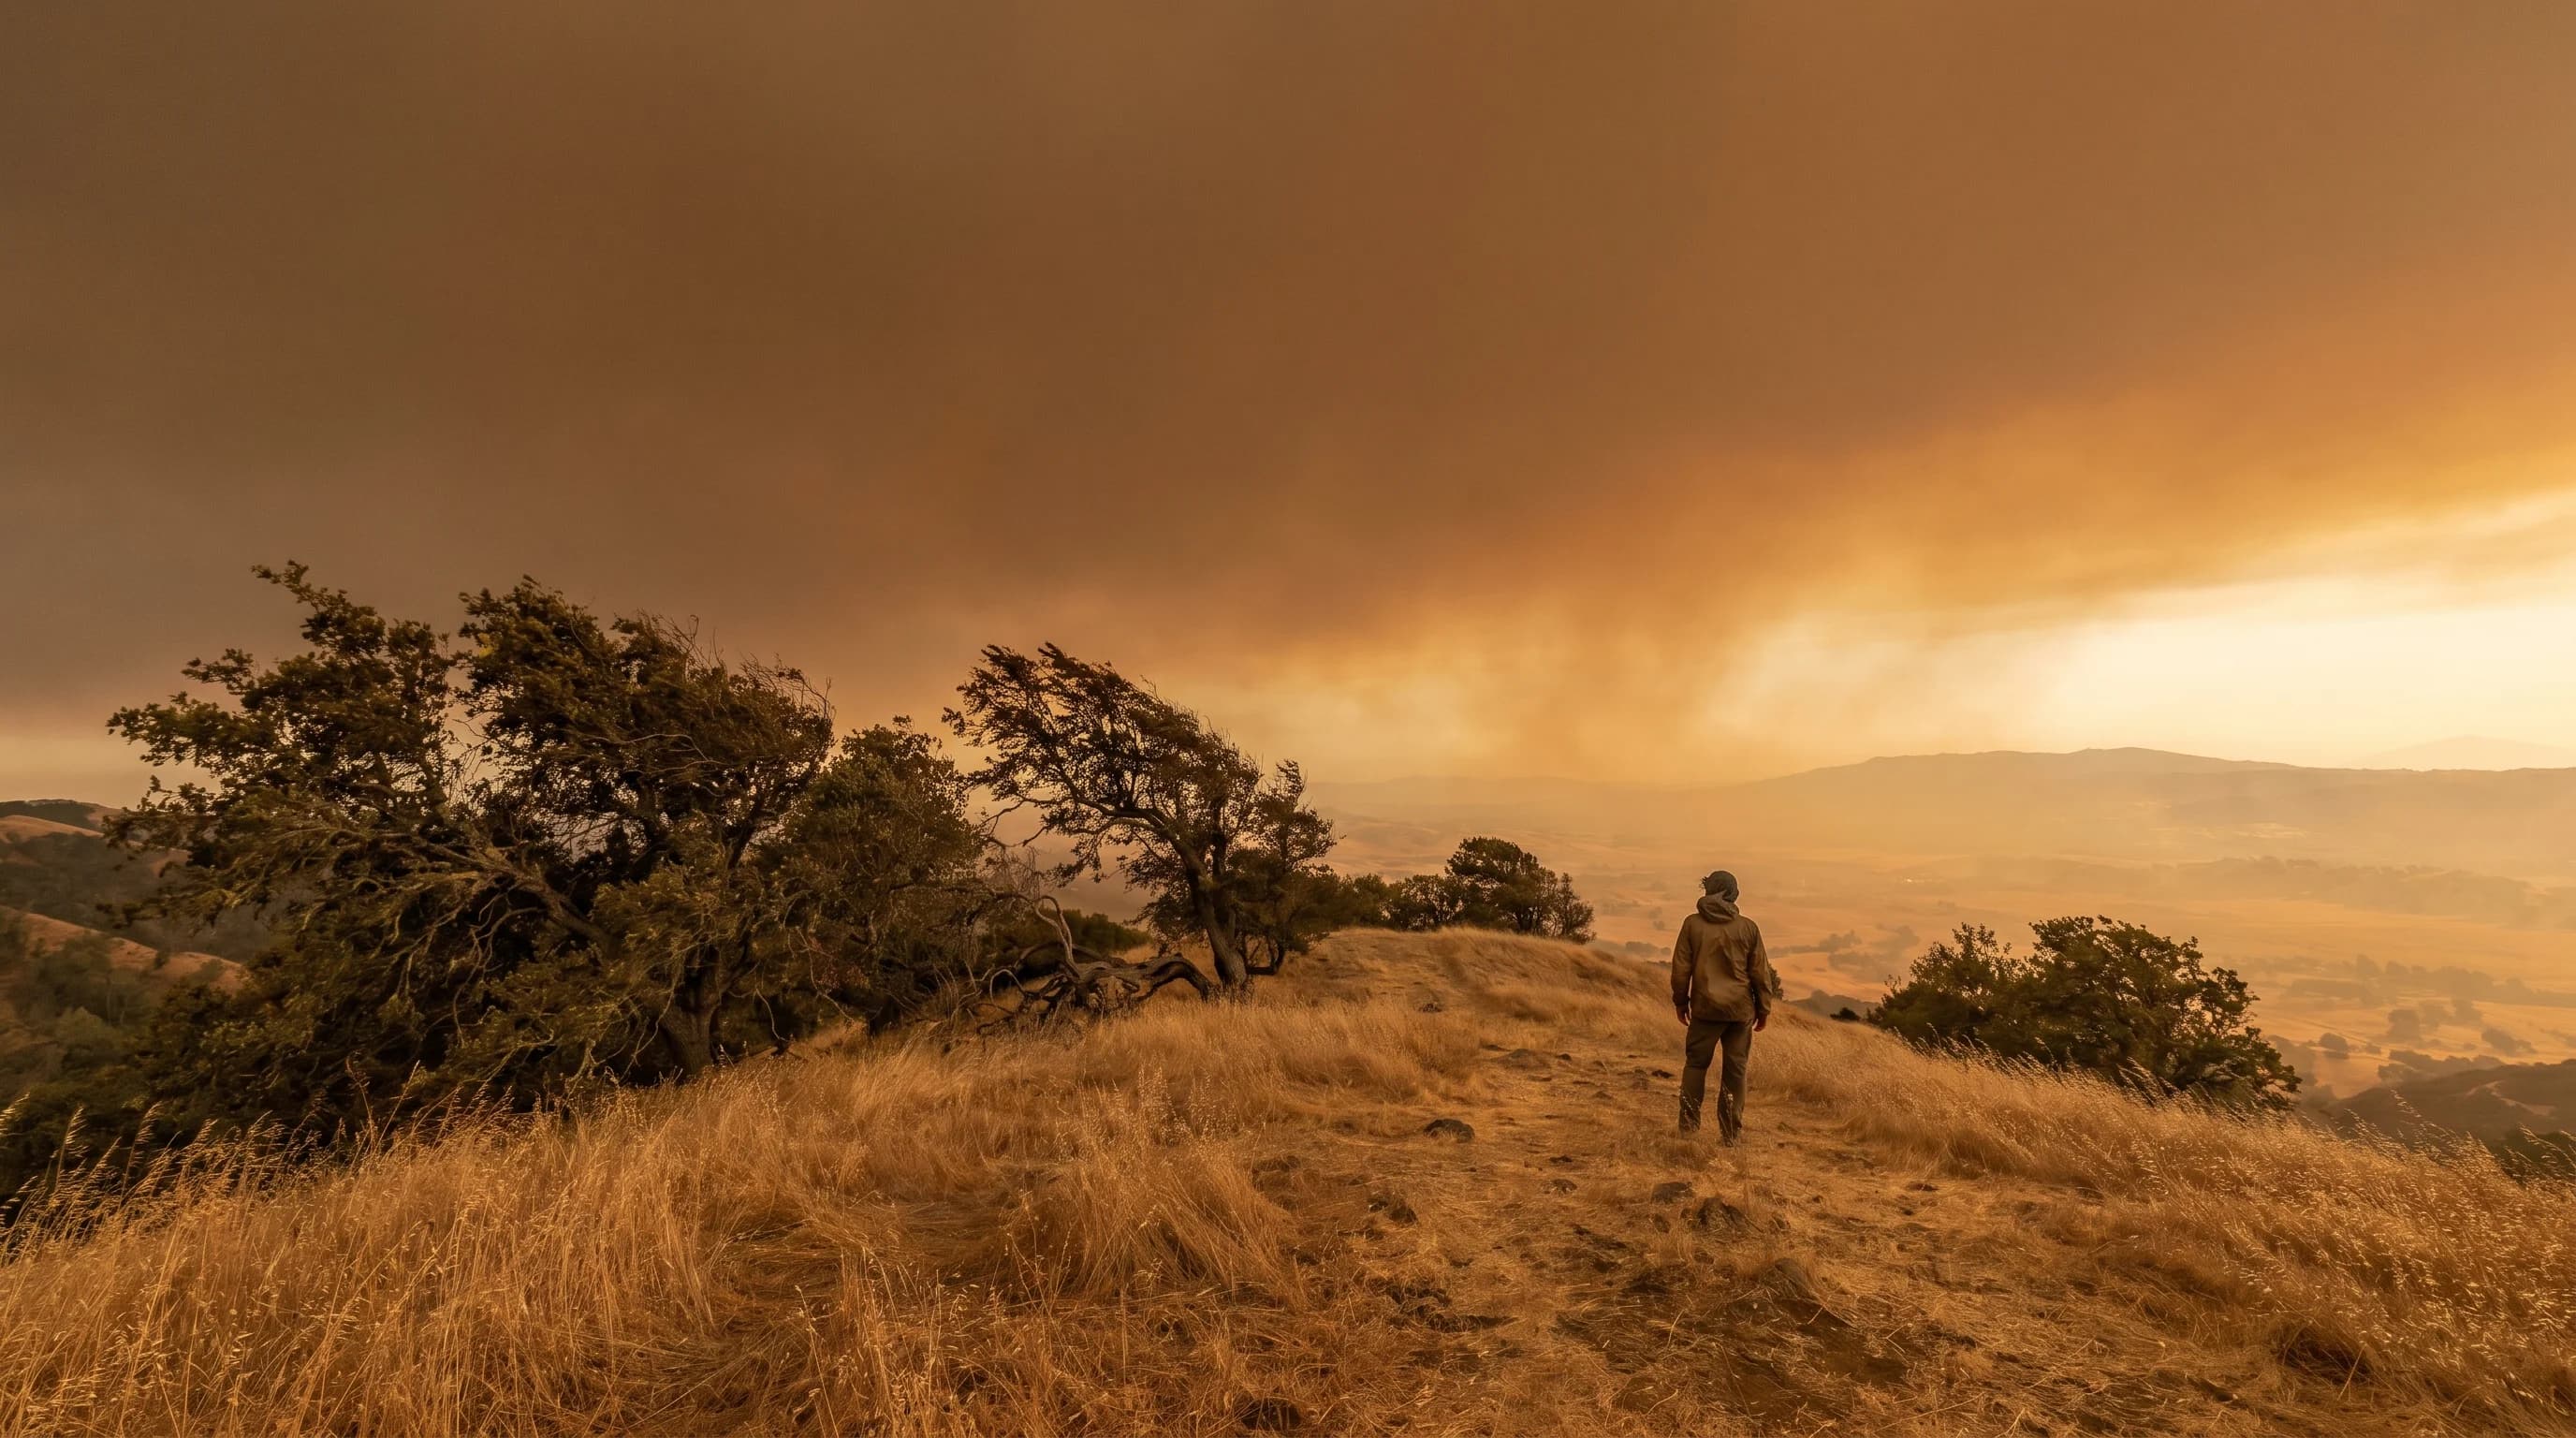
A fire weather warning means the NWS has identified conditions capable of producing extreme wildfire behavior. In the Bay Area, these alerts are tied to specific humidity, wind, and fuel moisture thresholds.
7min read →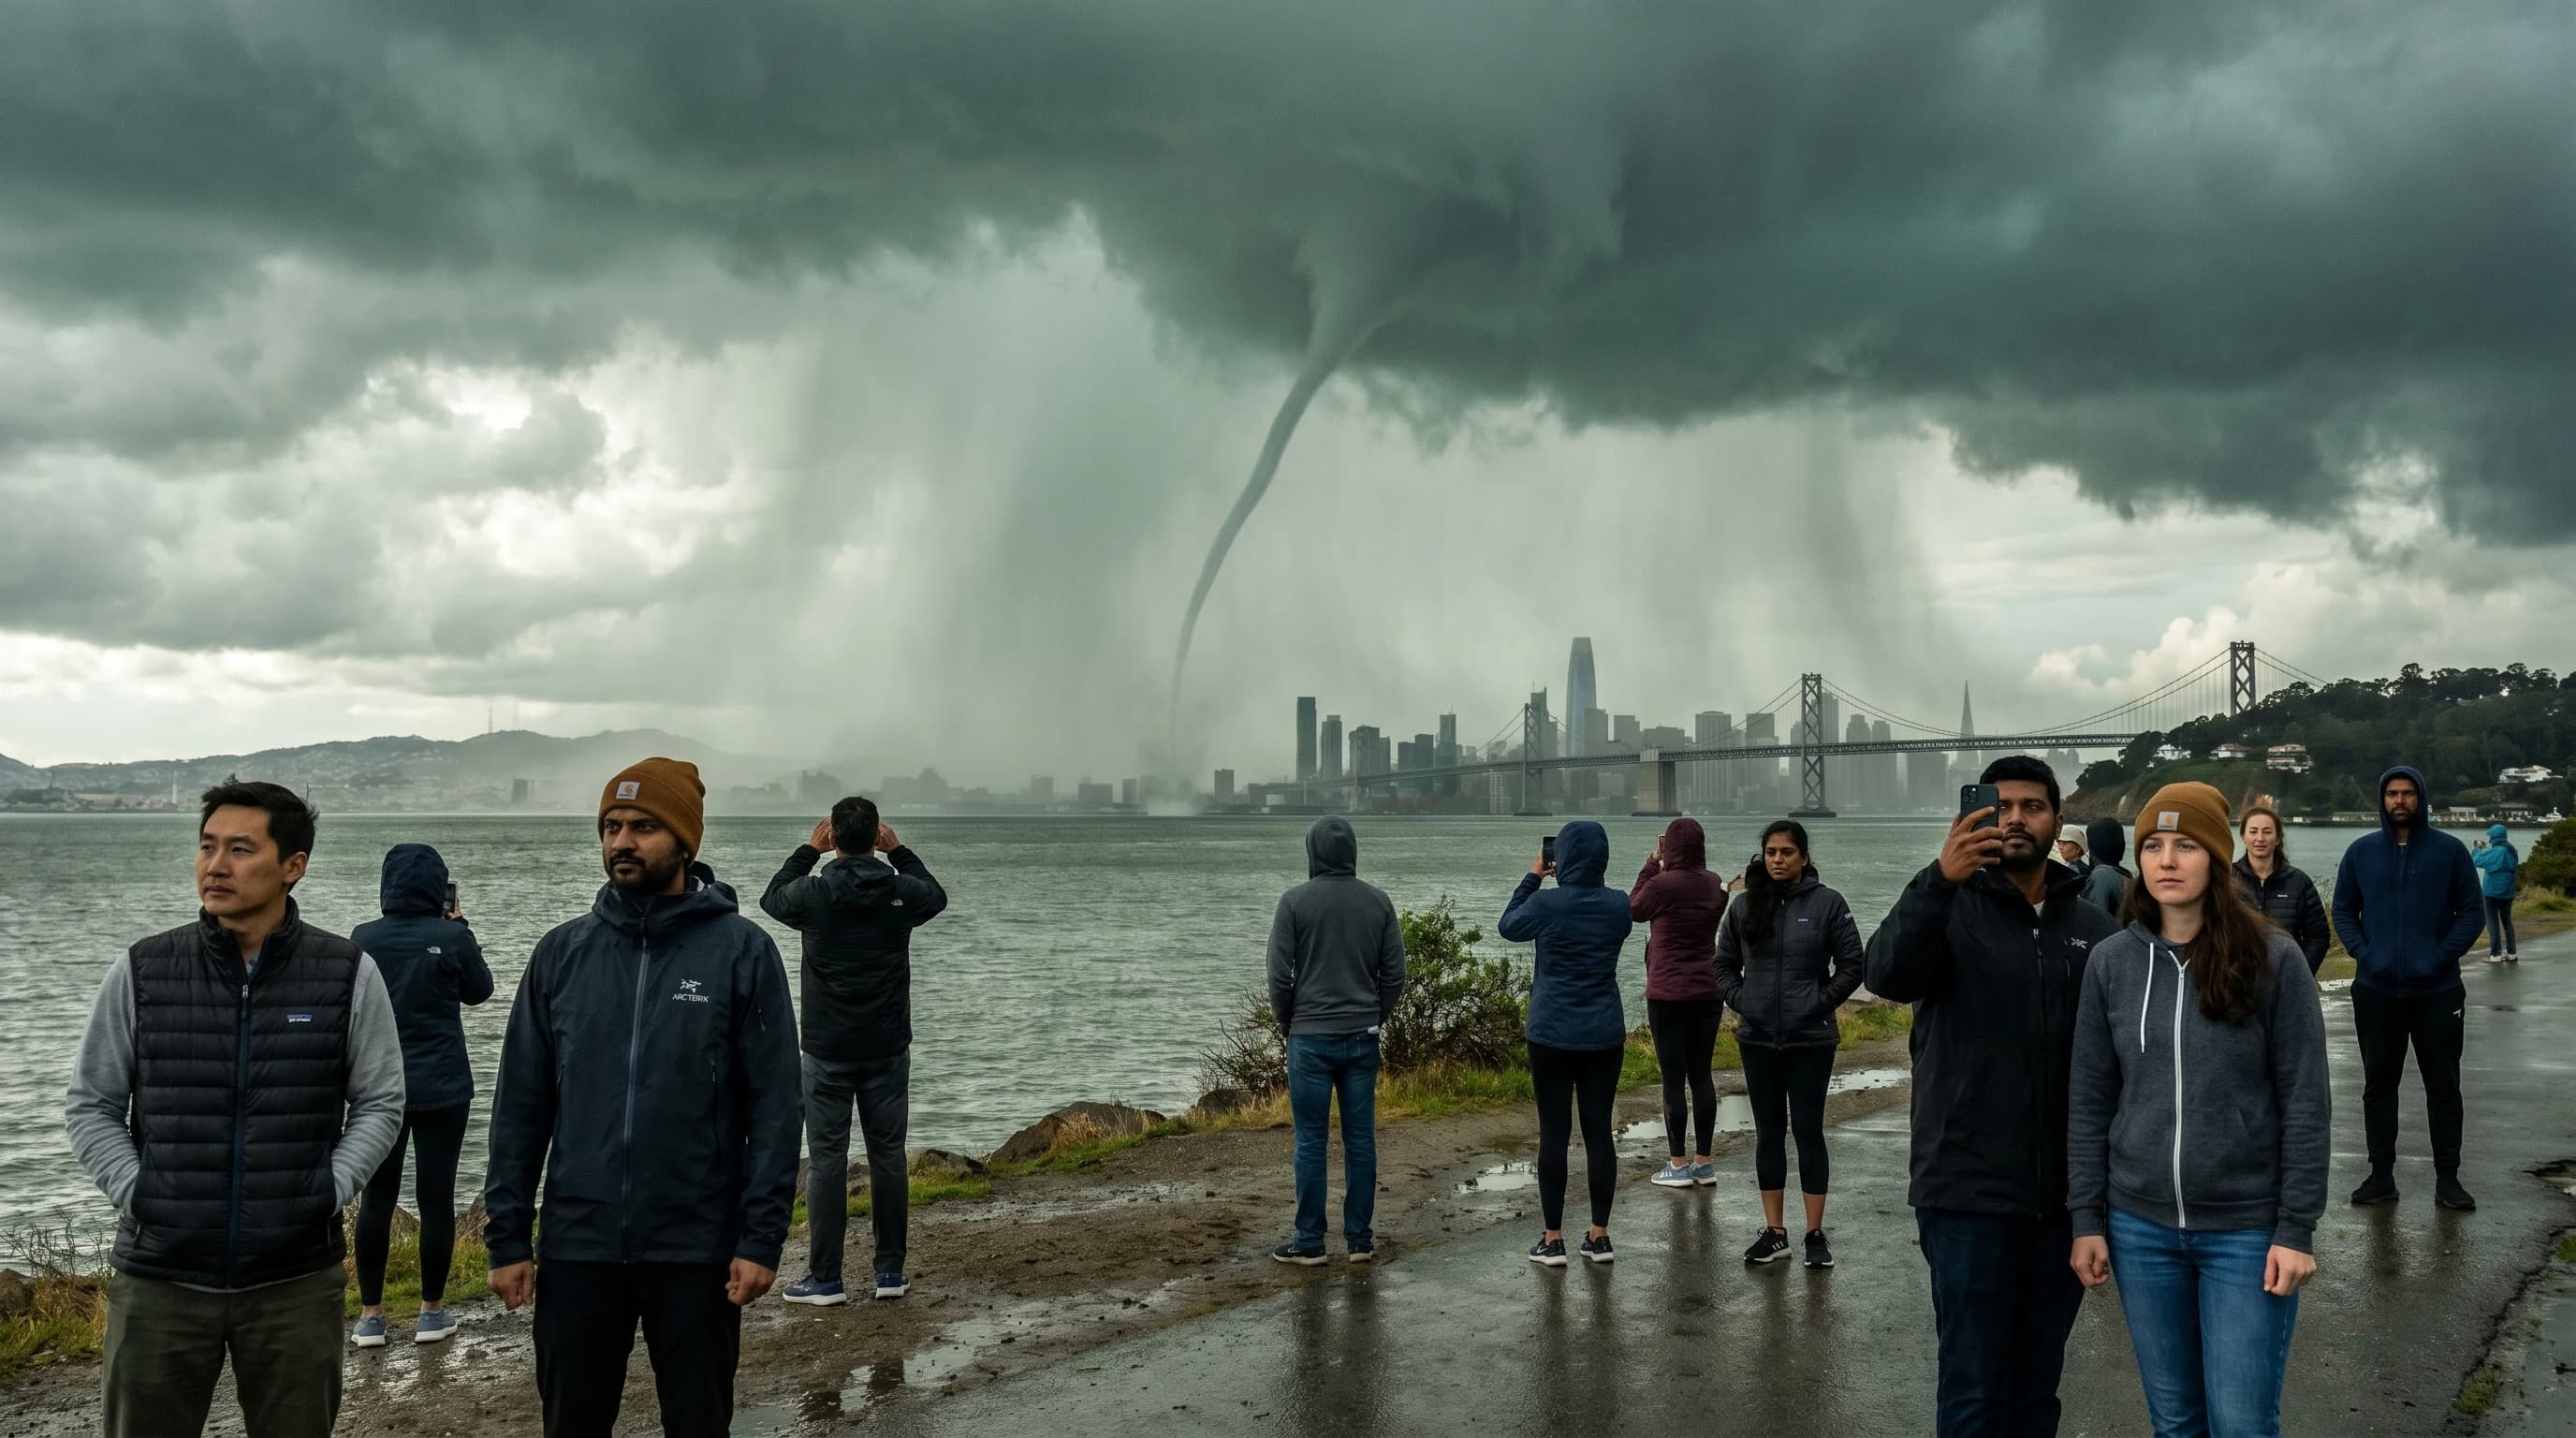
Bay Area tornadoes are real but rare and weak: fewer than one per year, almost all EF0. Tornado warnings do get issued during winter storms. Here is what they mean.
6min read →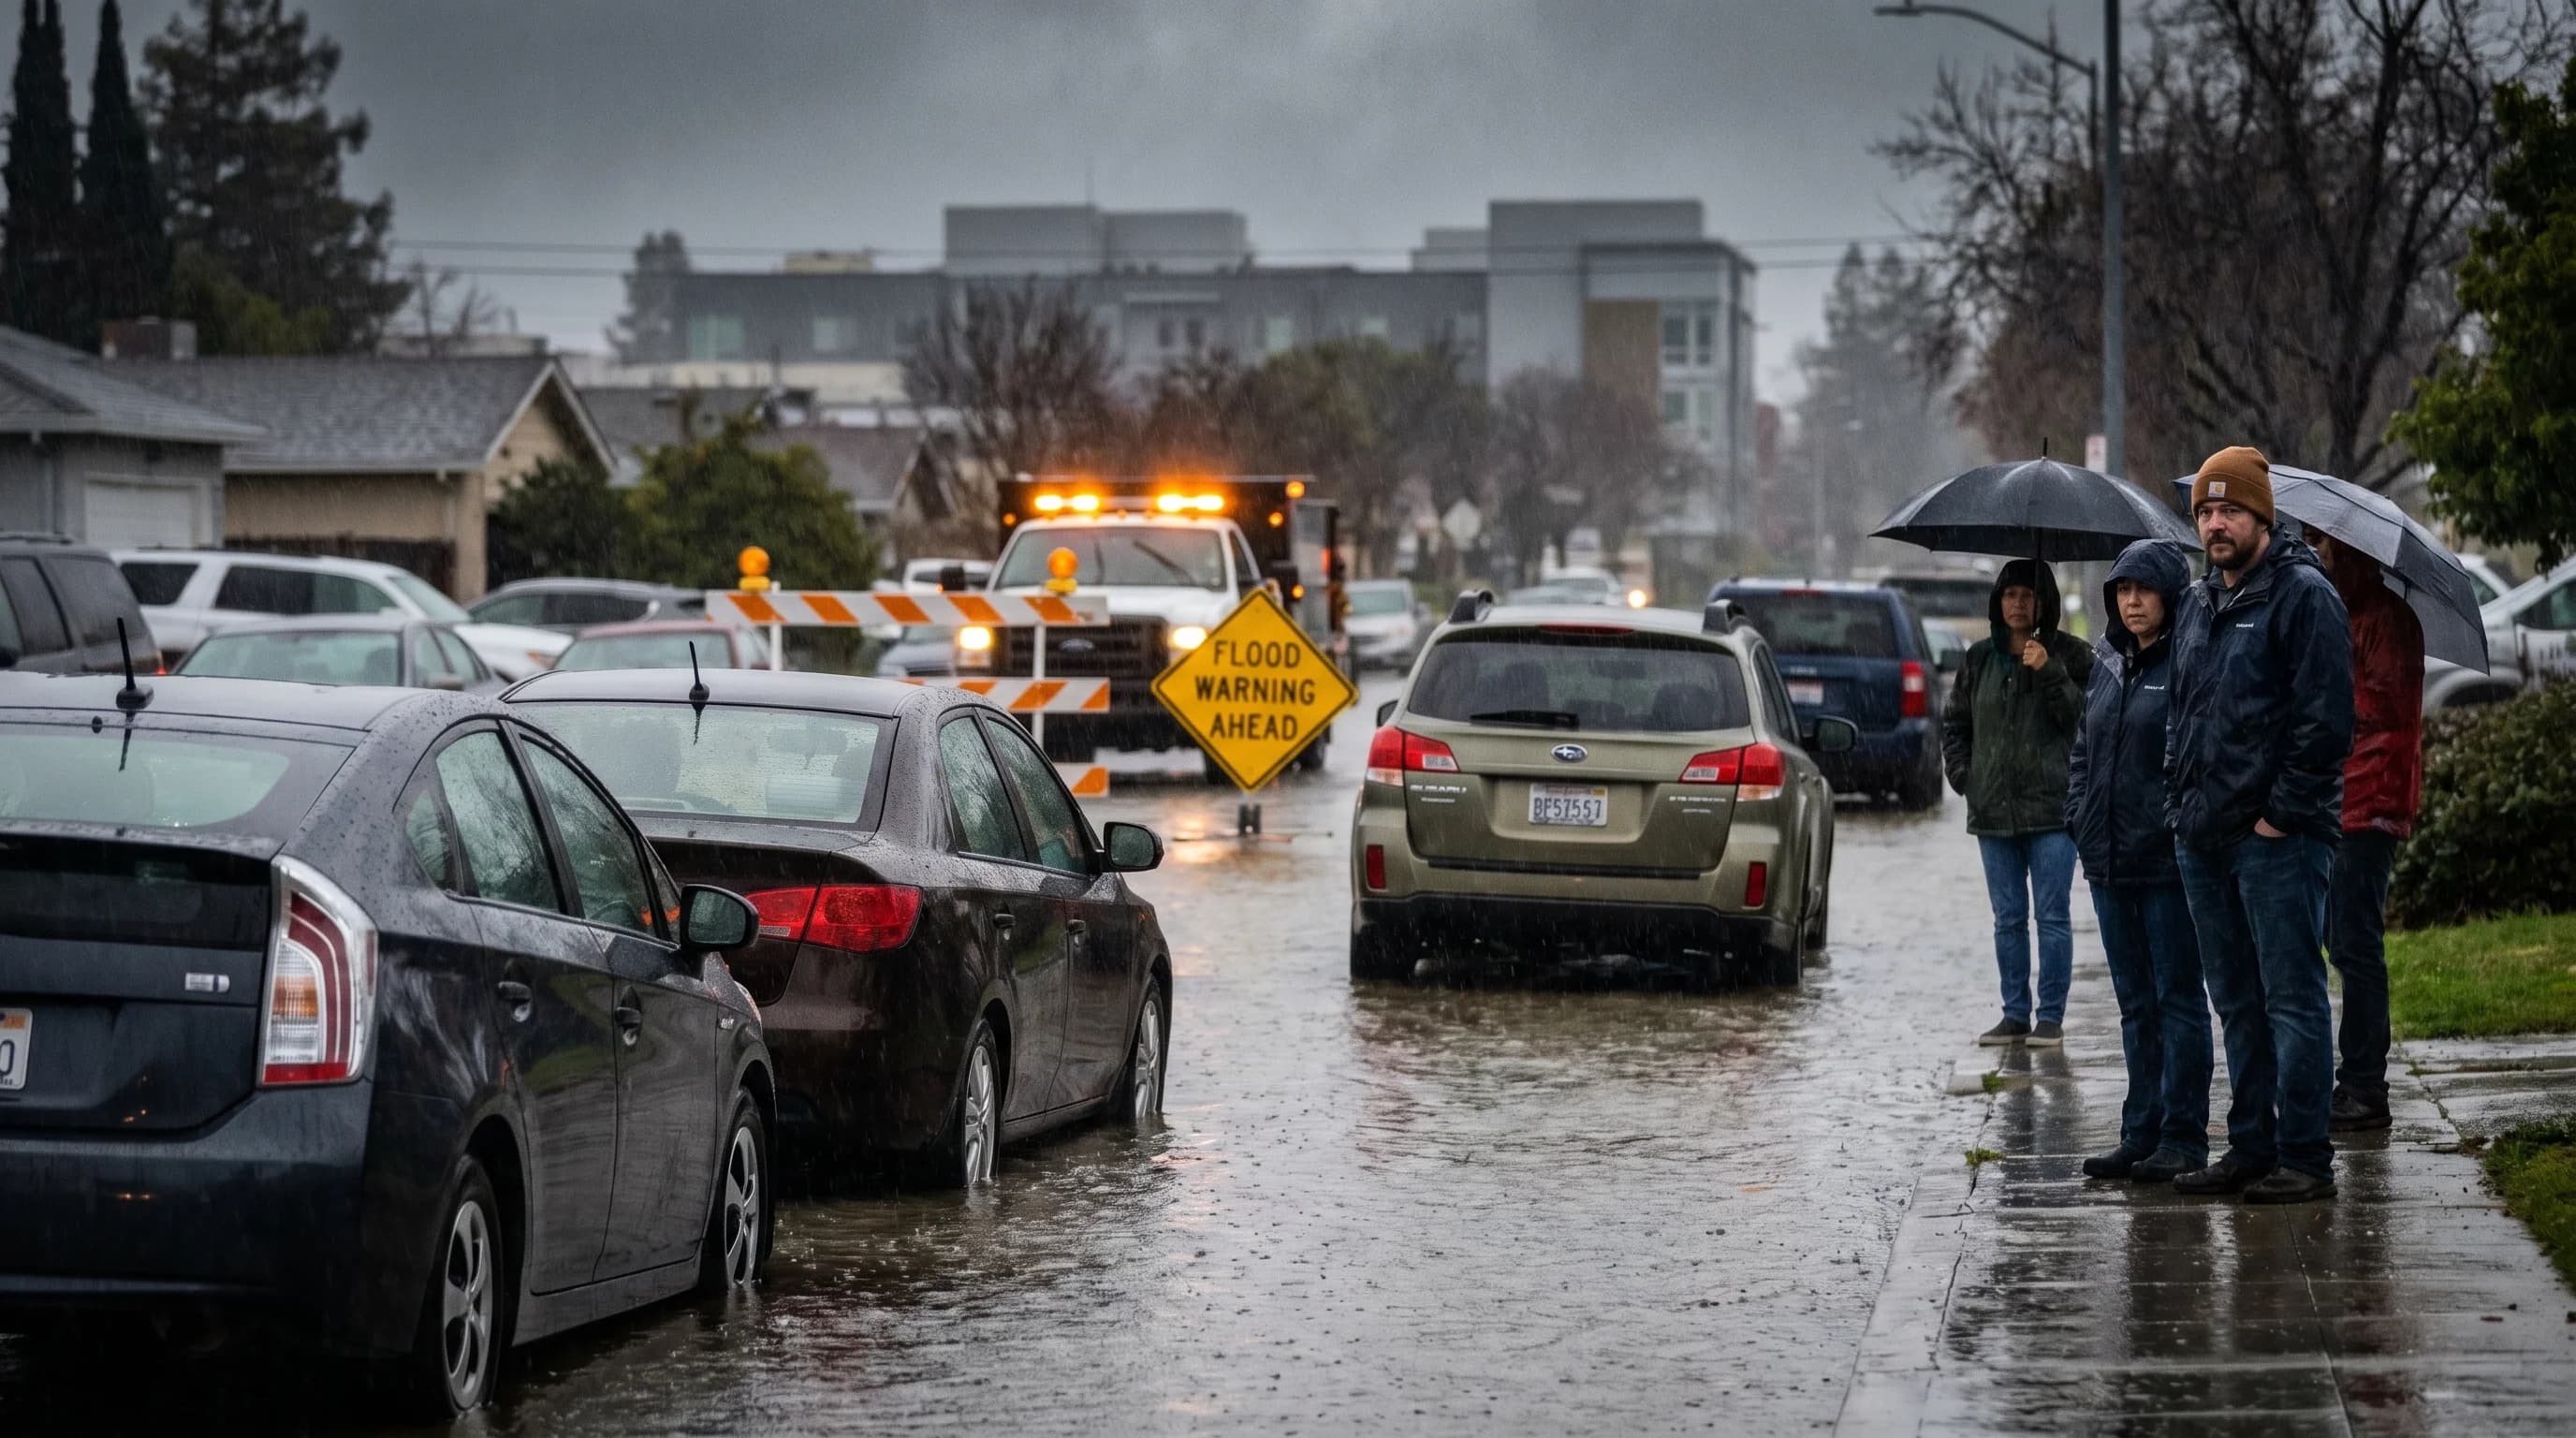
A flood advisory means minor flooding is occurring or expected. A flood warning means significant flooding is imminent. Know the difference and where Bay Area floods hit hardest.
7min read →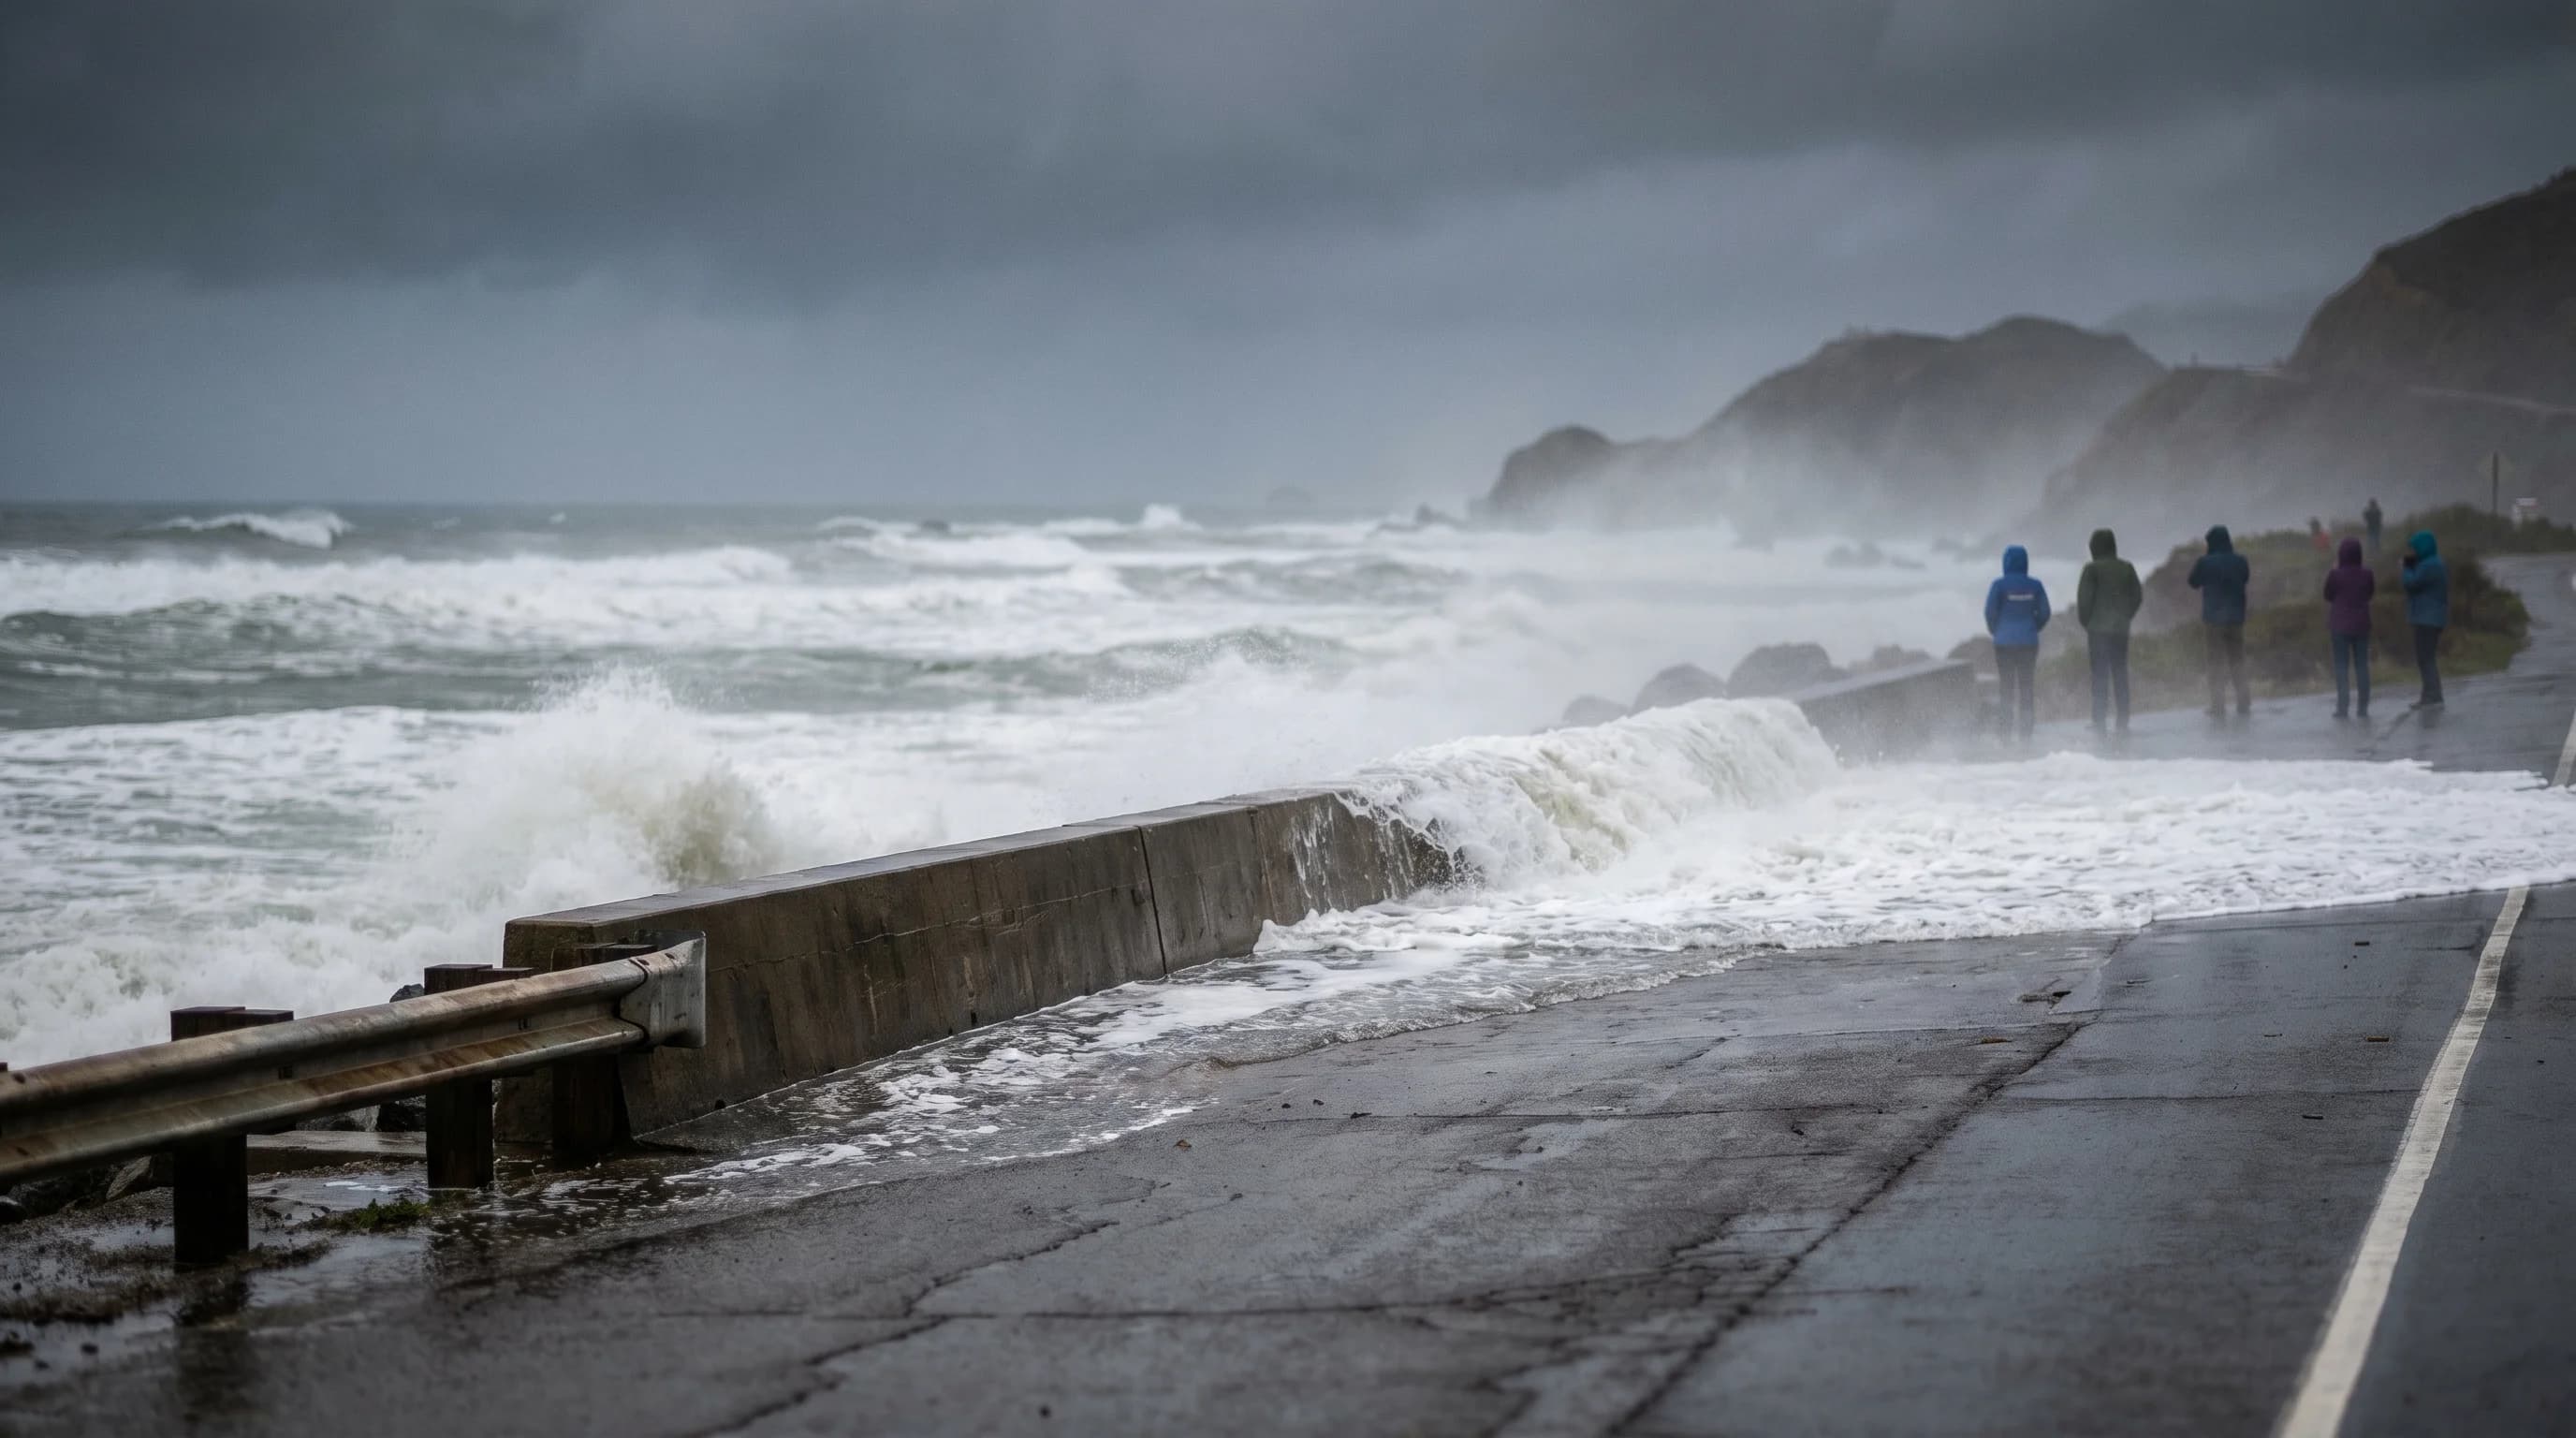
A coastal flood advisory is the lowest of three NWS alert levels for ocean water threatening to push onto shore. Learn the difference between advisory, watch, and warning.
7min read →Category
Practical advice on what to pack and how to dress for Bay Area weather.
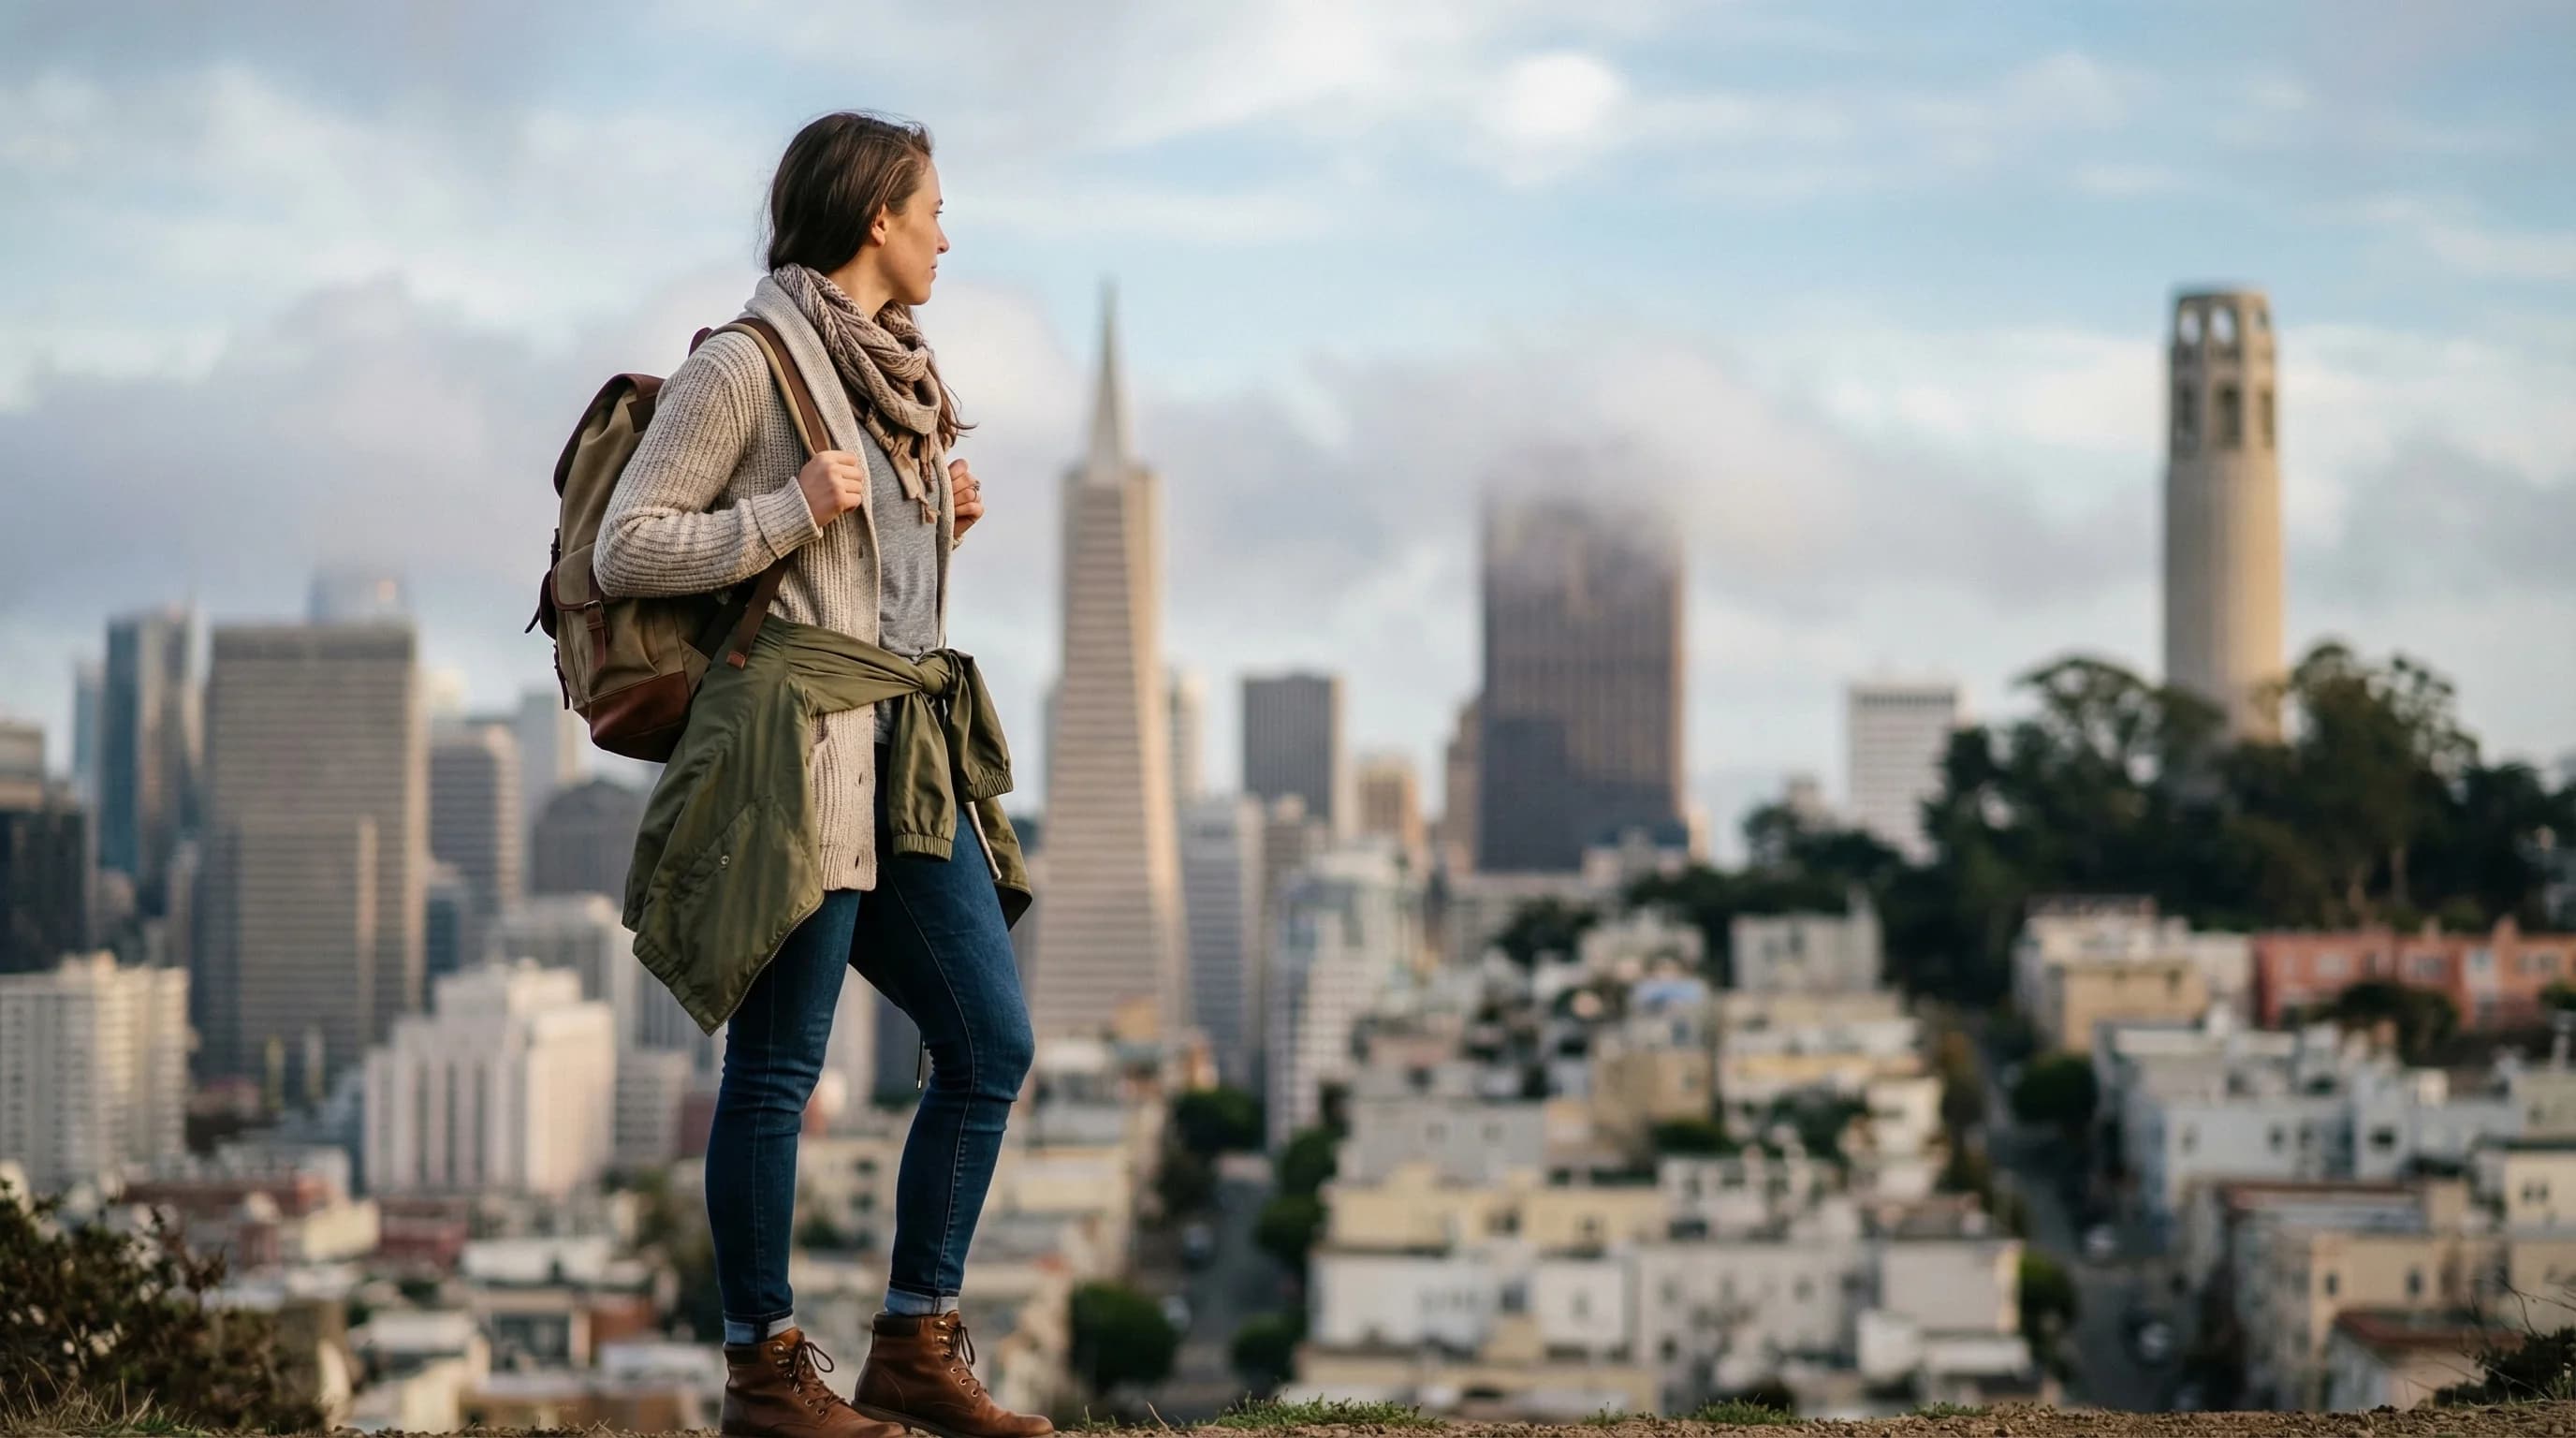
San Francisco's daily temperature swings and year-round fog make packing tricky. The answer is always layers, but the specific combination changes by month. Here is what to bring.
5min read →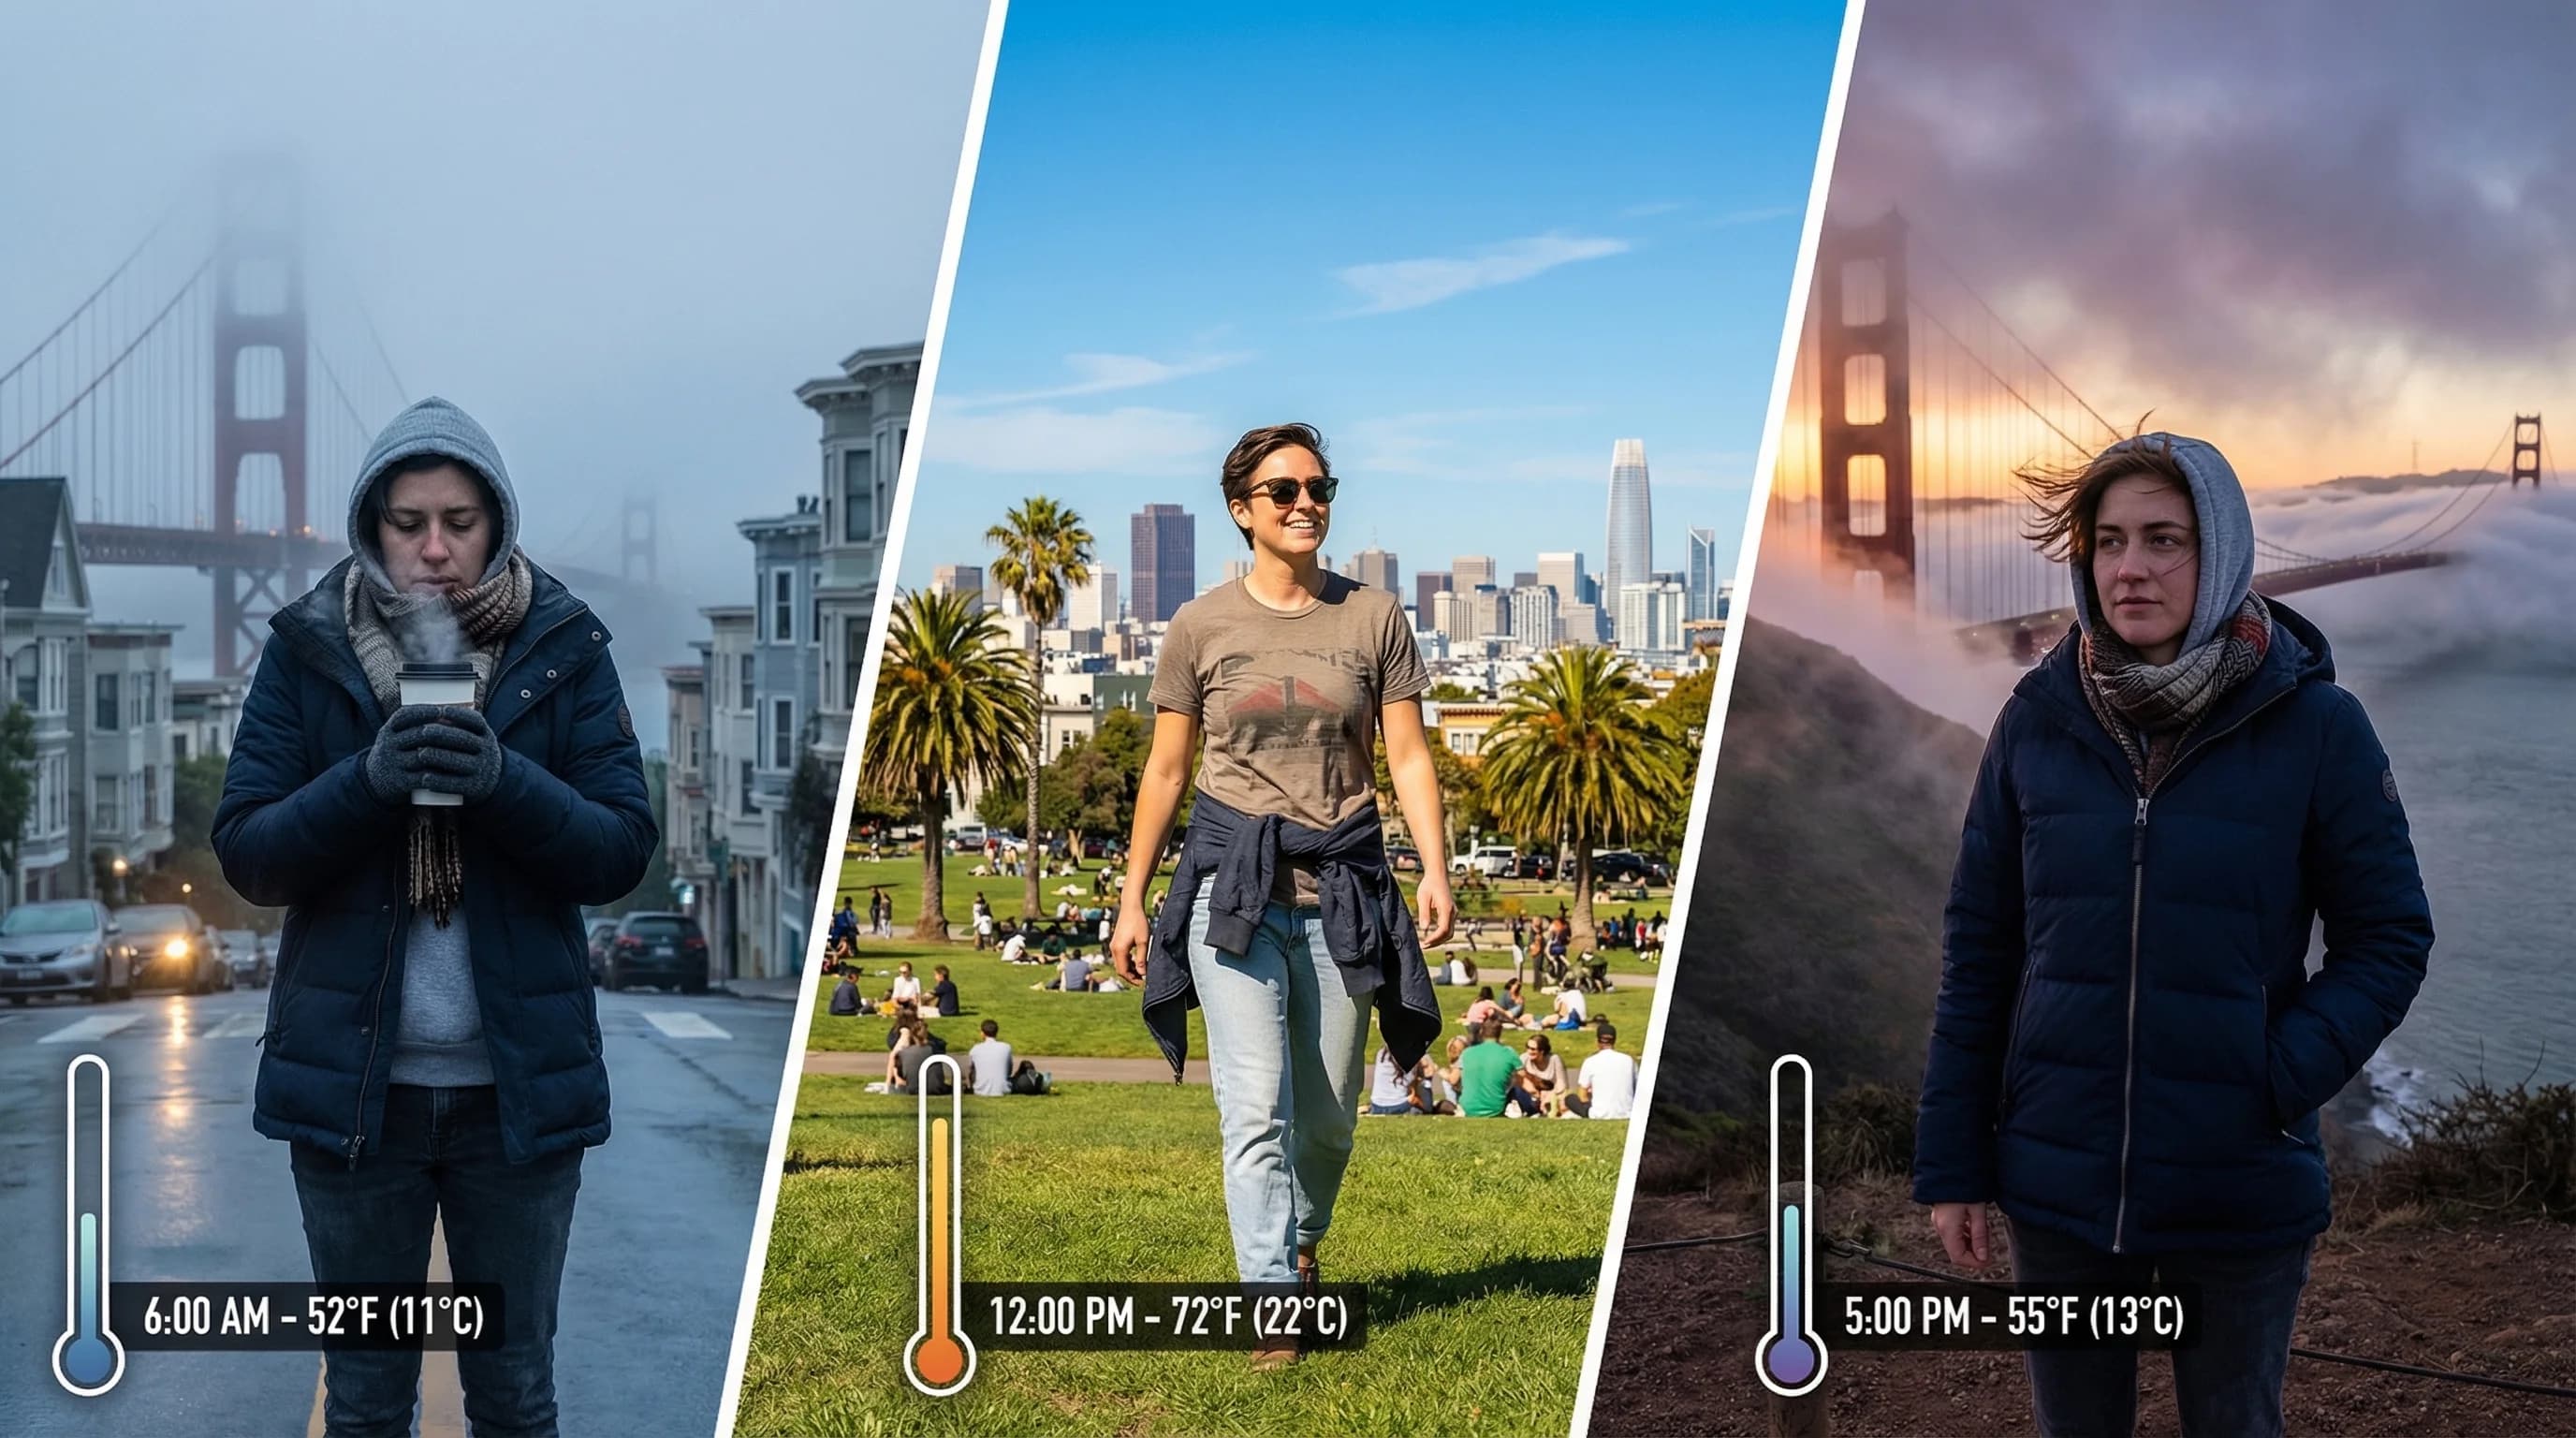
San Francisco's daily swing from foggy 55°F mornings to 72°F afternoons to cool evenings means one outfit never works. Layers are not optional here. They are the only system that works.
5min read →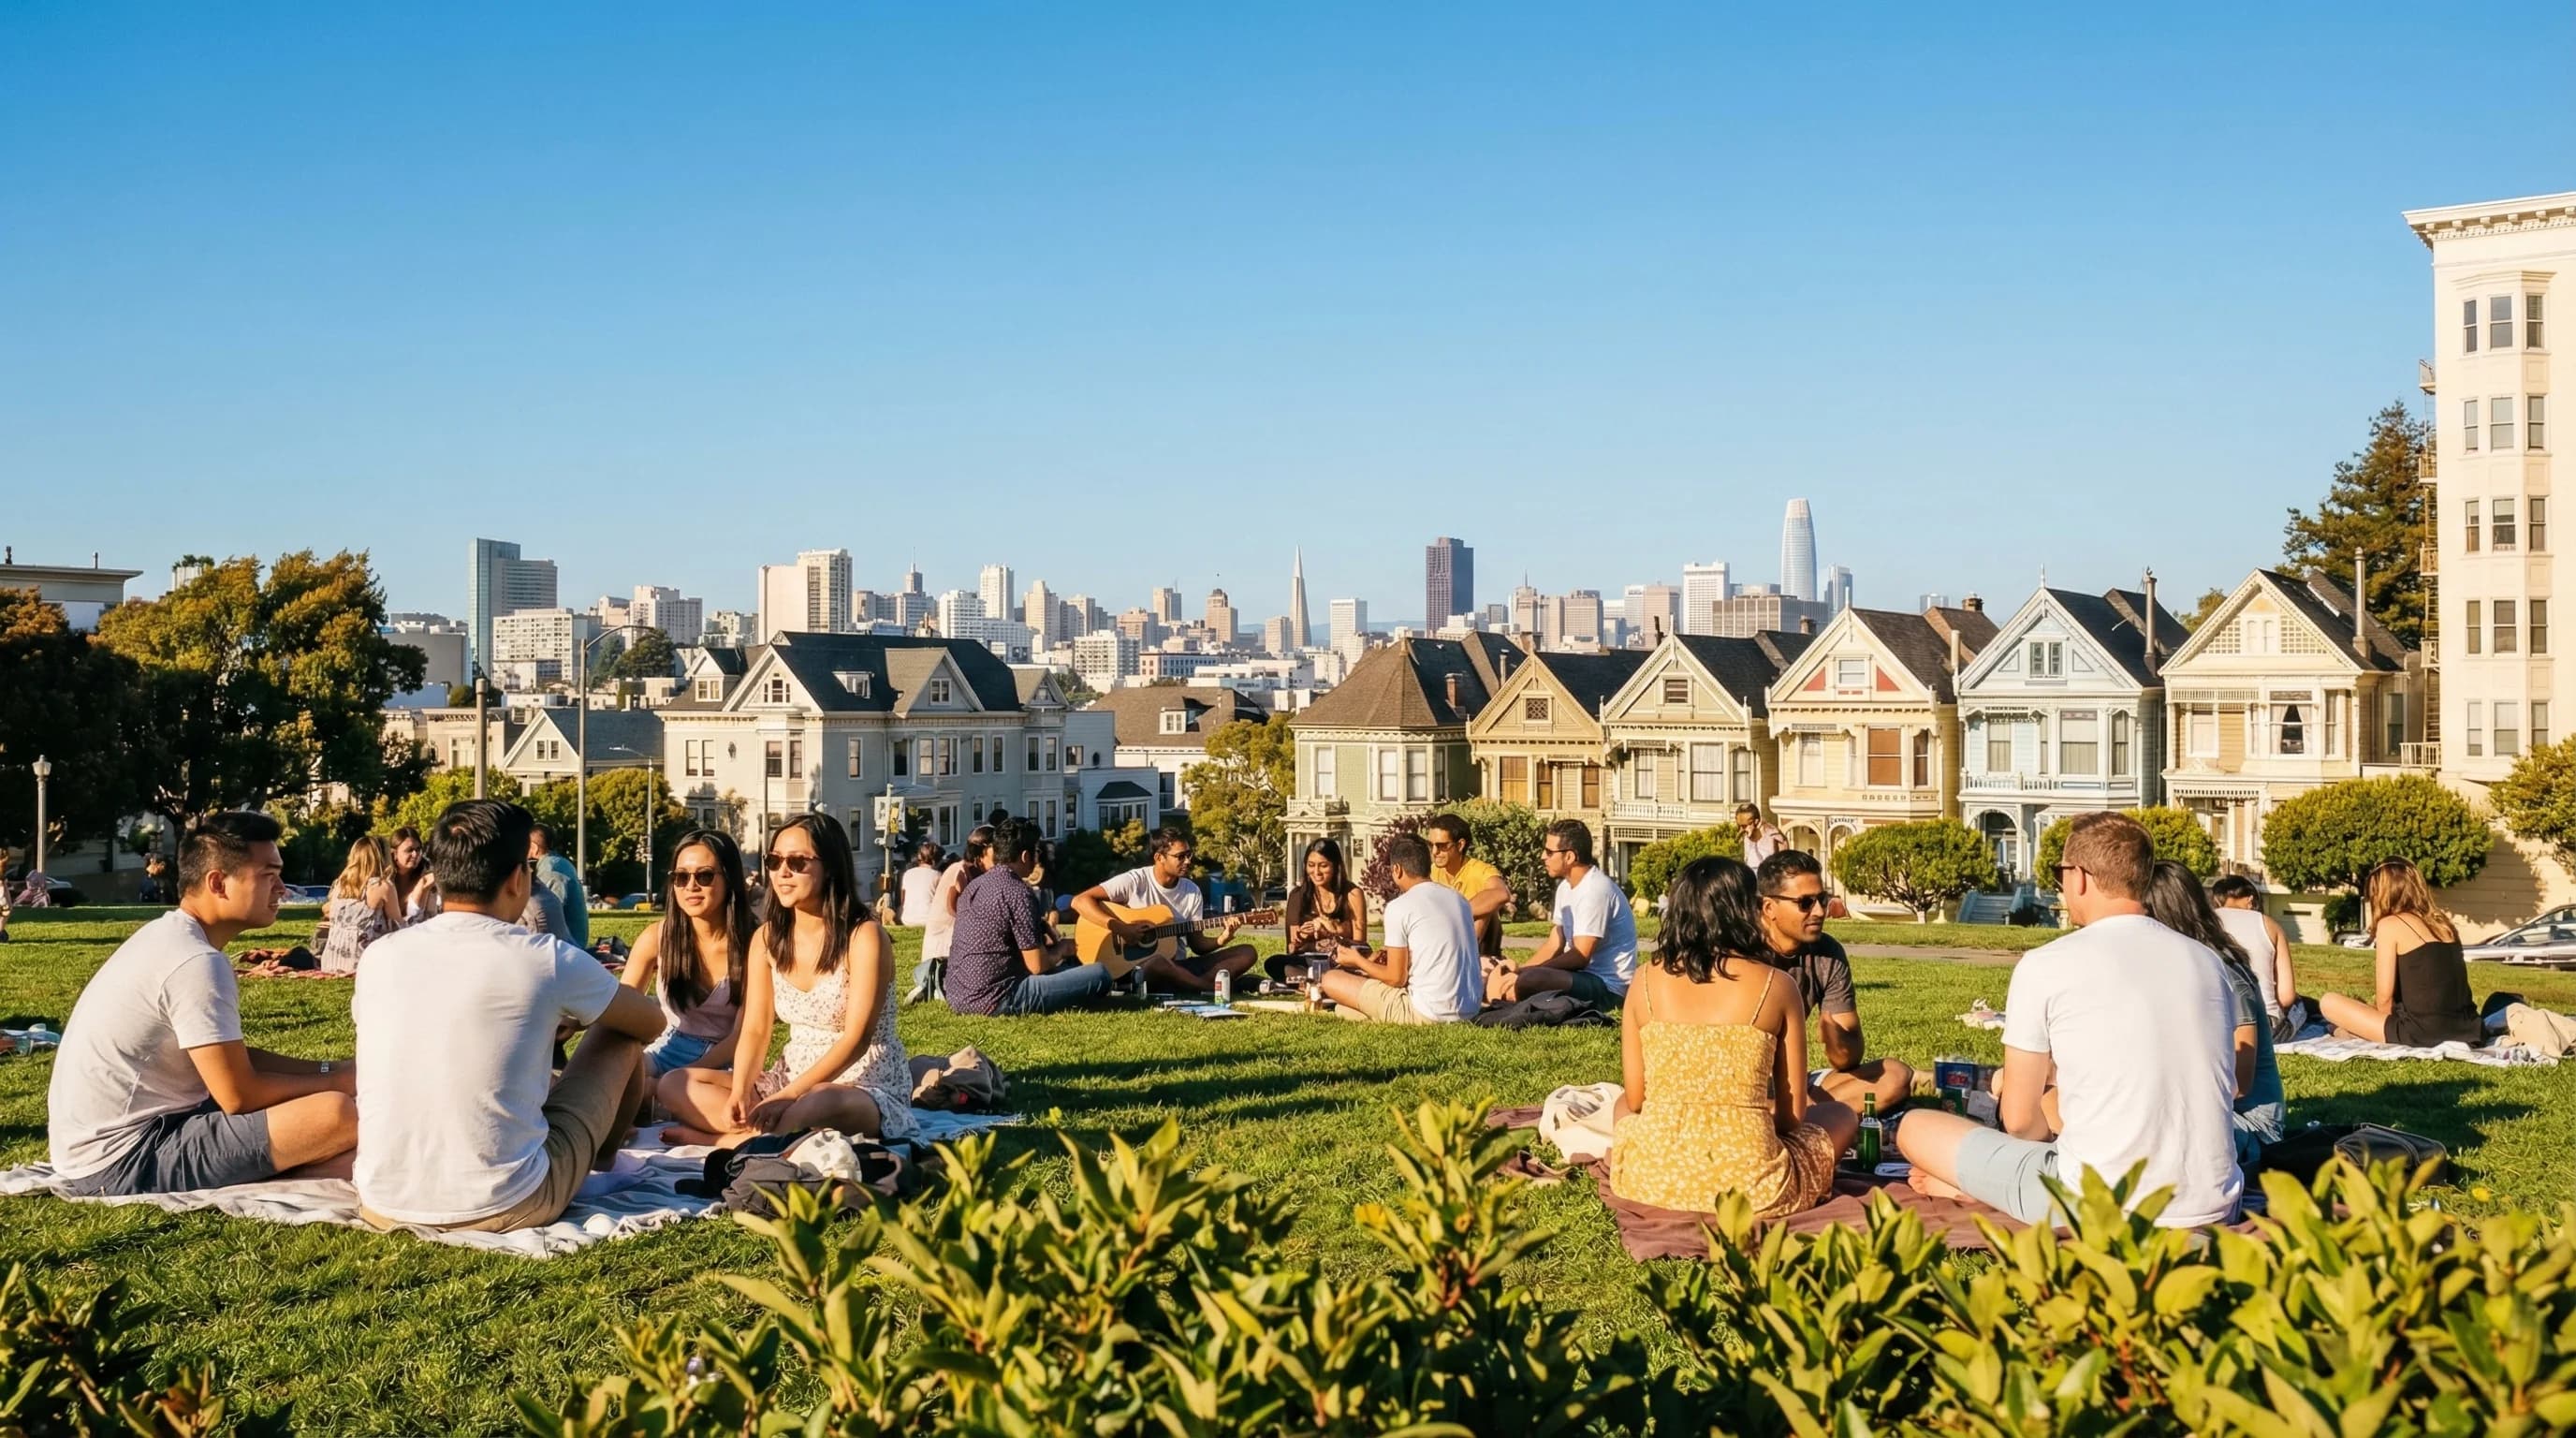
July is San Francisco's foggiest month, not its sunniest. The best time to visit for warm, clear weather is September-October, when the marine layer retreats and Indian summer arrives.
6min read →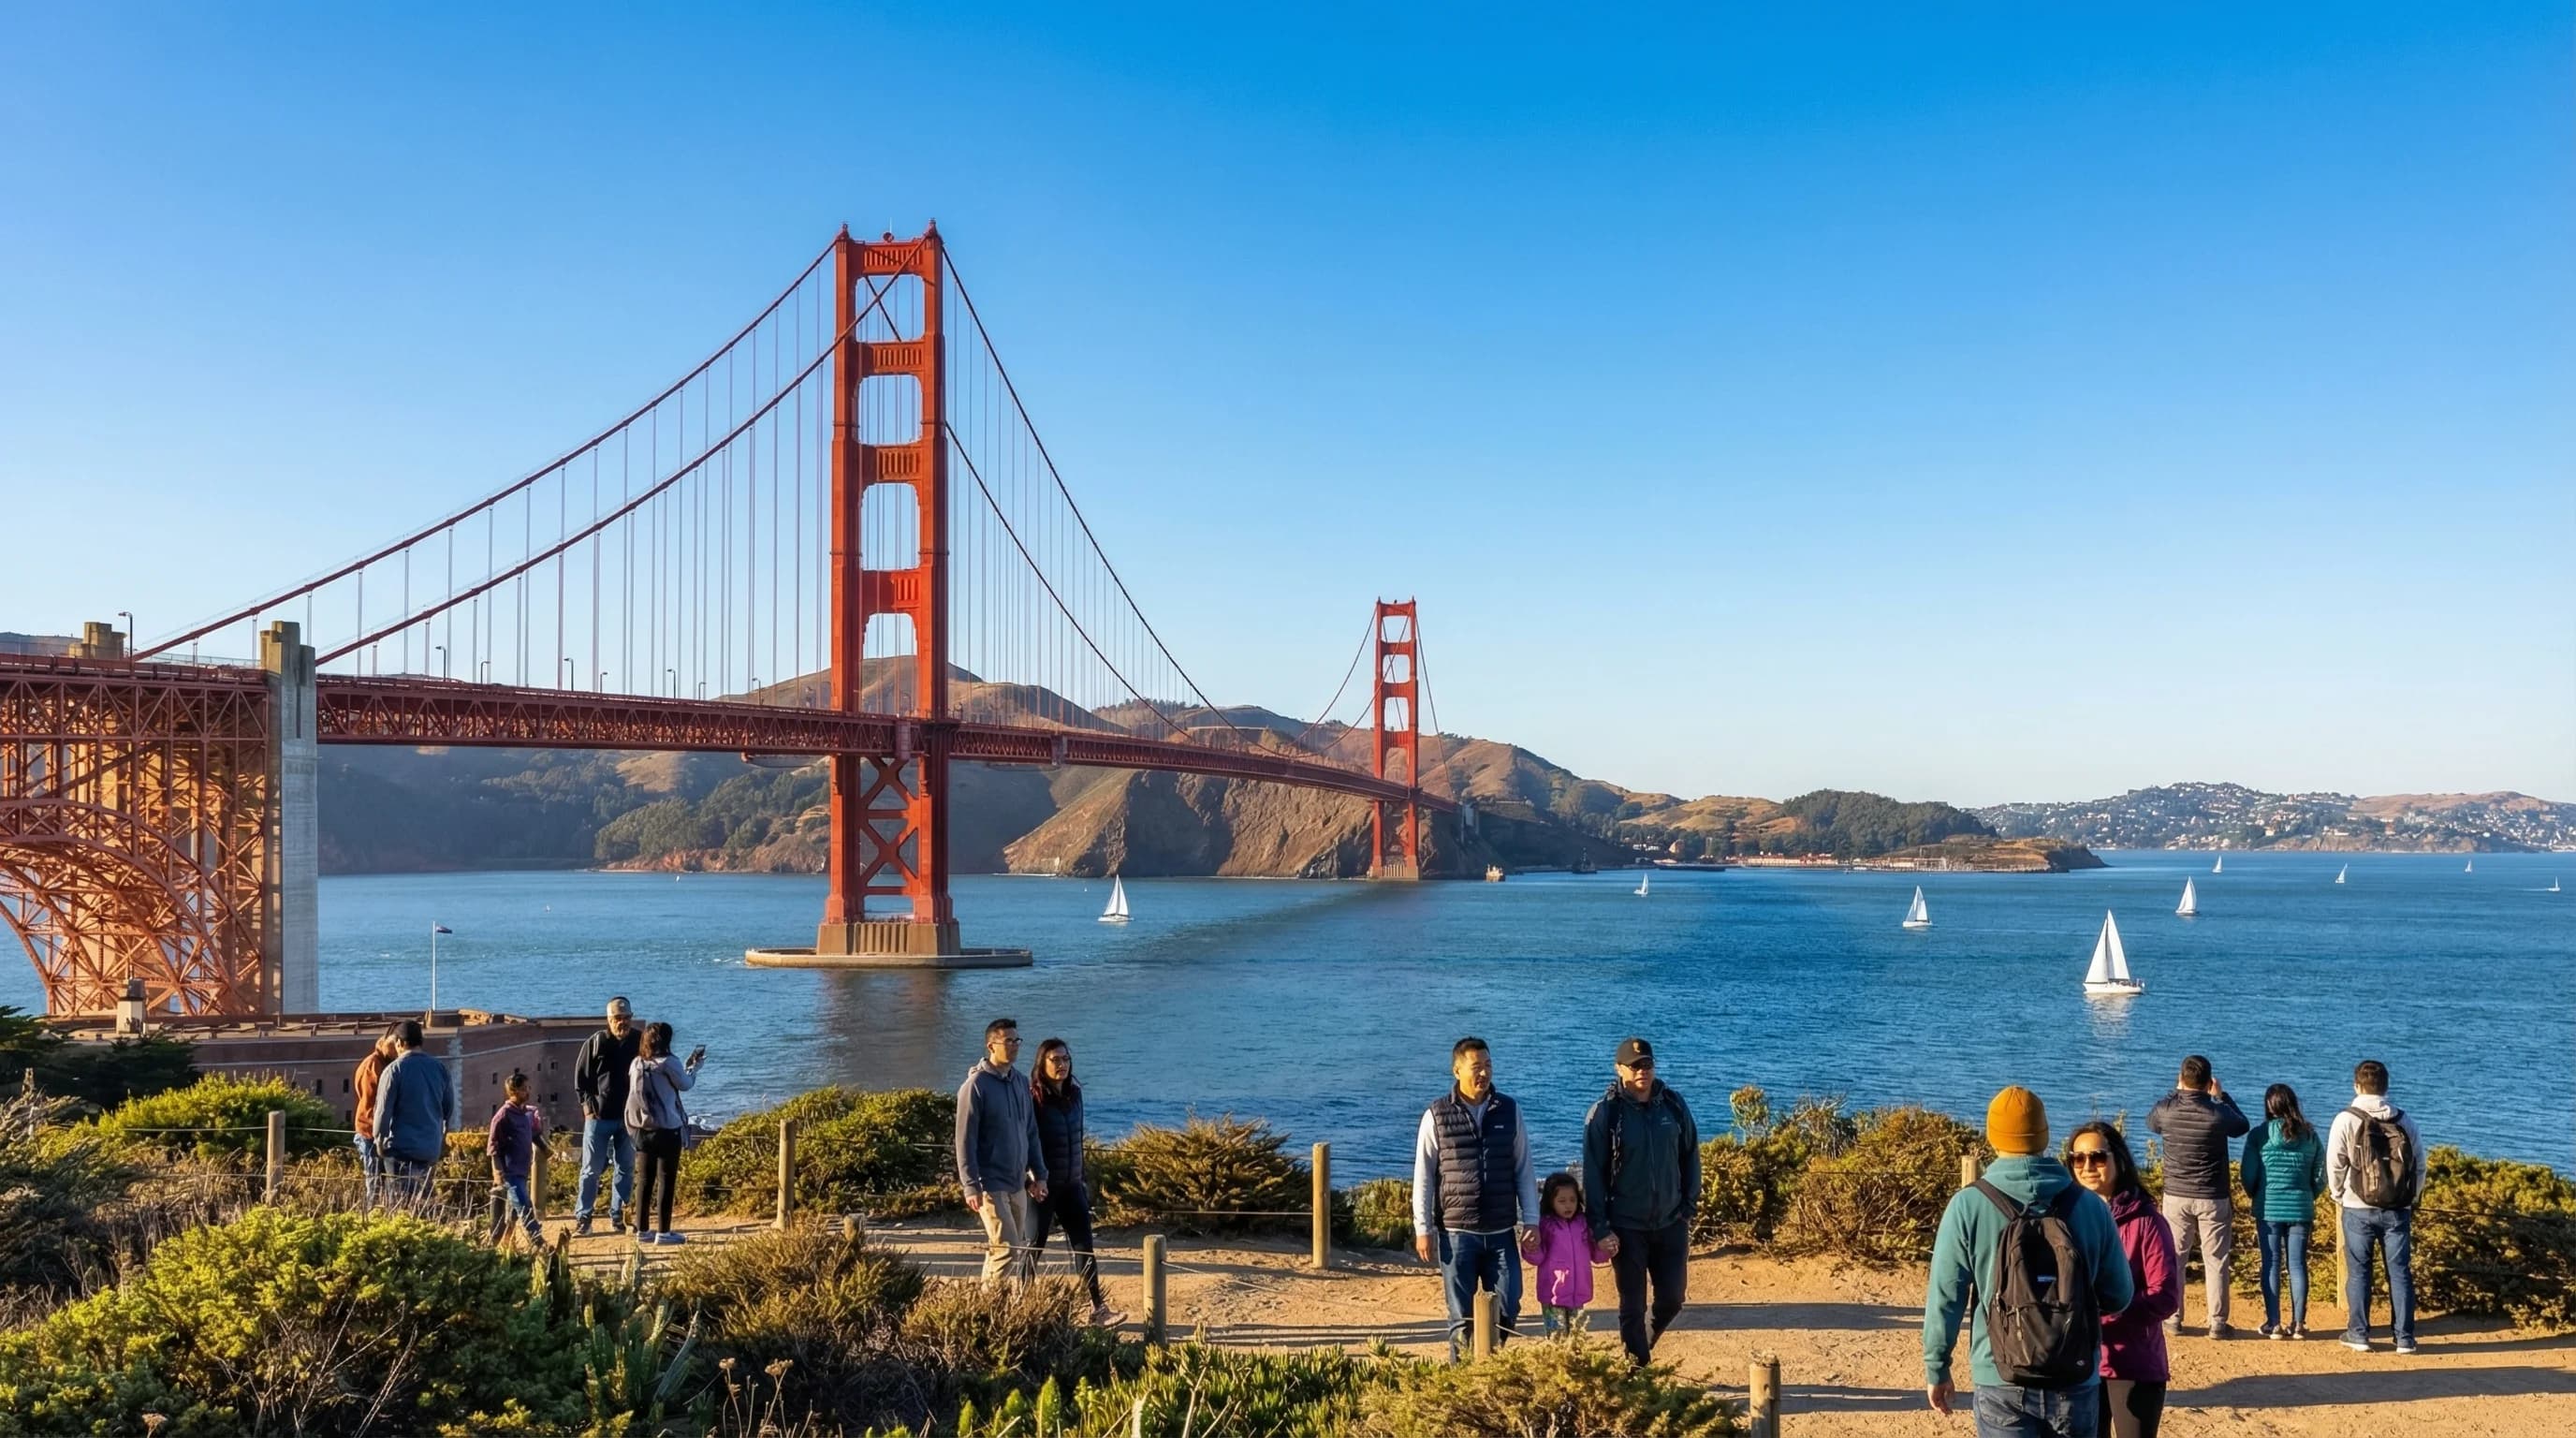
The bridge sits at the Bay Area's primary fog channel. Summer afternoons are usually fogged over. For clear views, visit before 10am or plan your trip for October, the fog's annual minimum.
5min read →
October gives you harvest activity, Indian summer warmth in the 80s°F, and golden vine foliage simultaneously. Spring is the green alternative. Here's how to pick the right month for your wine country day trip.
6min read →Category
Deep-dives into specific Bay Area and Northern California destinations and their unique weather patterns.
Monterey's protected bay position makes it warmer and clearer than the Bay Area coast to its north. Morning fog burns off by noon most days, fall is the warmest season, and Carmel Valley runs 25°F hotter than the beach.
6min read →
Sausalito is a mile from San Francisco across the Gate, but the Marin Headlands provide partial protection from the marine layer, making mornings often clearer and slightly warmer. The trade-off is serious afternoon wind on the waterfront.
5min read →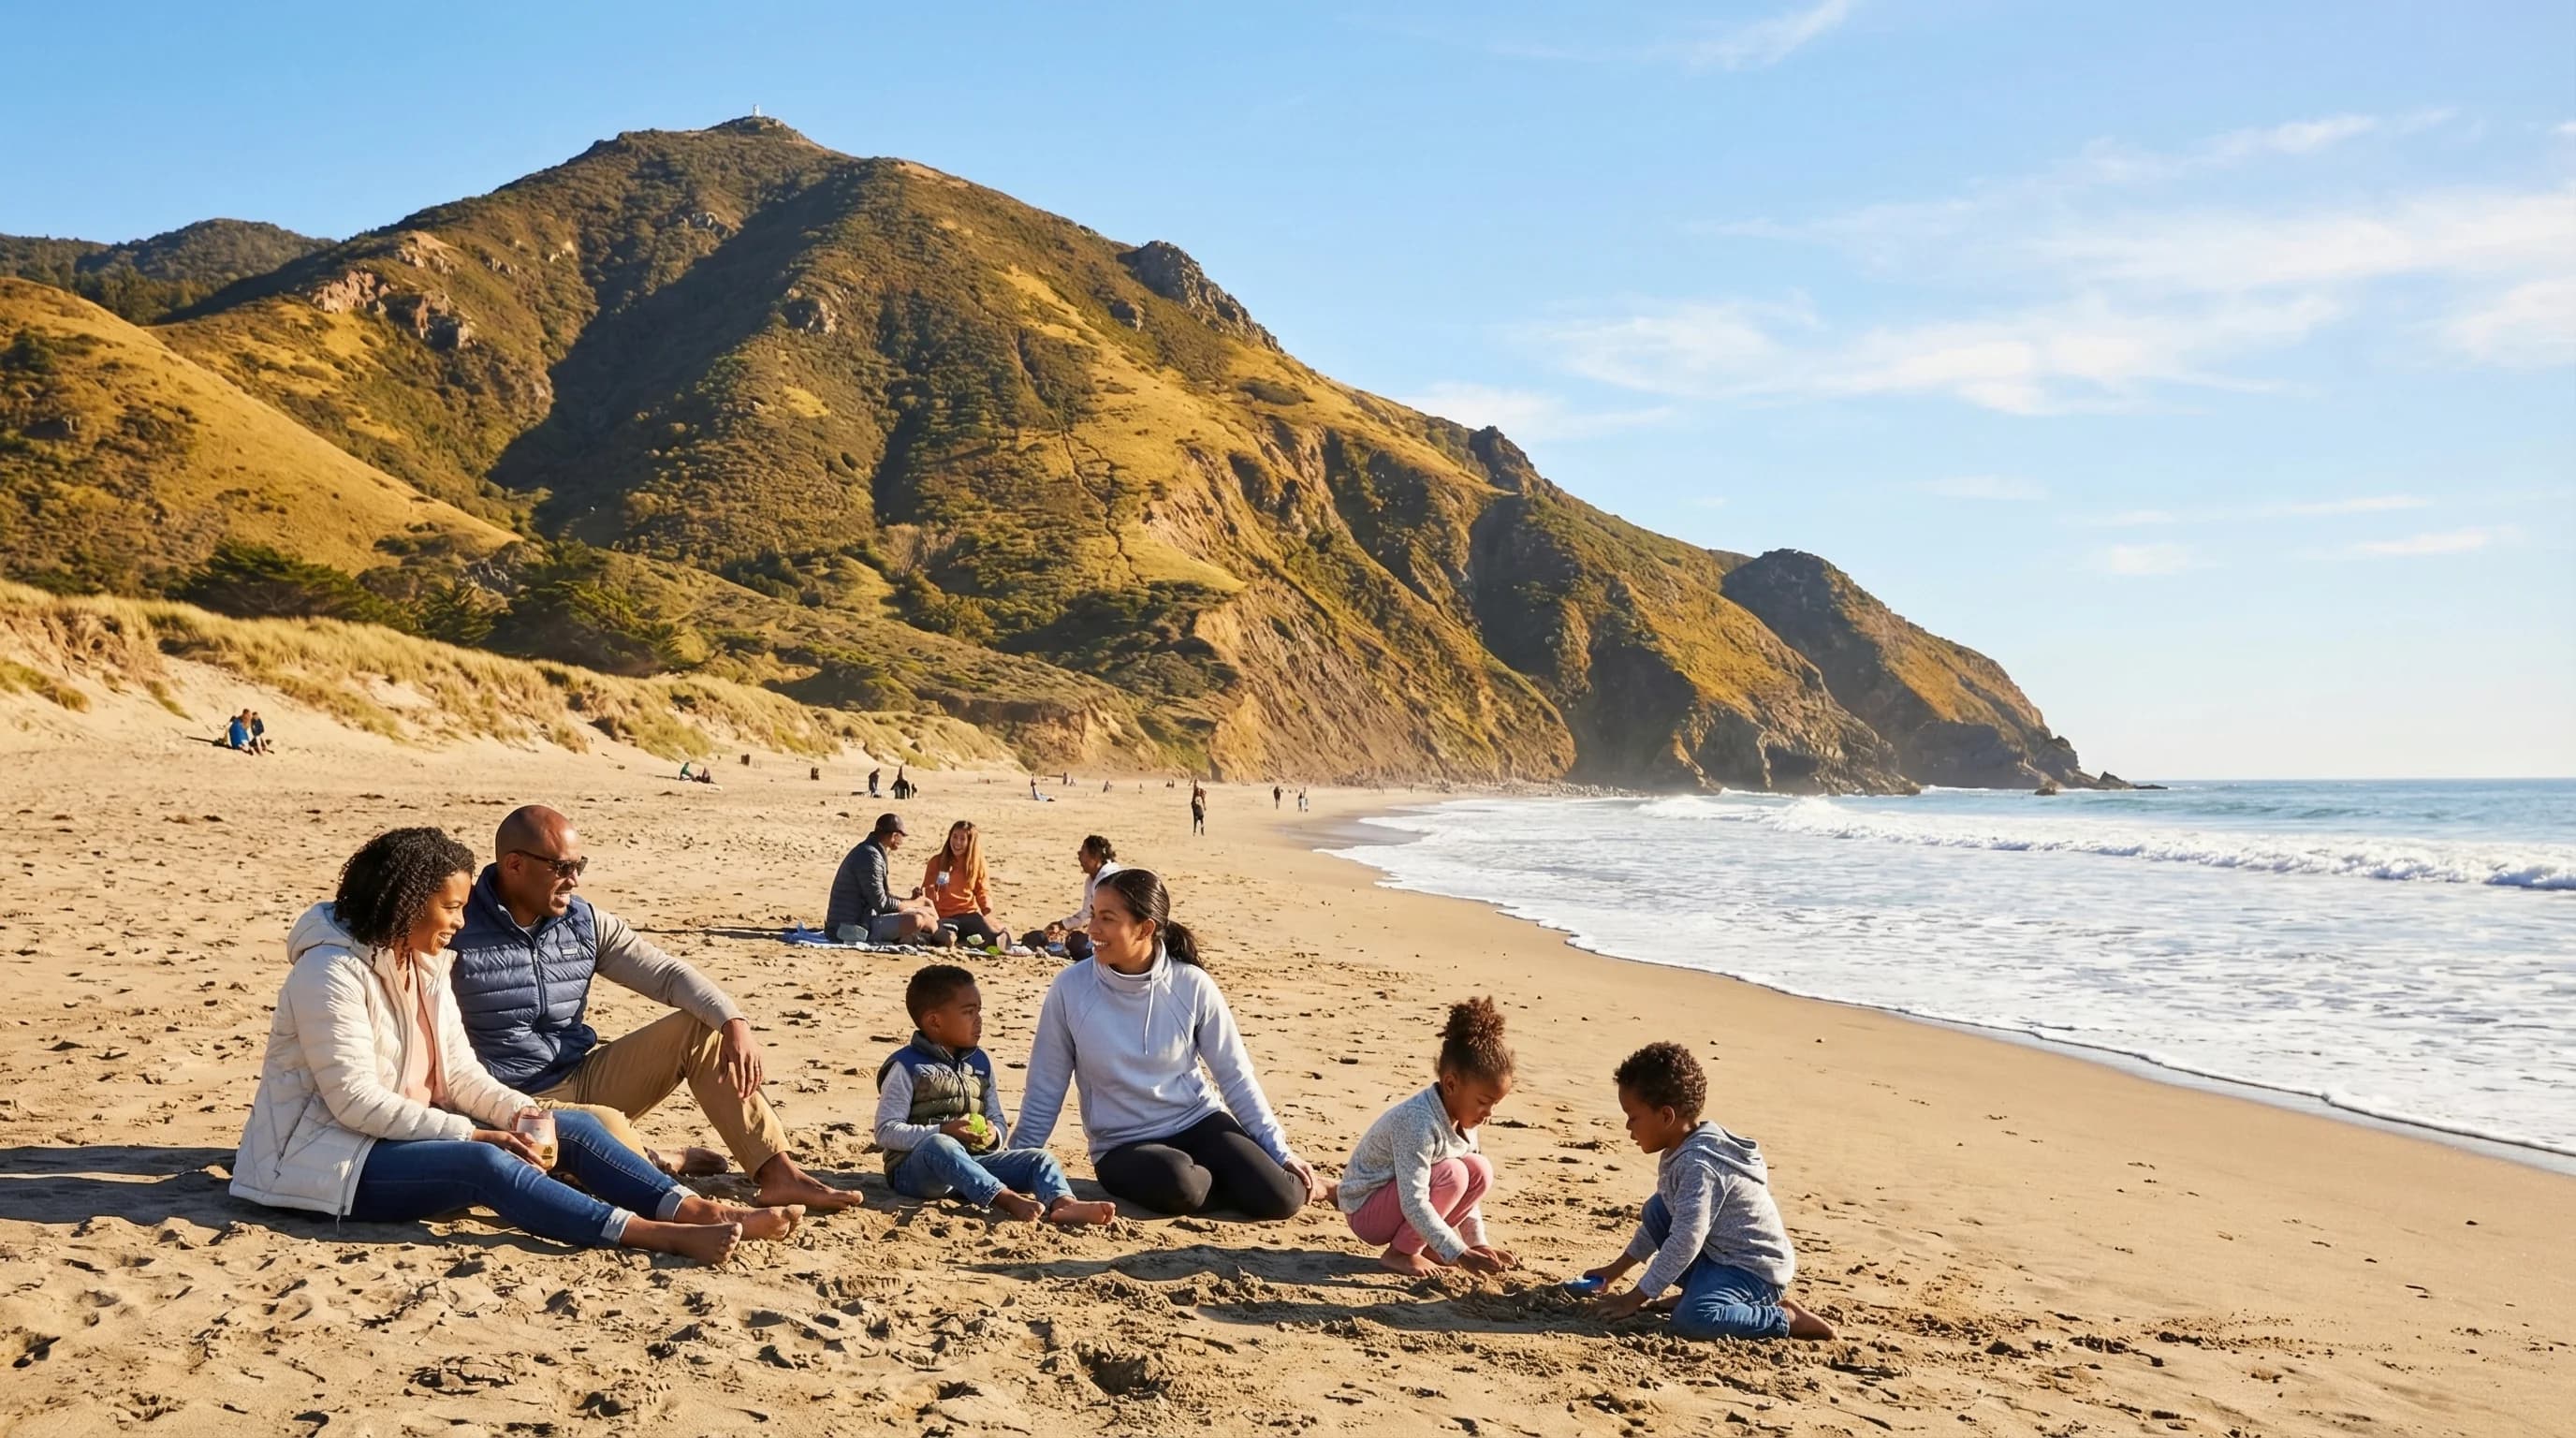
Stinson Beach can be 15°F warmer than Ocean Beach on the same day, depending on wind direction. Northwest wind brings fog; west wind often leaves Stinson clear. Fall is the most reliable season for warm beach conditions.
5min read →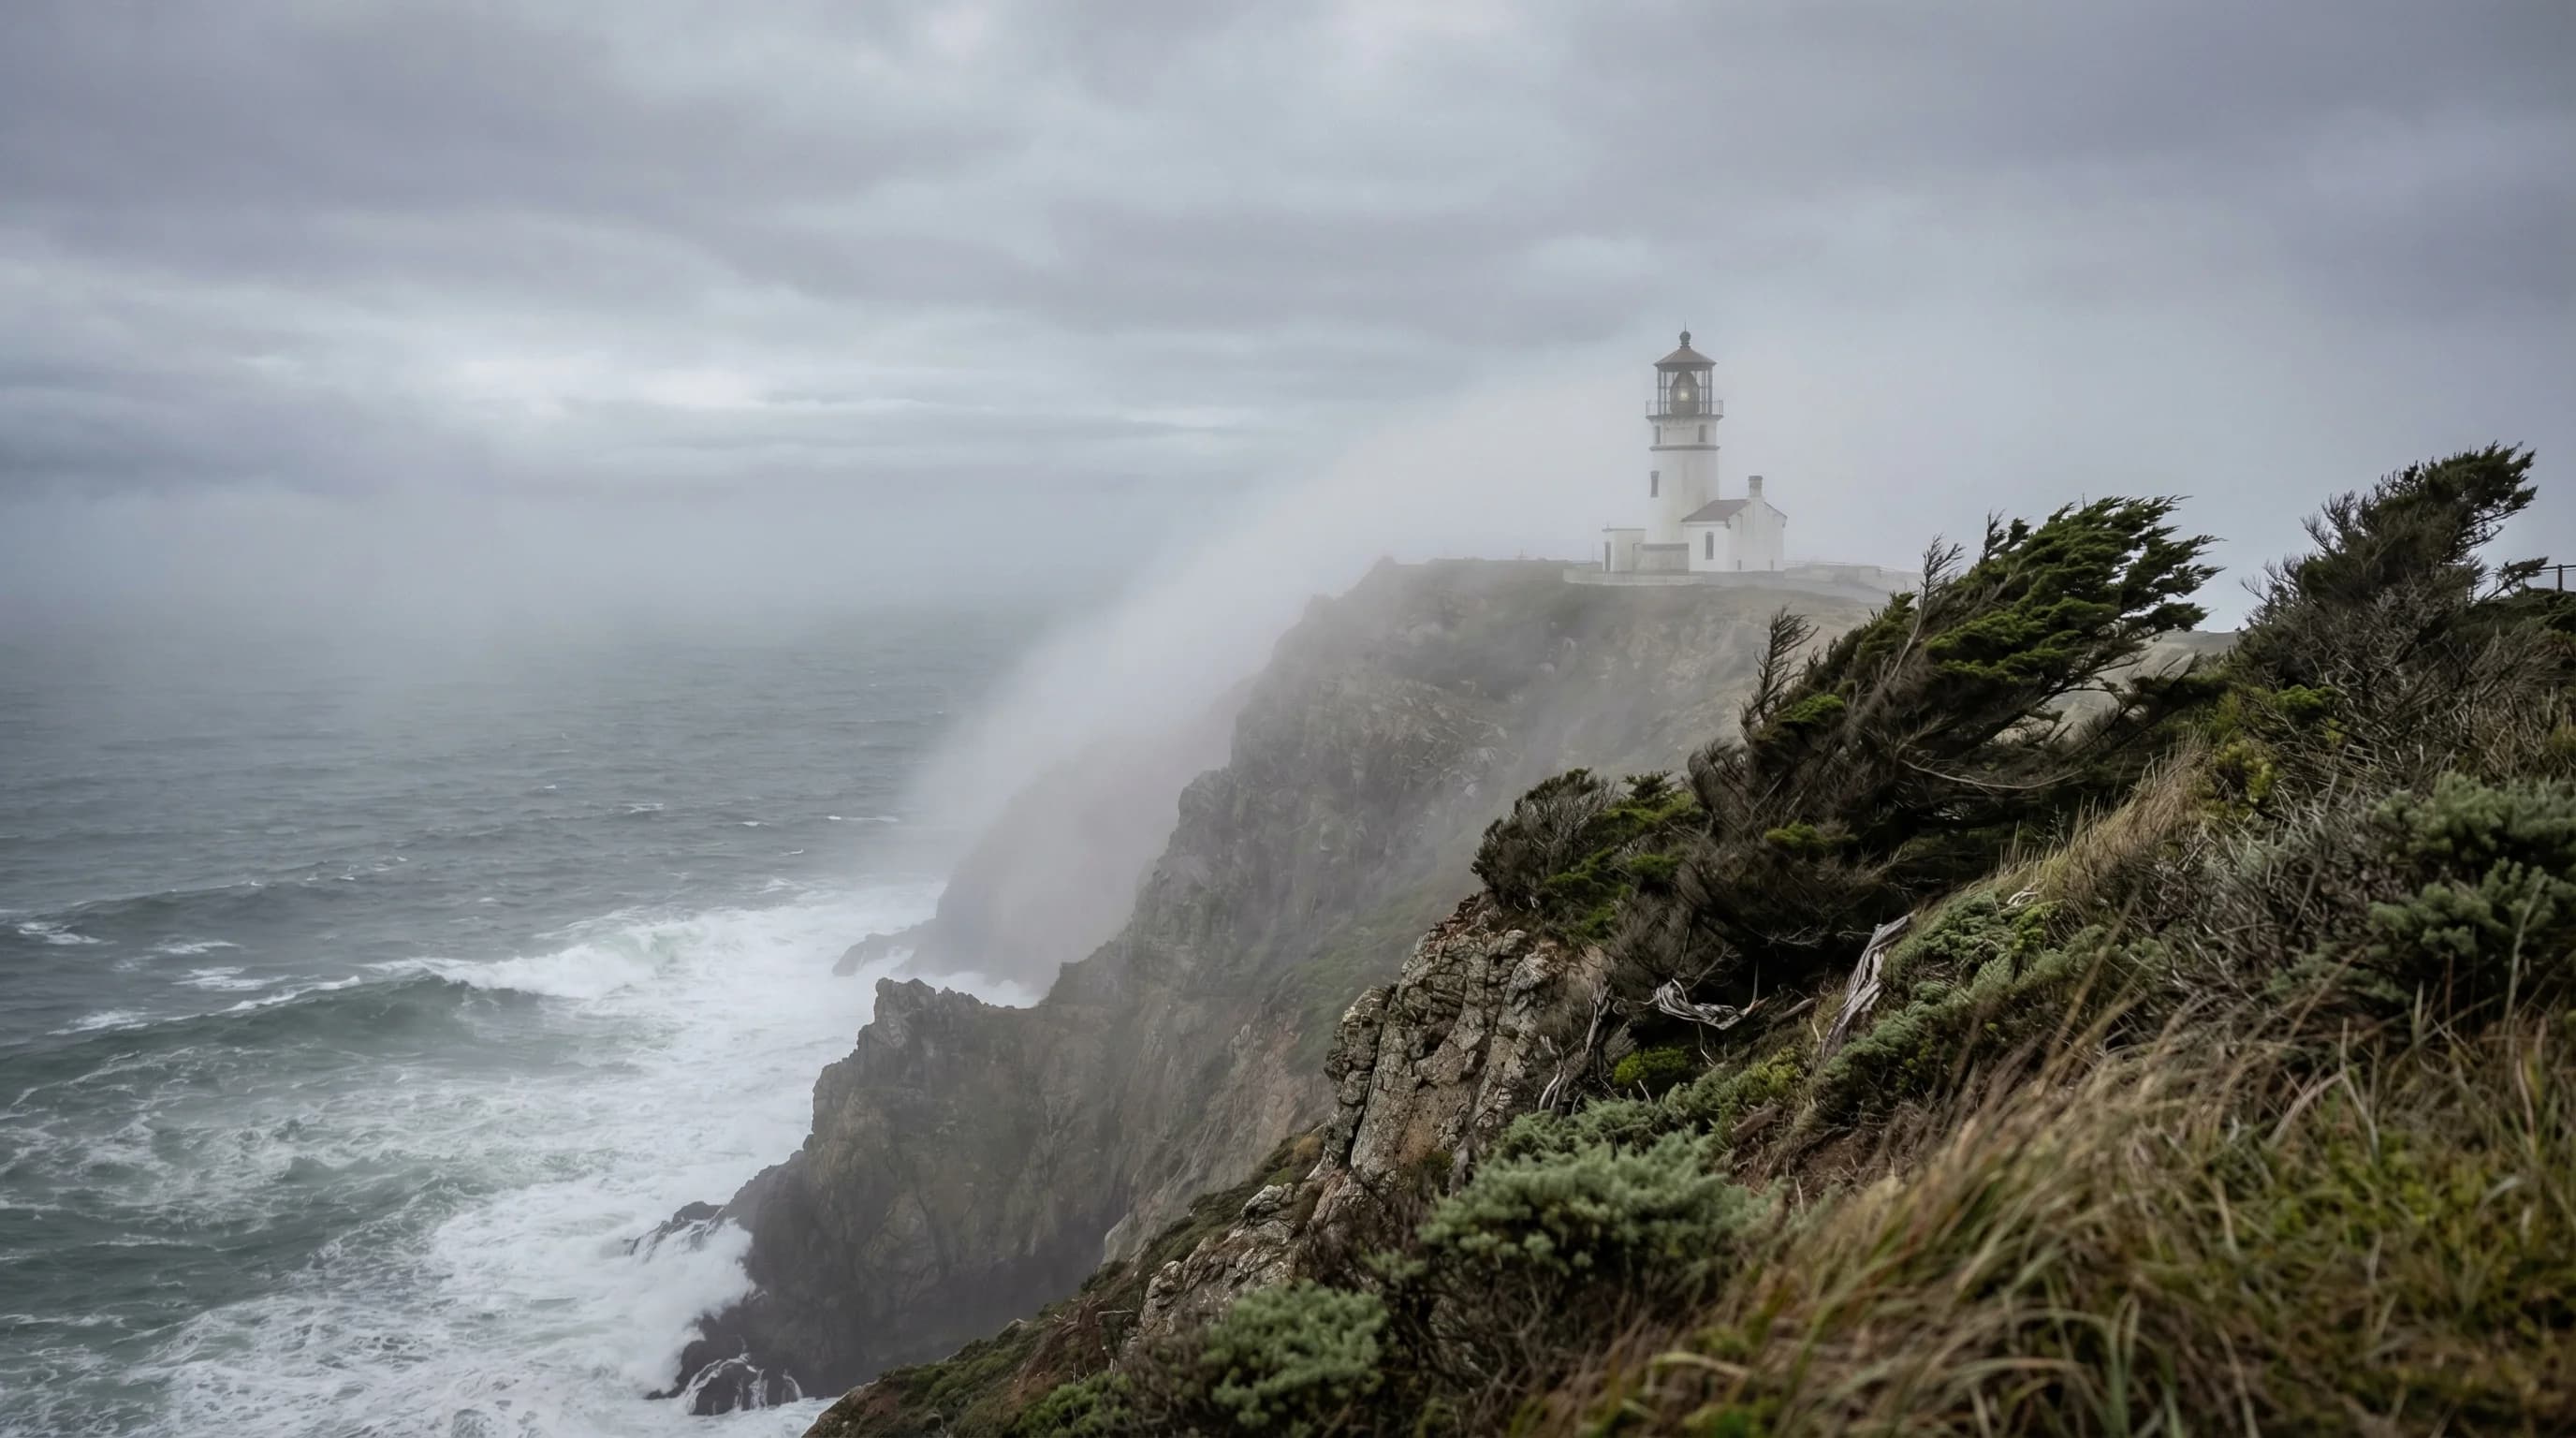
Point Reyes is the Bay Area's most exposed coastline. The lighthouse records 2,000+ fog hours annually and wind gusts over 100 mph in major storms. The Inverness Ridge creates a dramatic weather divide within the park.
6min read →
Walnut Creek sits in the Diablo Valley, sheltered from the marine layer by the Berkeley Hills. July highs average in the upper 80s°F, heat waves push past 100°F, and fall is the most pleasant season.
5min read →
Concord sits in the northern Diablo Valley close enough to the Carquinez Strait to catch afternoon marine relief most days. July highs average in the low-to-mid 90s°F, 3-8°F cooler than Livermore but still genuinely hot.
5min read →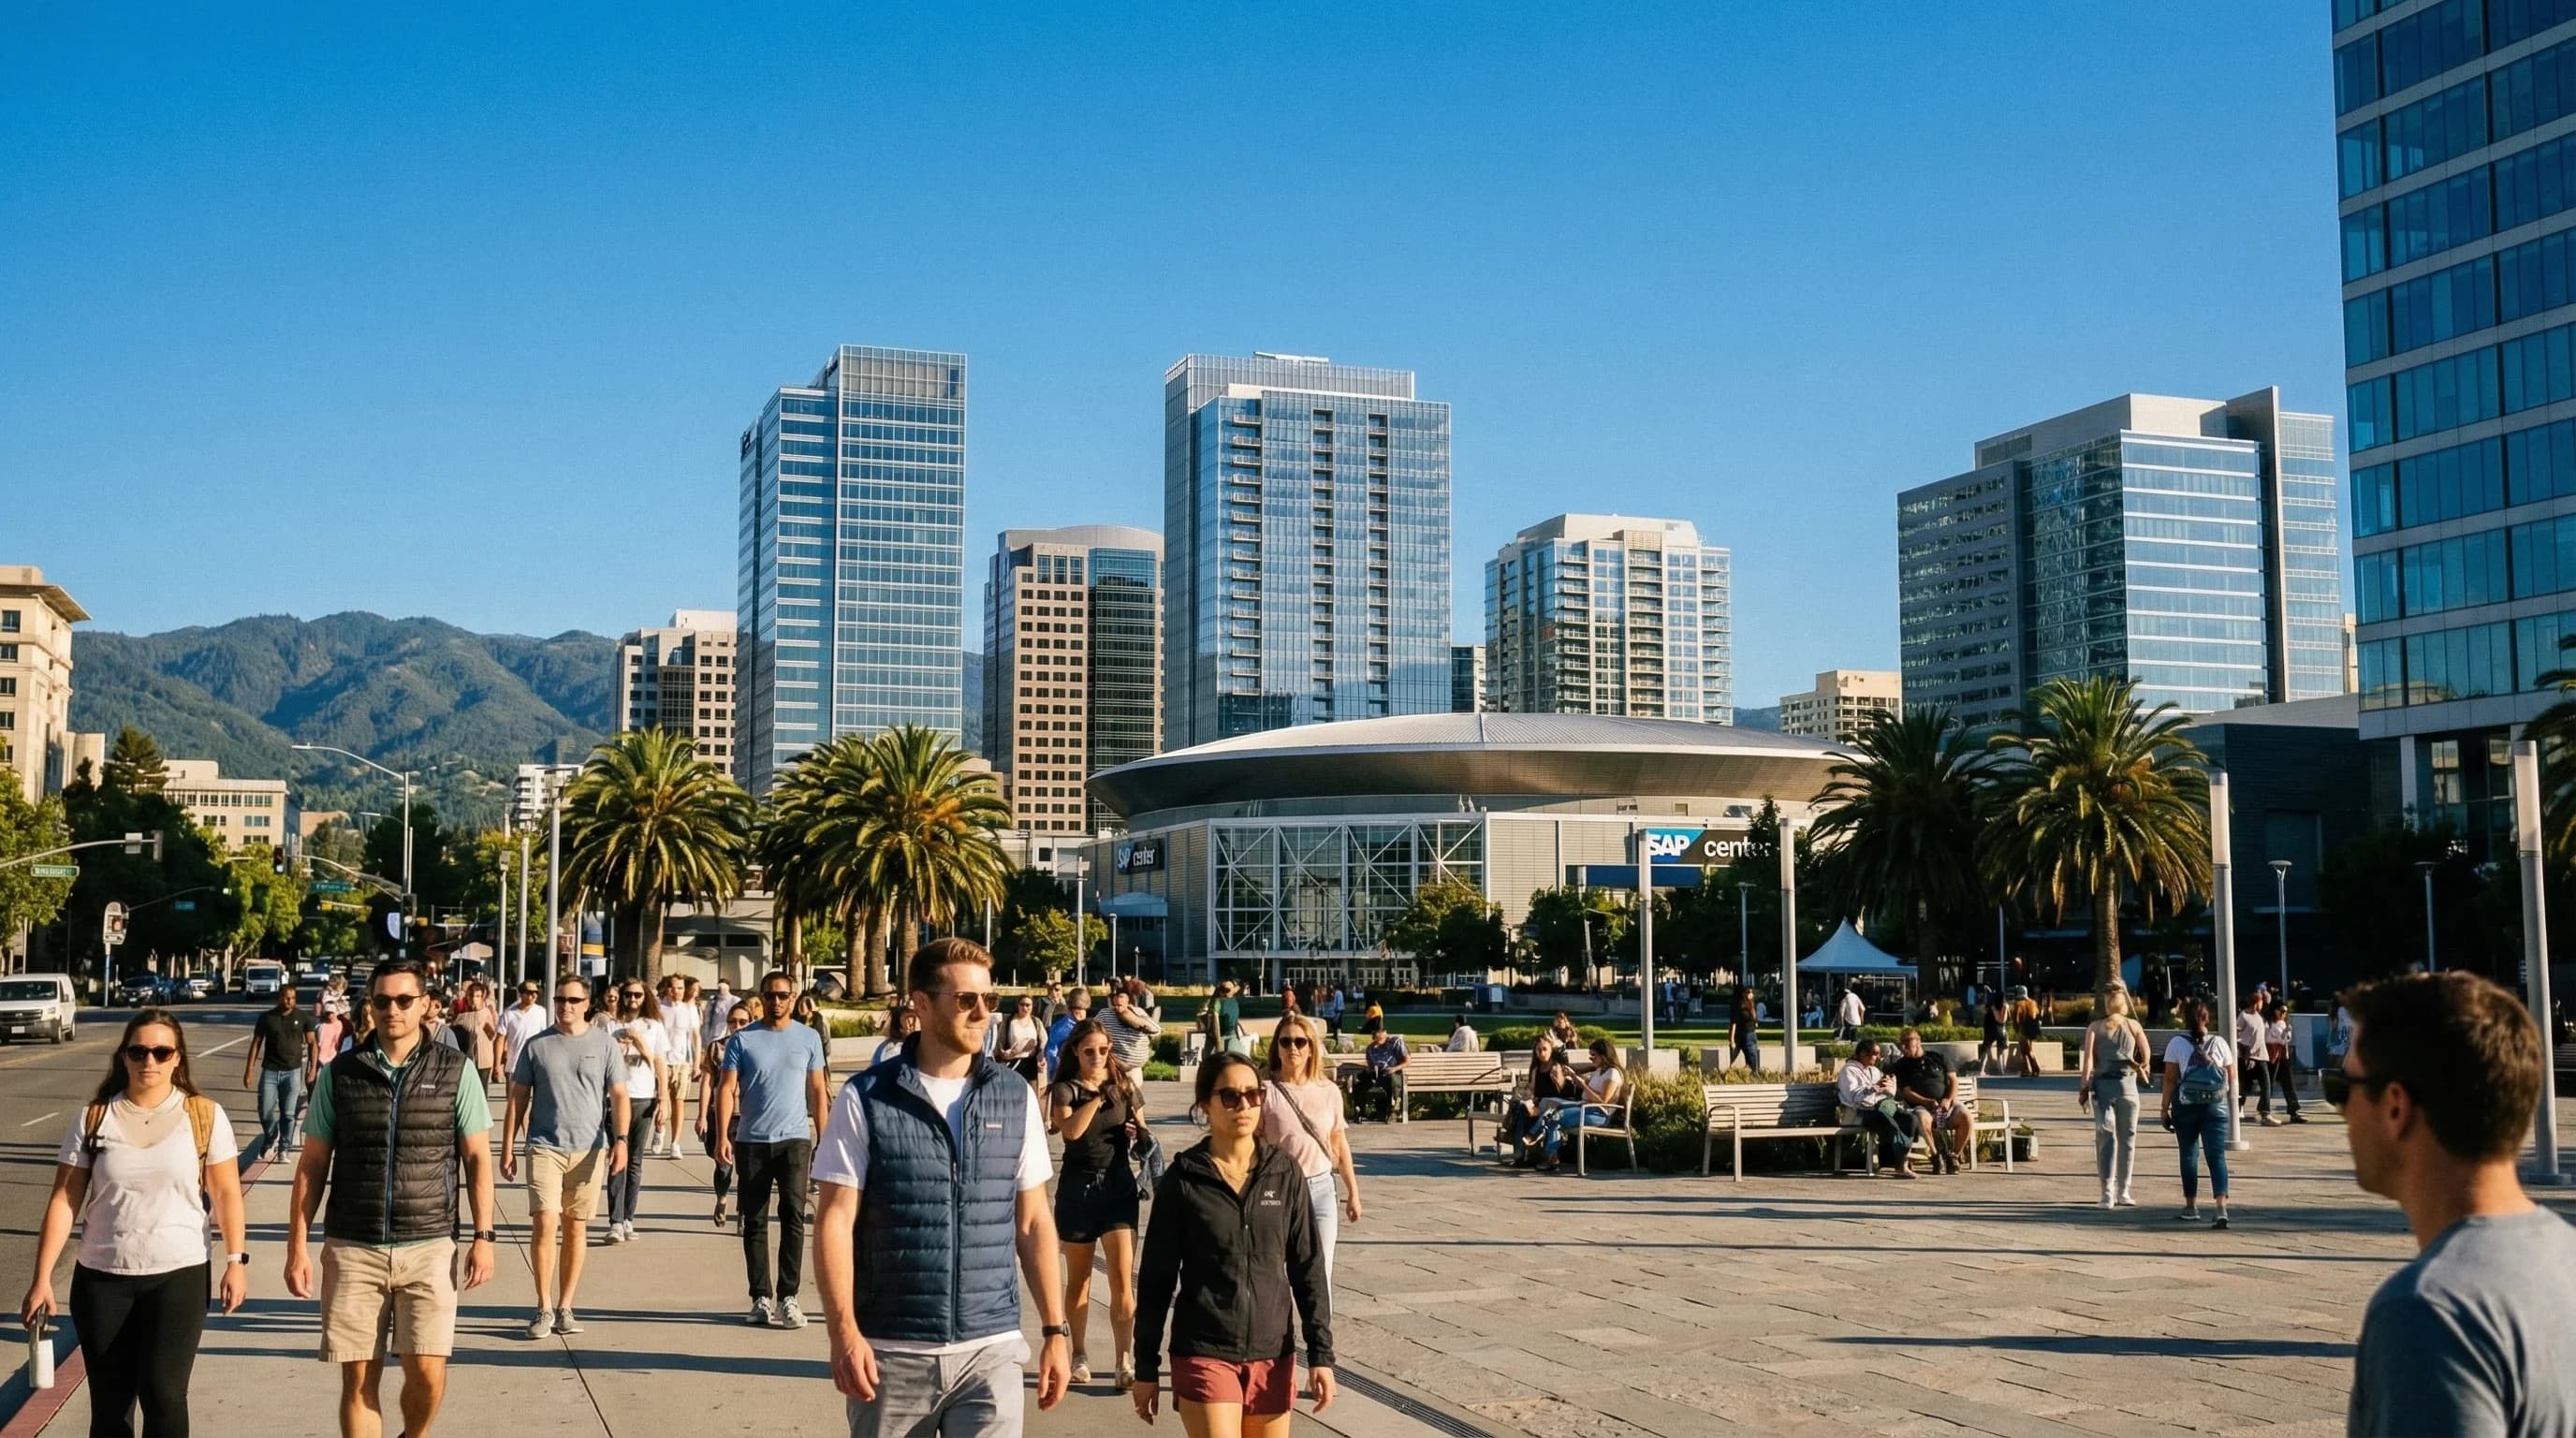
San Jose is the Bay Area's warmest major city: 82°F average July highs, 260 sunny days per year, and winters that rarely threaten frost. The marine layer travels 40 miles from the coast before arriving, losing most of its cooling effect.
6min read →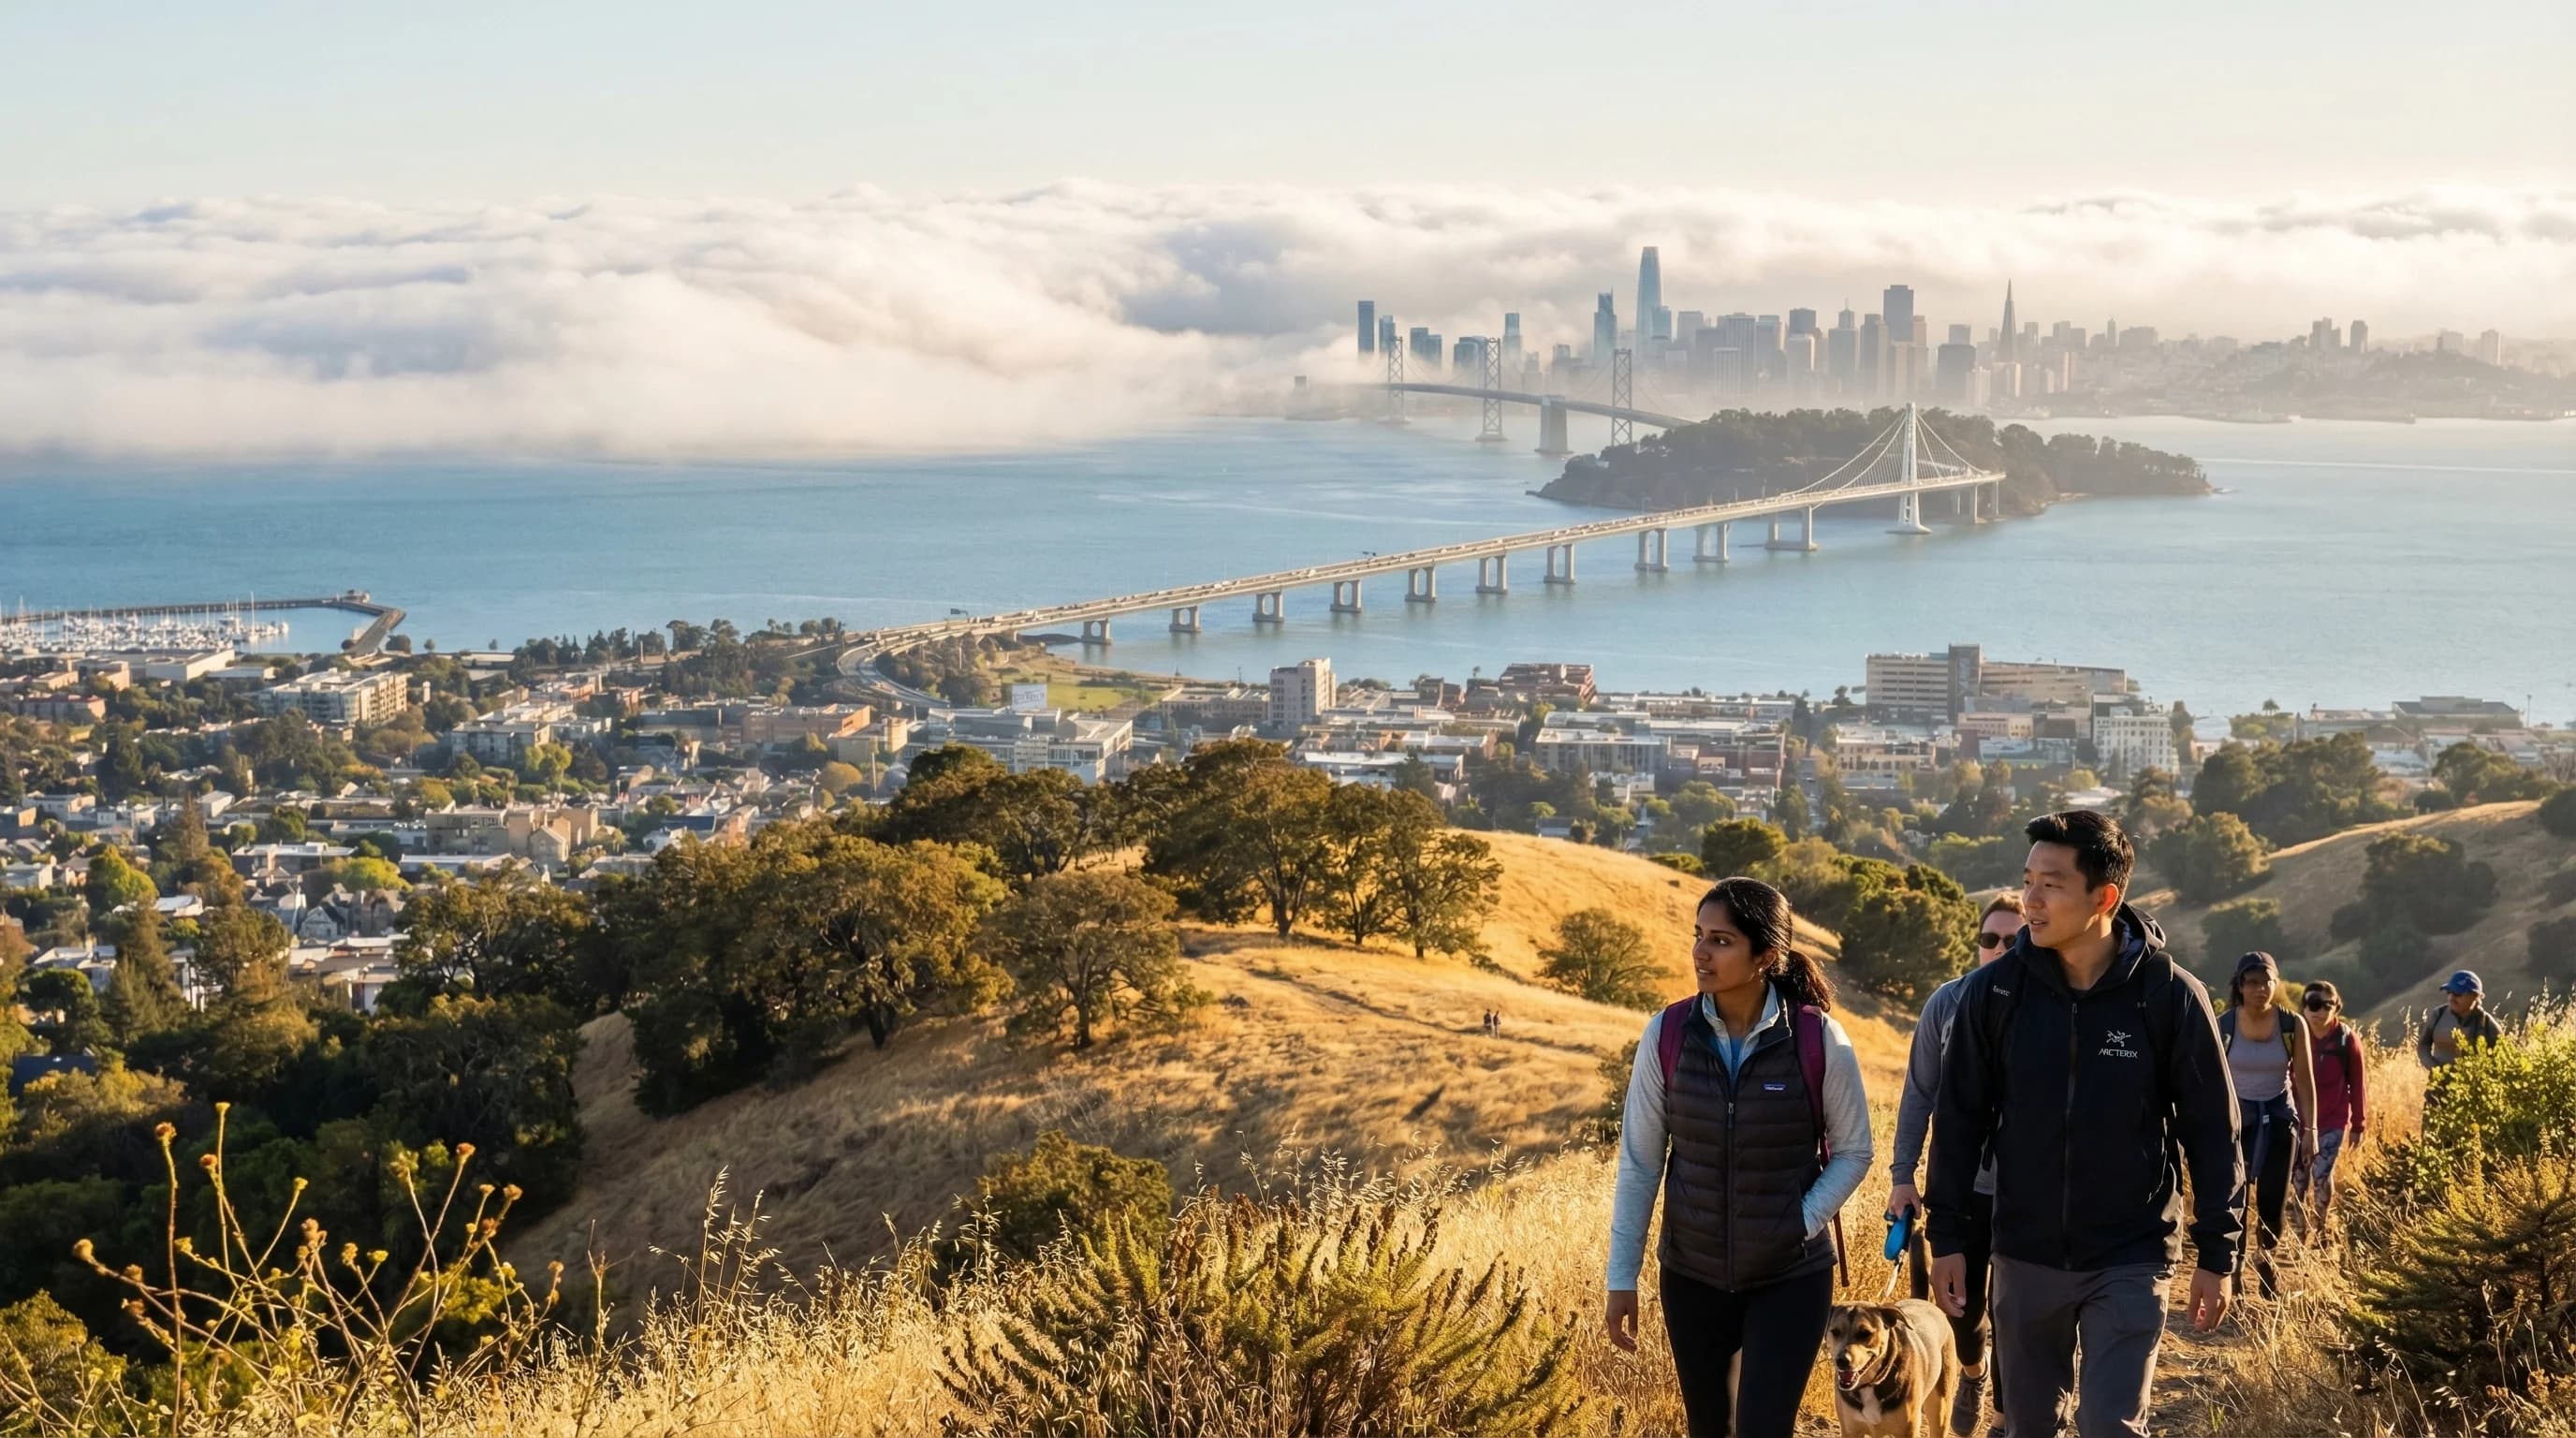
Oakland gets about 260 sunny days per year, 100 more than San Francisco. The Berkeley Hills block the marine layer on most summer days, giving Oakland July highs around 72°F while SF sits at 65°F under fog.
6min read →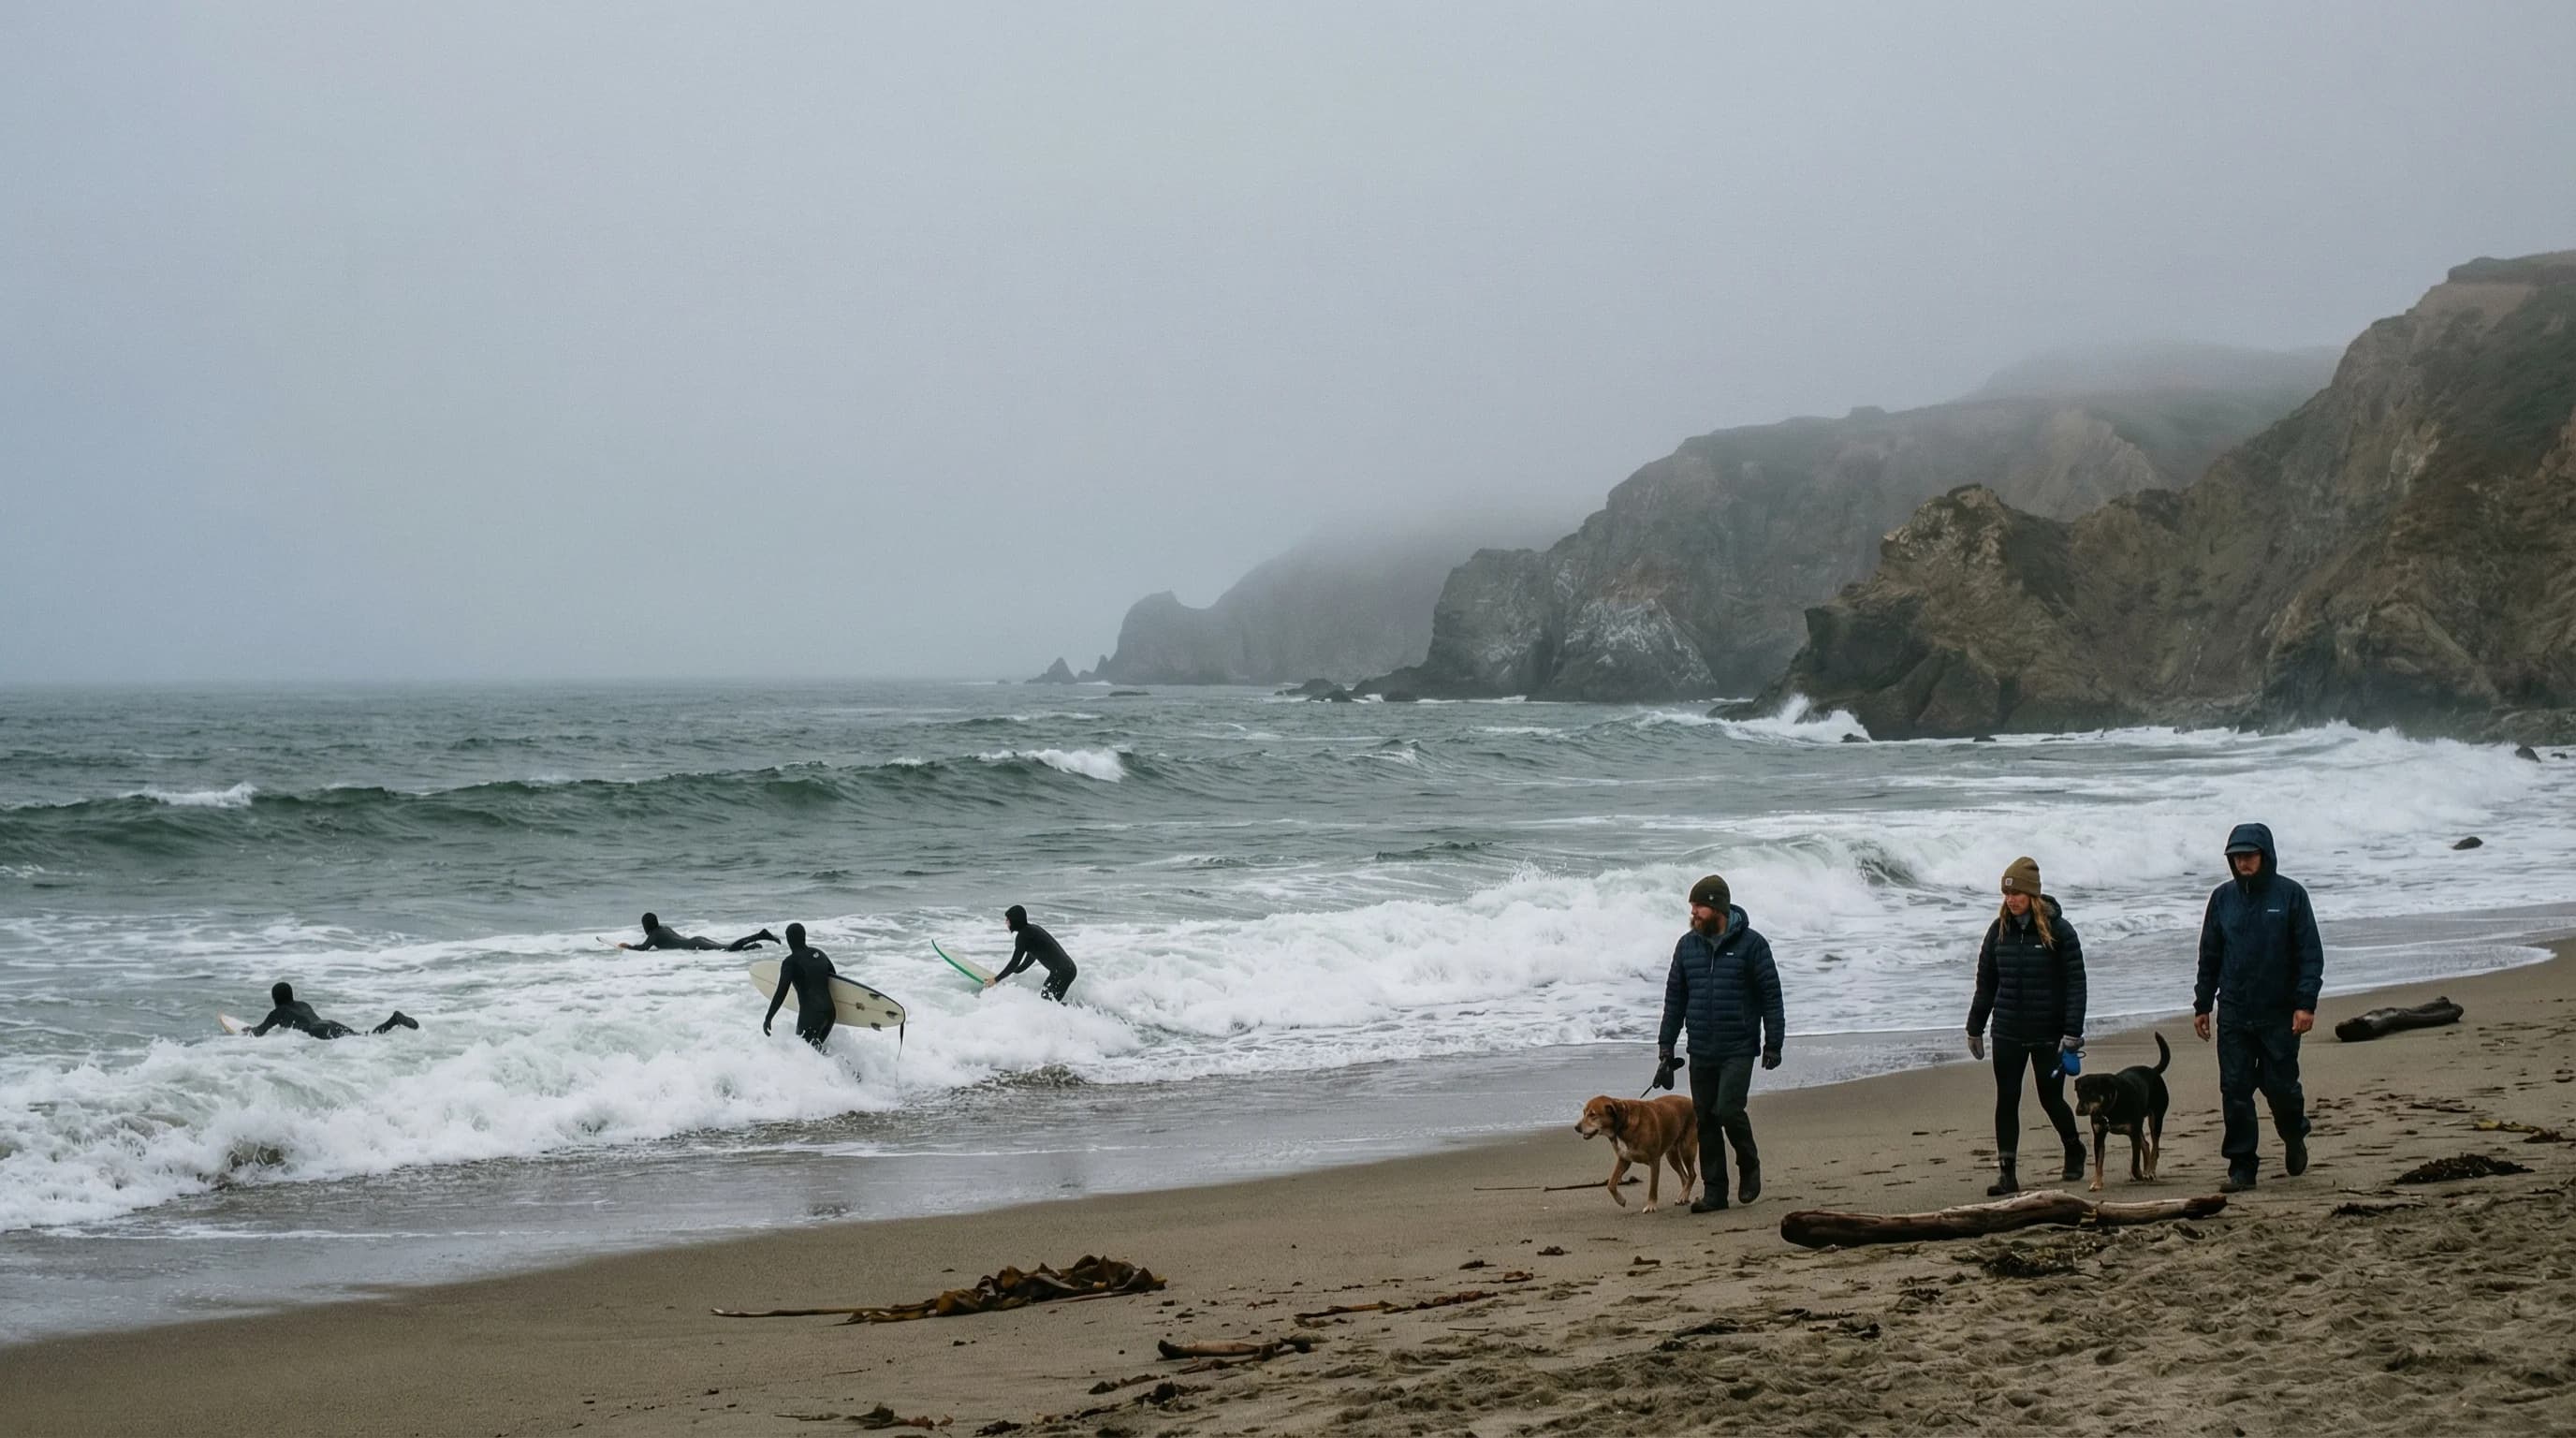
Pacifica's coastal valleys open directly to the northwest marine flow, producing July averages in the mid-50s°F and fog that locals call "Pacifog." The beach is dramatic but cold. September-October is the only reliably clear window.
5min read →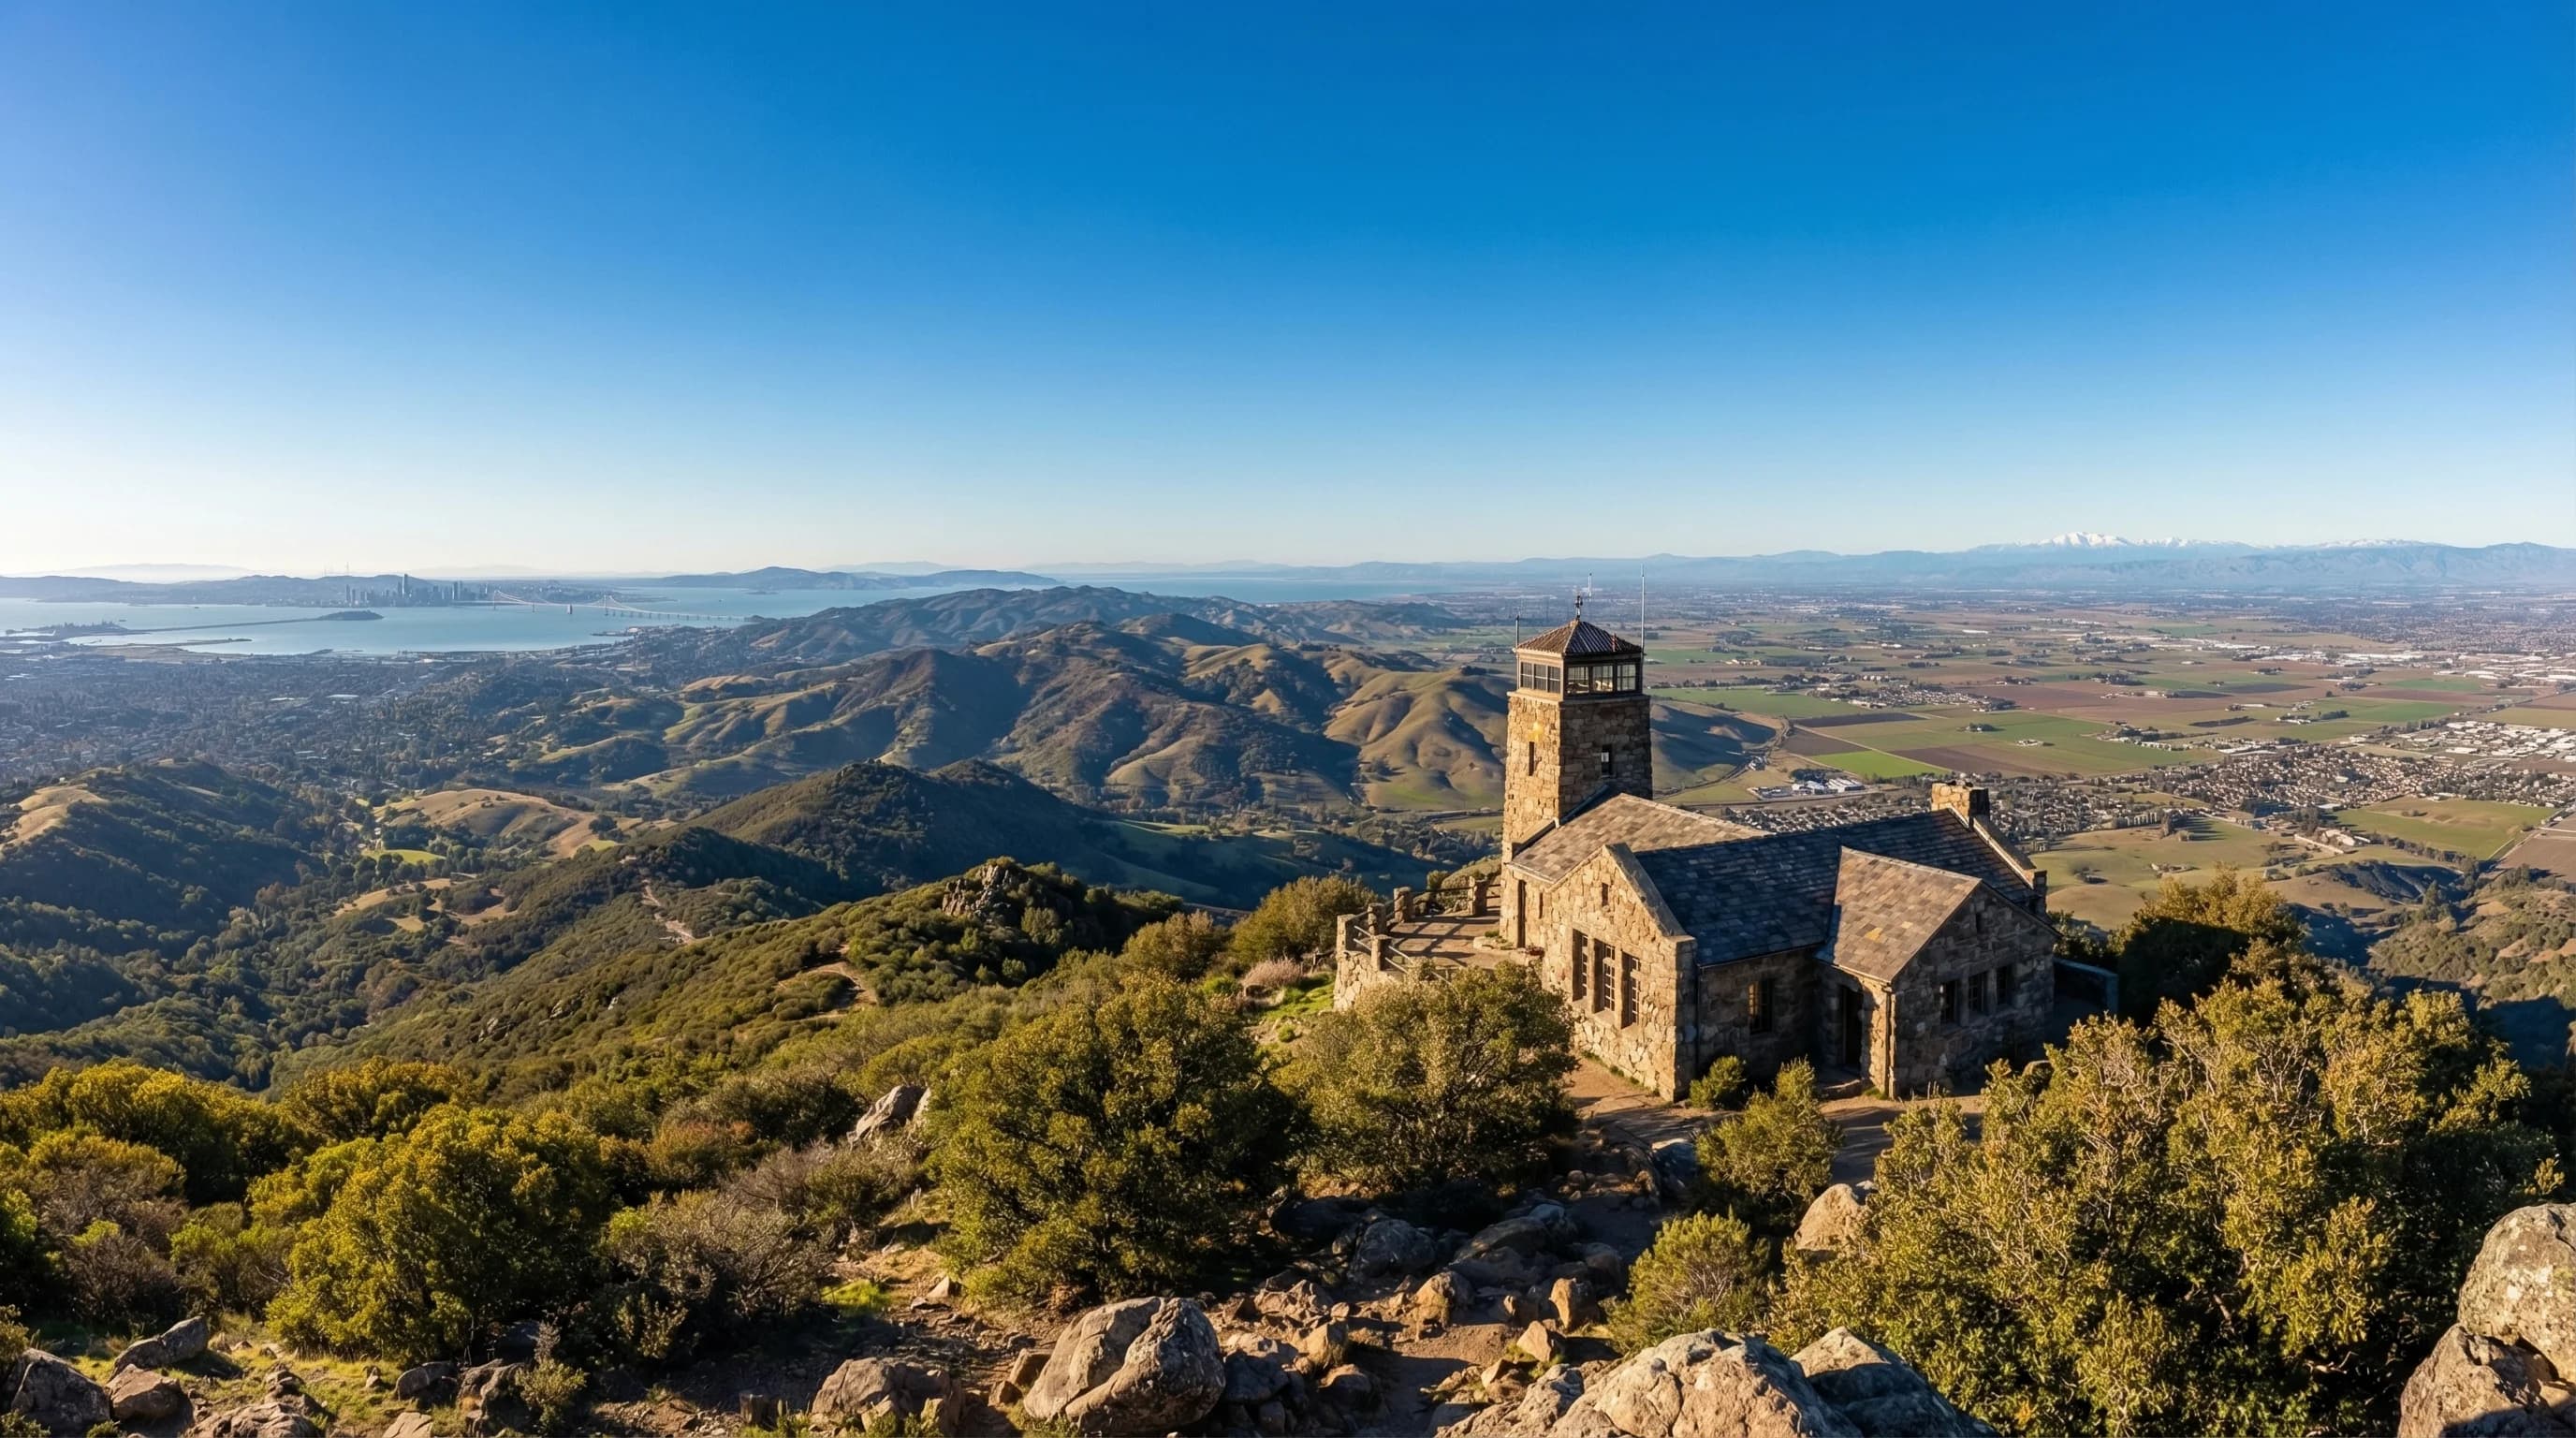
Mount Diablo's summit at 3,849 feet often rises above both the summer marine layer and winter tule fog, with views spanning the Sierra Nevada on clear days. The summit runs 18-20°F cooler than the Walnut Creek base.
6min read →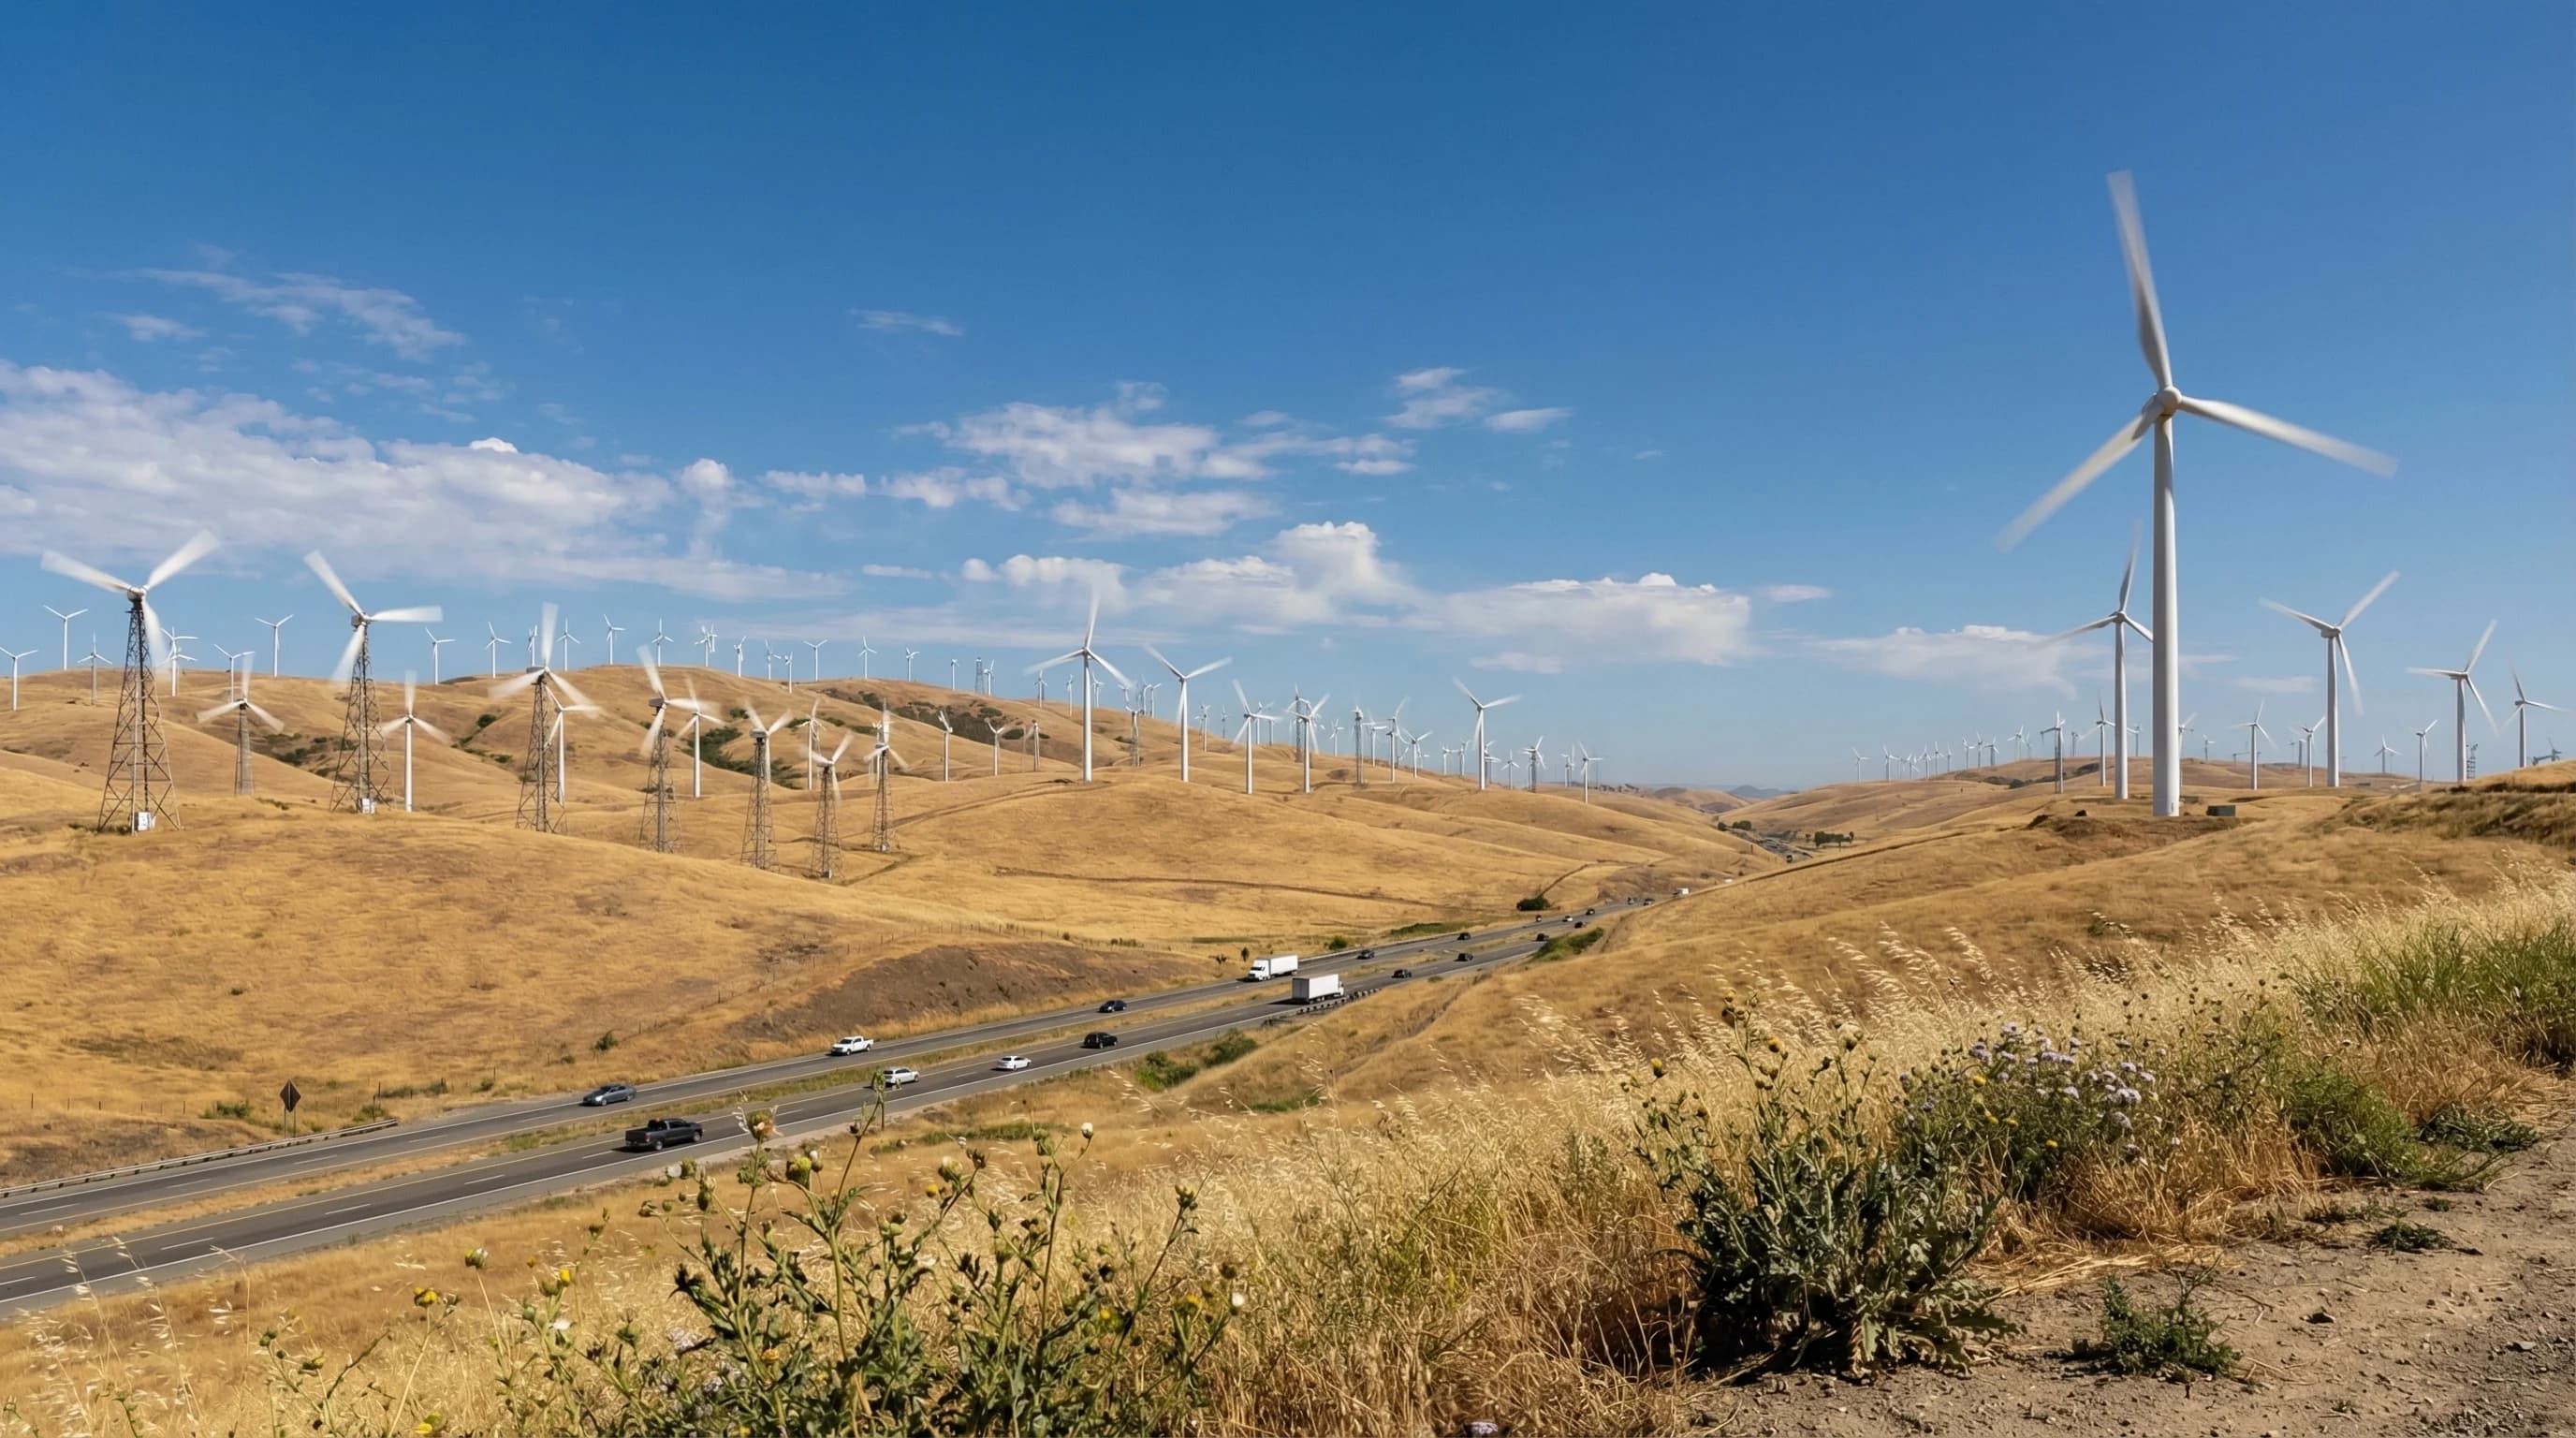
The Altamont Pass is a natural wind funnel connecting the Bay Area to the Central Valley, where summer pressure gradients drive 30-40 mph sustained winds. Over 4,500 wind turbines have operated here since the 1980s.
6min read →
Santa Rosa occupies the transitional zone between coastal fog and warm interior valleys, with July highs around 82°F and reliable afternoon marine cooling from the Petaluma Gap. Fall fire weather risk is severe.
6min read →
Calistoga sits at the narrow northern end of Napa Valley where marine cooling barely reaches, regularly exceeding 100°F in summer and running 15-20°F hotter than Napa city. Volcanic soils and enclosed valley walls amplify the heat.
6min read →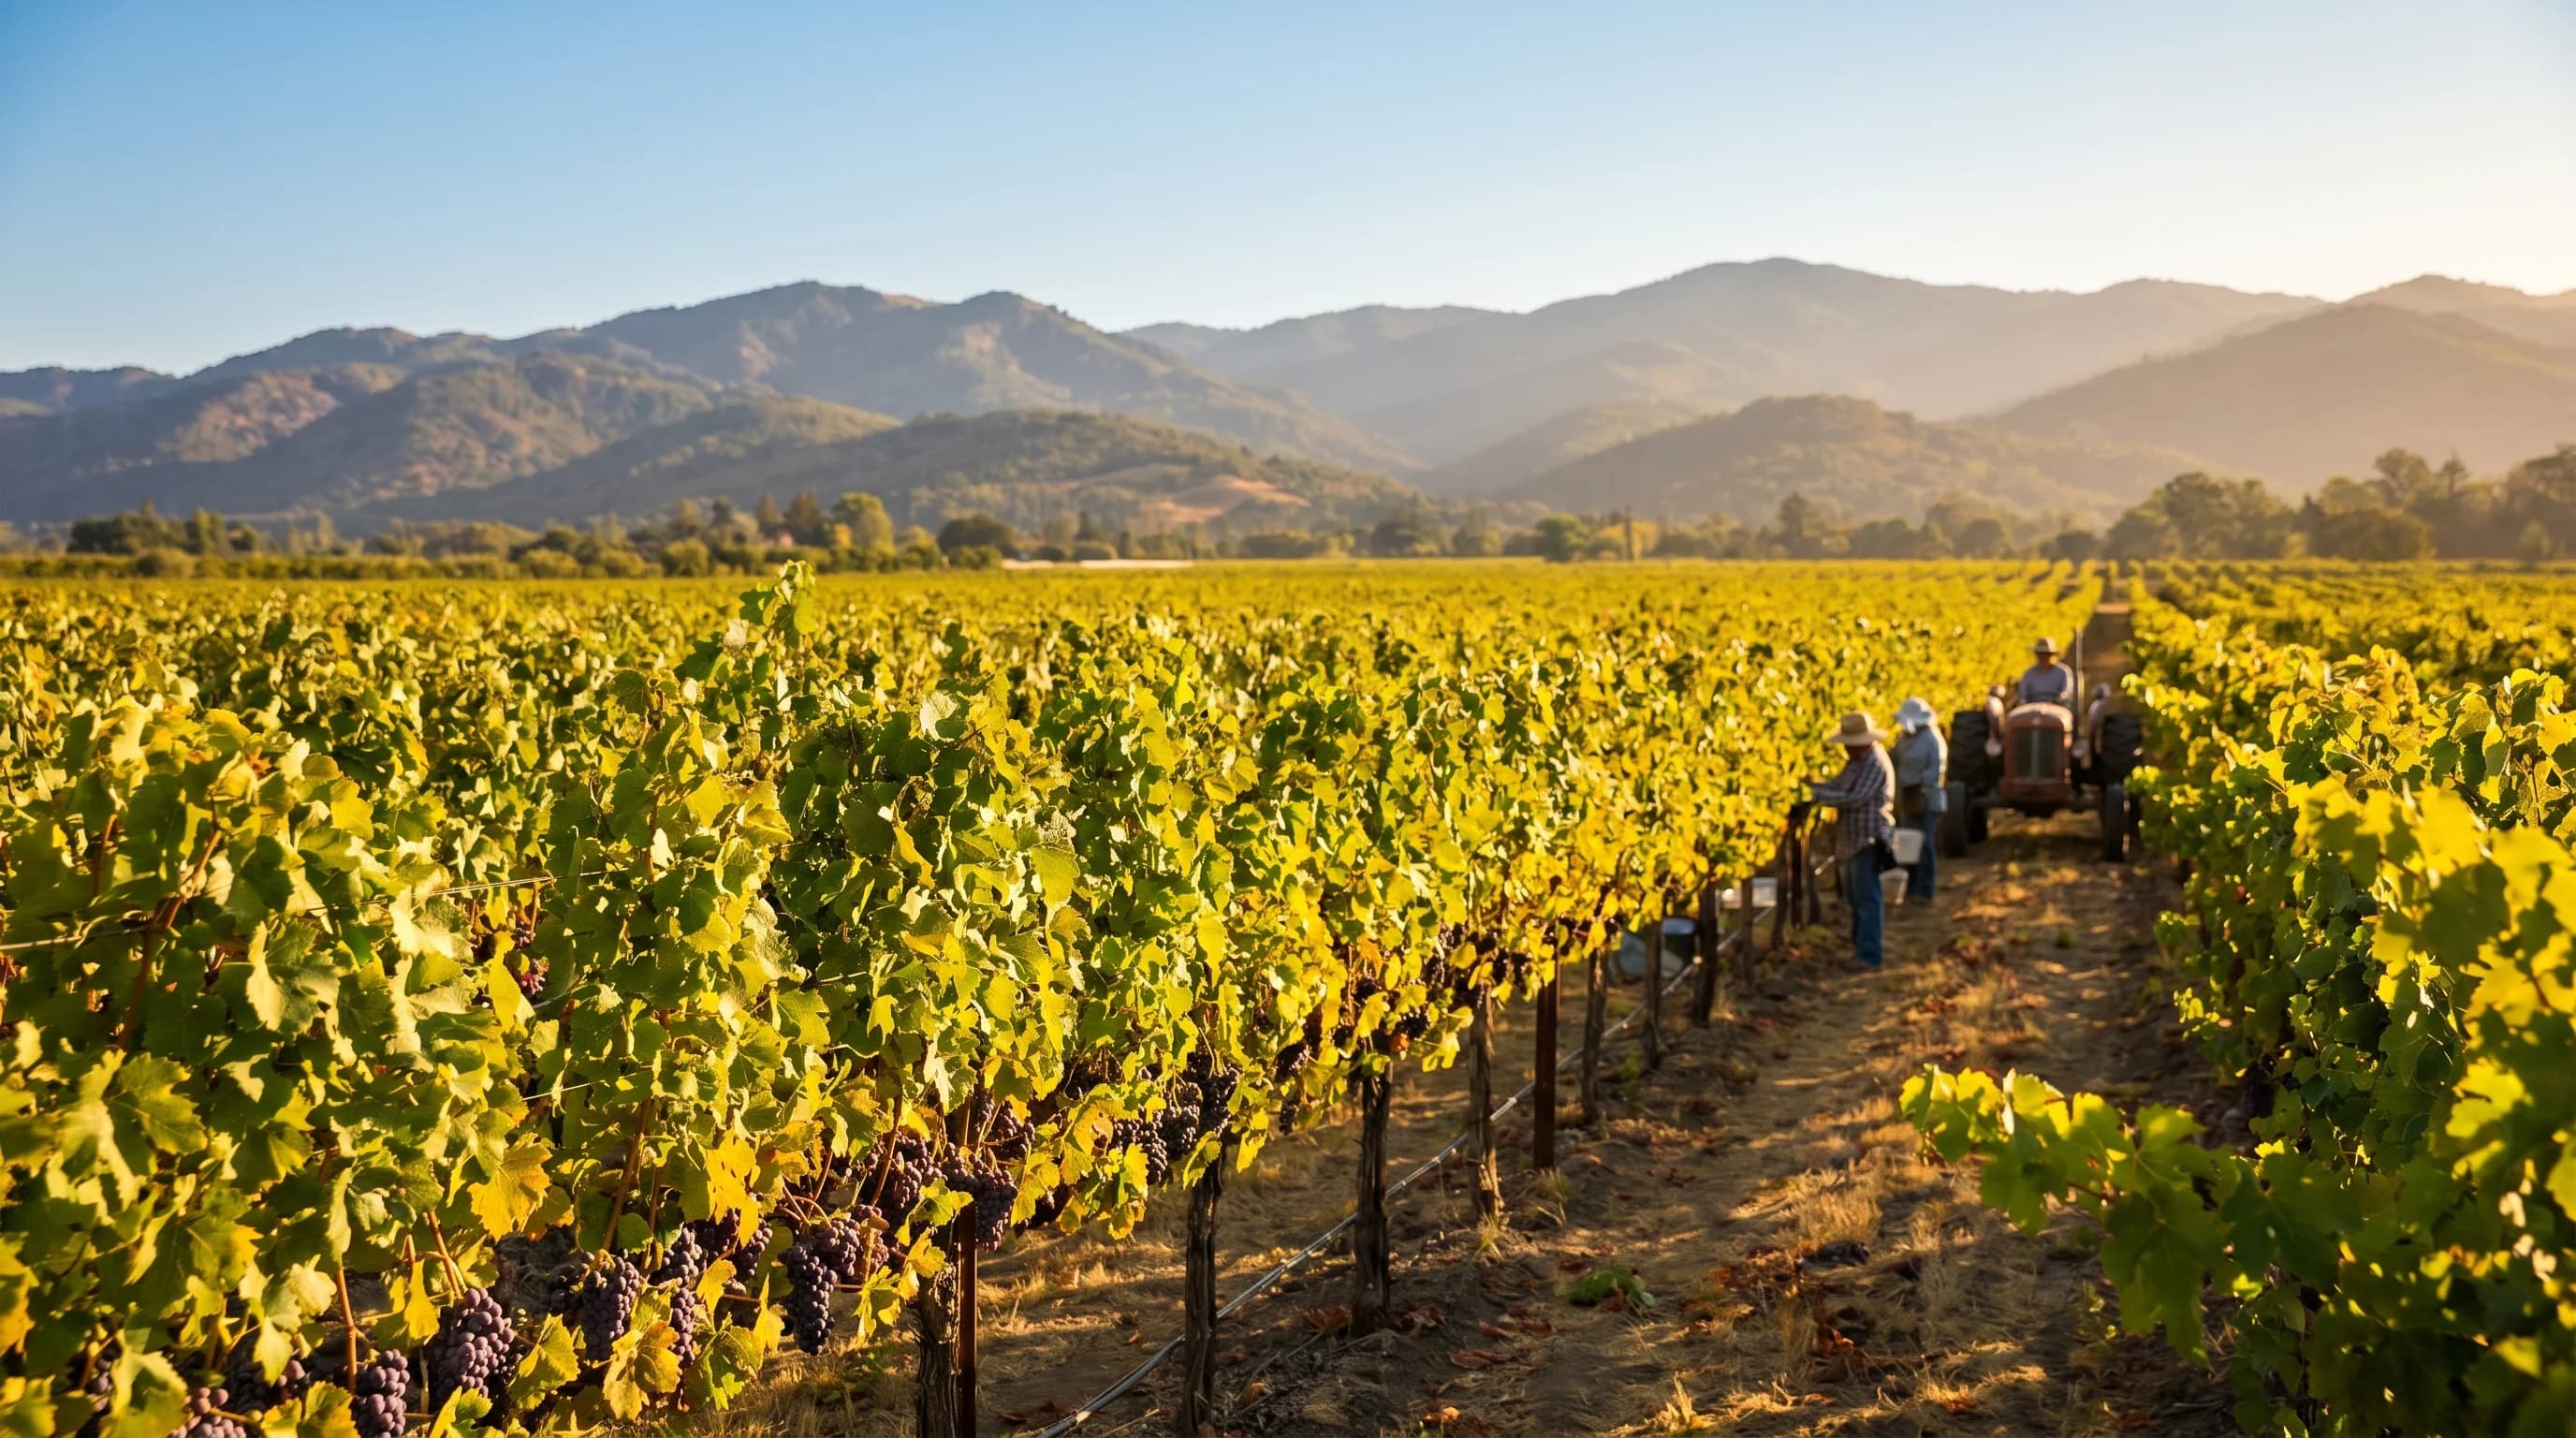
Napa Valley spans hot Calistoga (95°F summers) to moderate downtown Napa (78°F), with dry summers, wet winters, and September-October harvest as the best visit window.
6min read →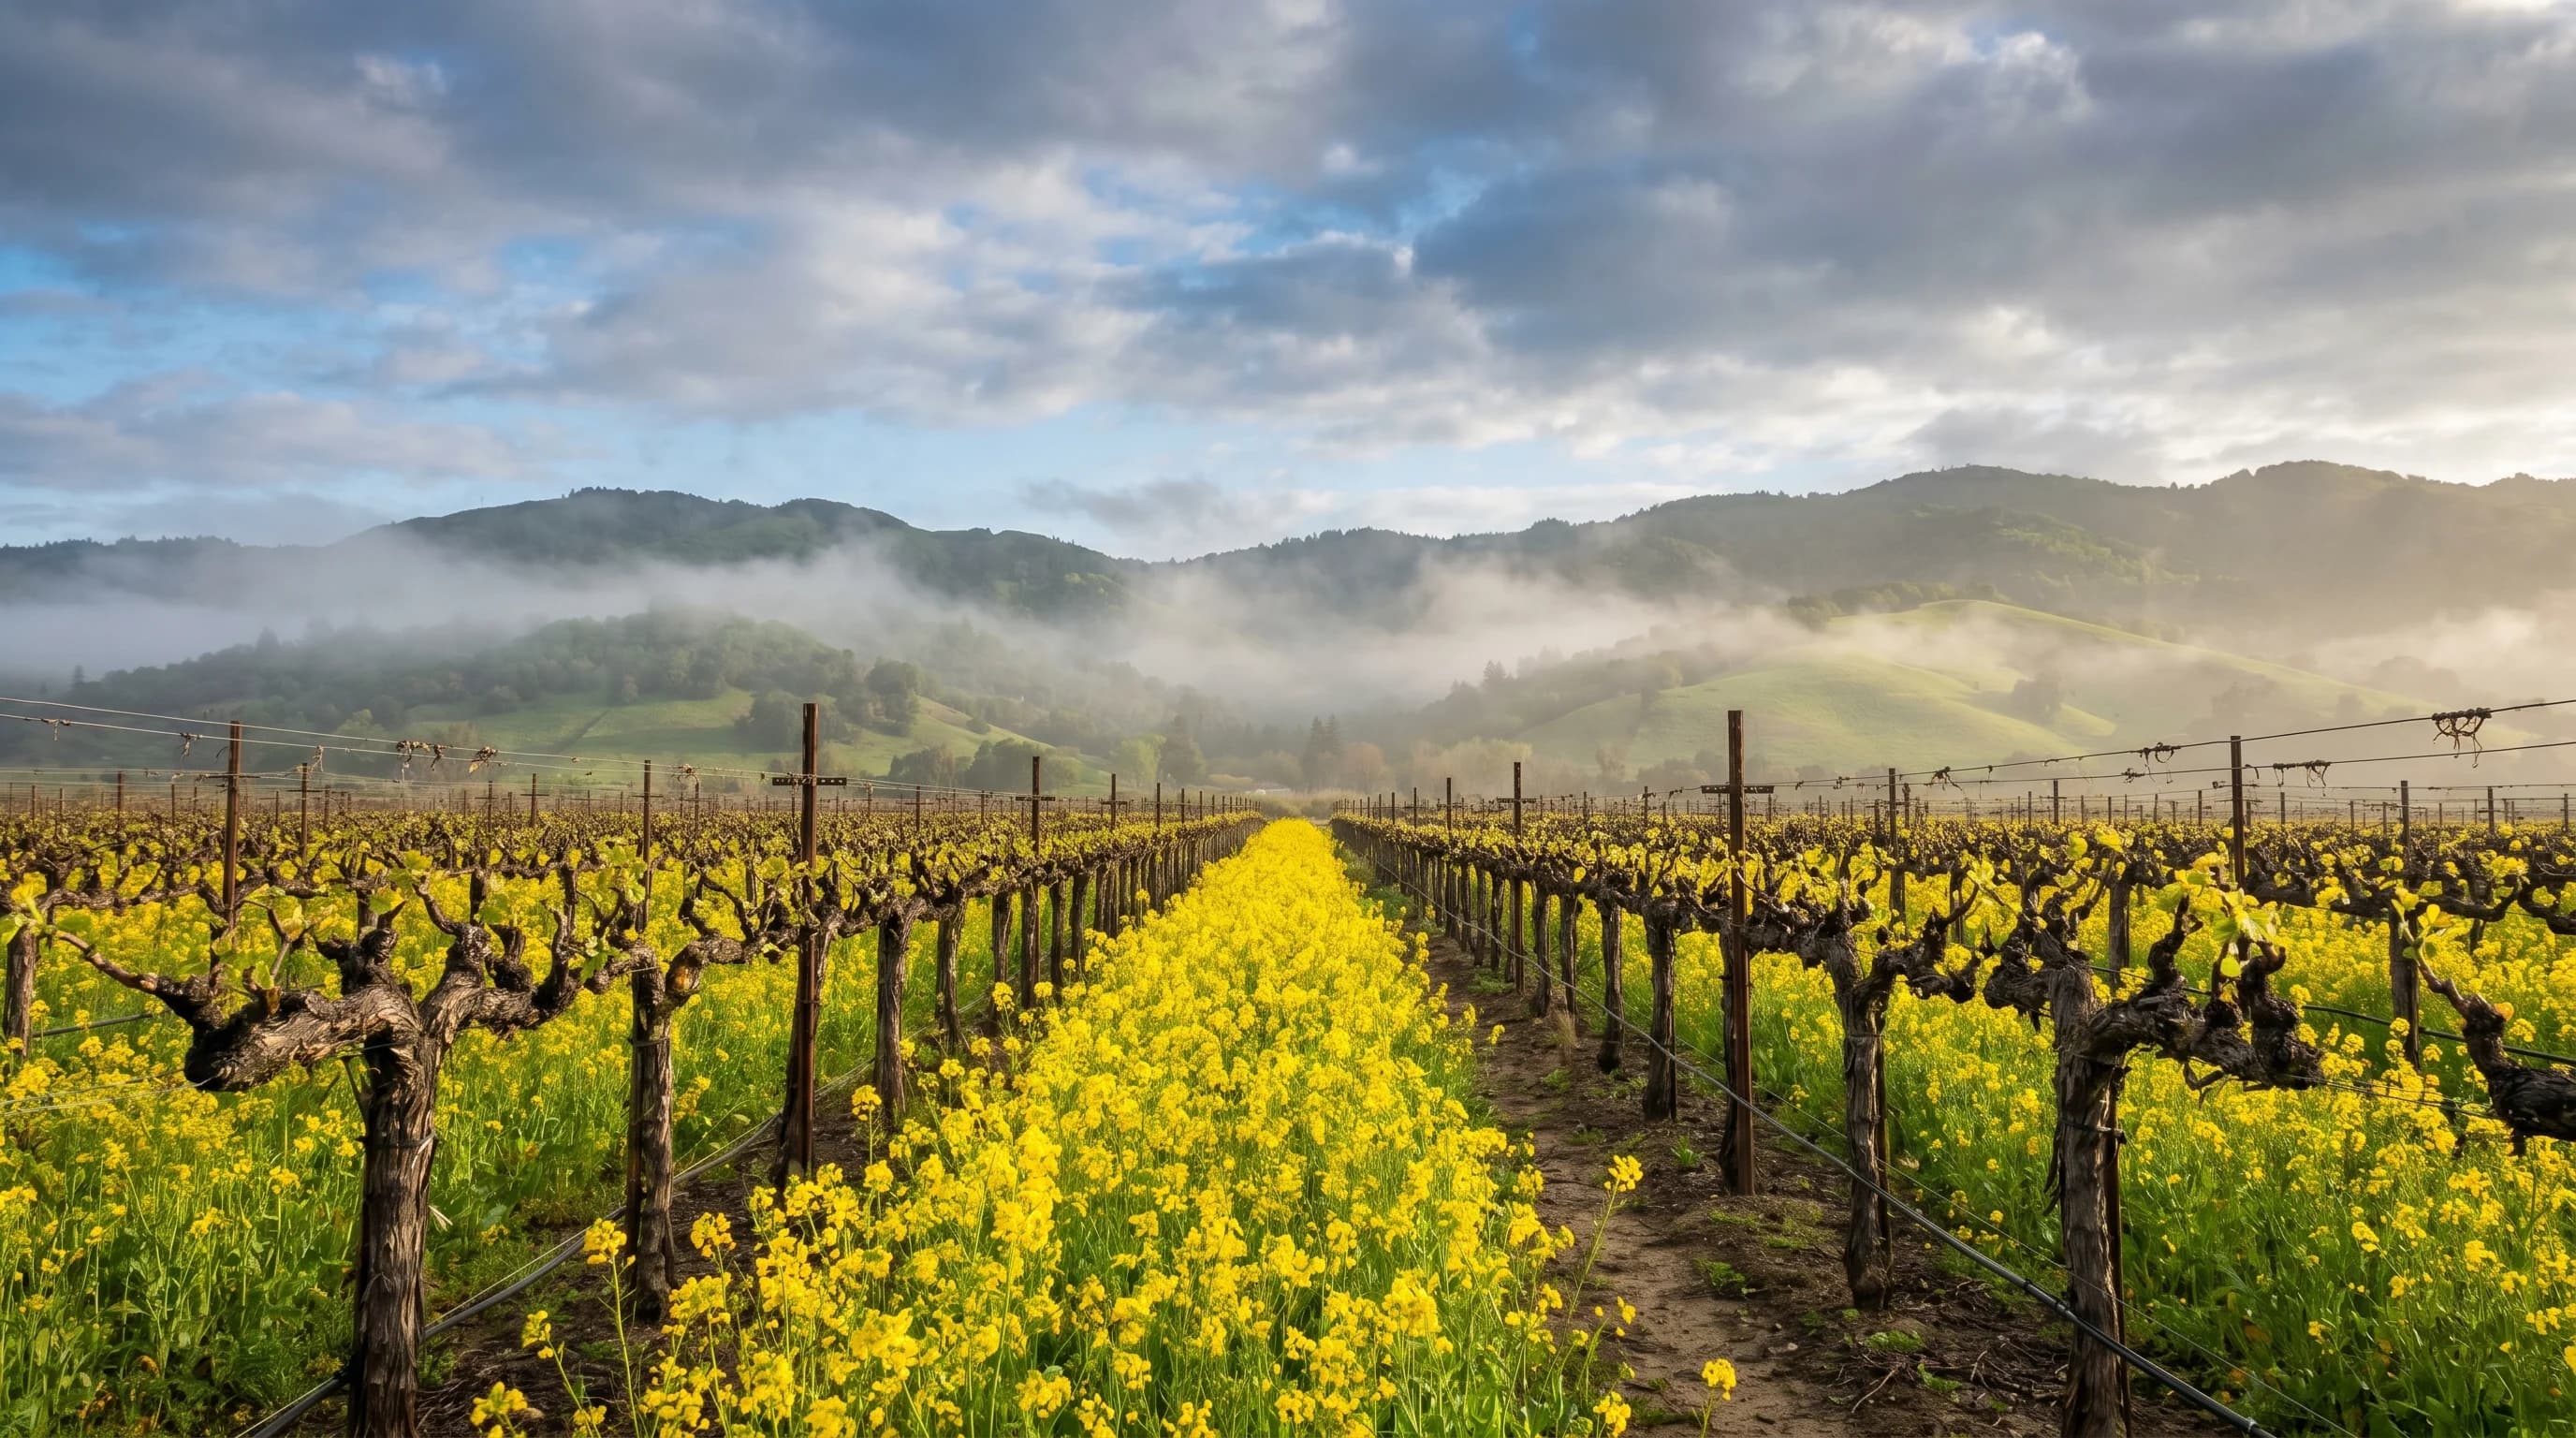
March is Napa Valley's shoulder season: 64°F highs, mustard flowers blooming, the last rains of winter, and lower hotel rates than harvest season.
5min read →
Fremont sits between the East Bay hills and the Diablo Range, with 82°F summer highs and 15 inches of annual rain. Warmer than SF, cooler than Livermore, drier than Oakland.
5min read →
Berkeley contains one of the Bay Area's sharpest climate gradients: foggy 60°F flatlands near the bay and sunny 78°F hills just four miles east, with 30+ inches of rain at the ridgeline.
6min read →Category
Weather at Bay Area events, venues, and activities, from Giants games to surf season and camping.
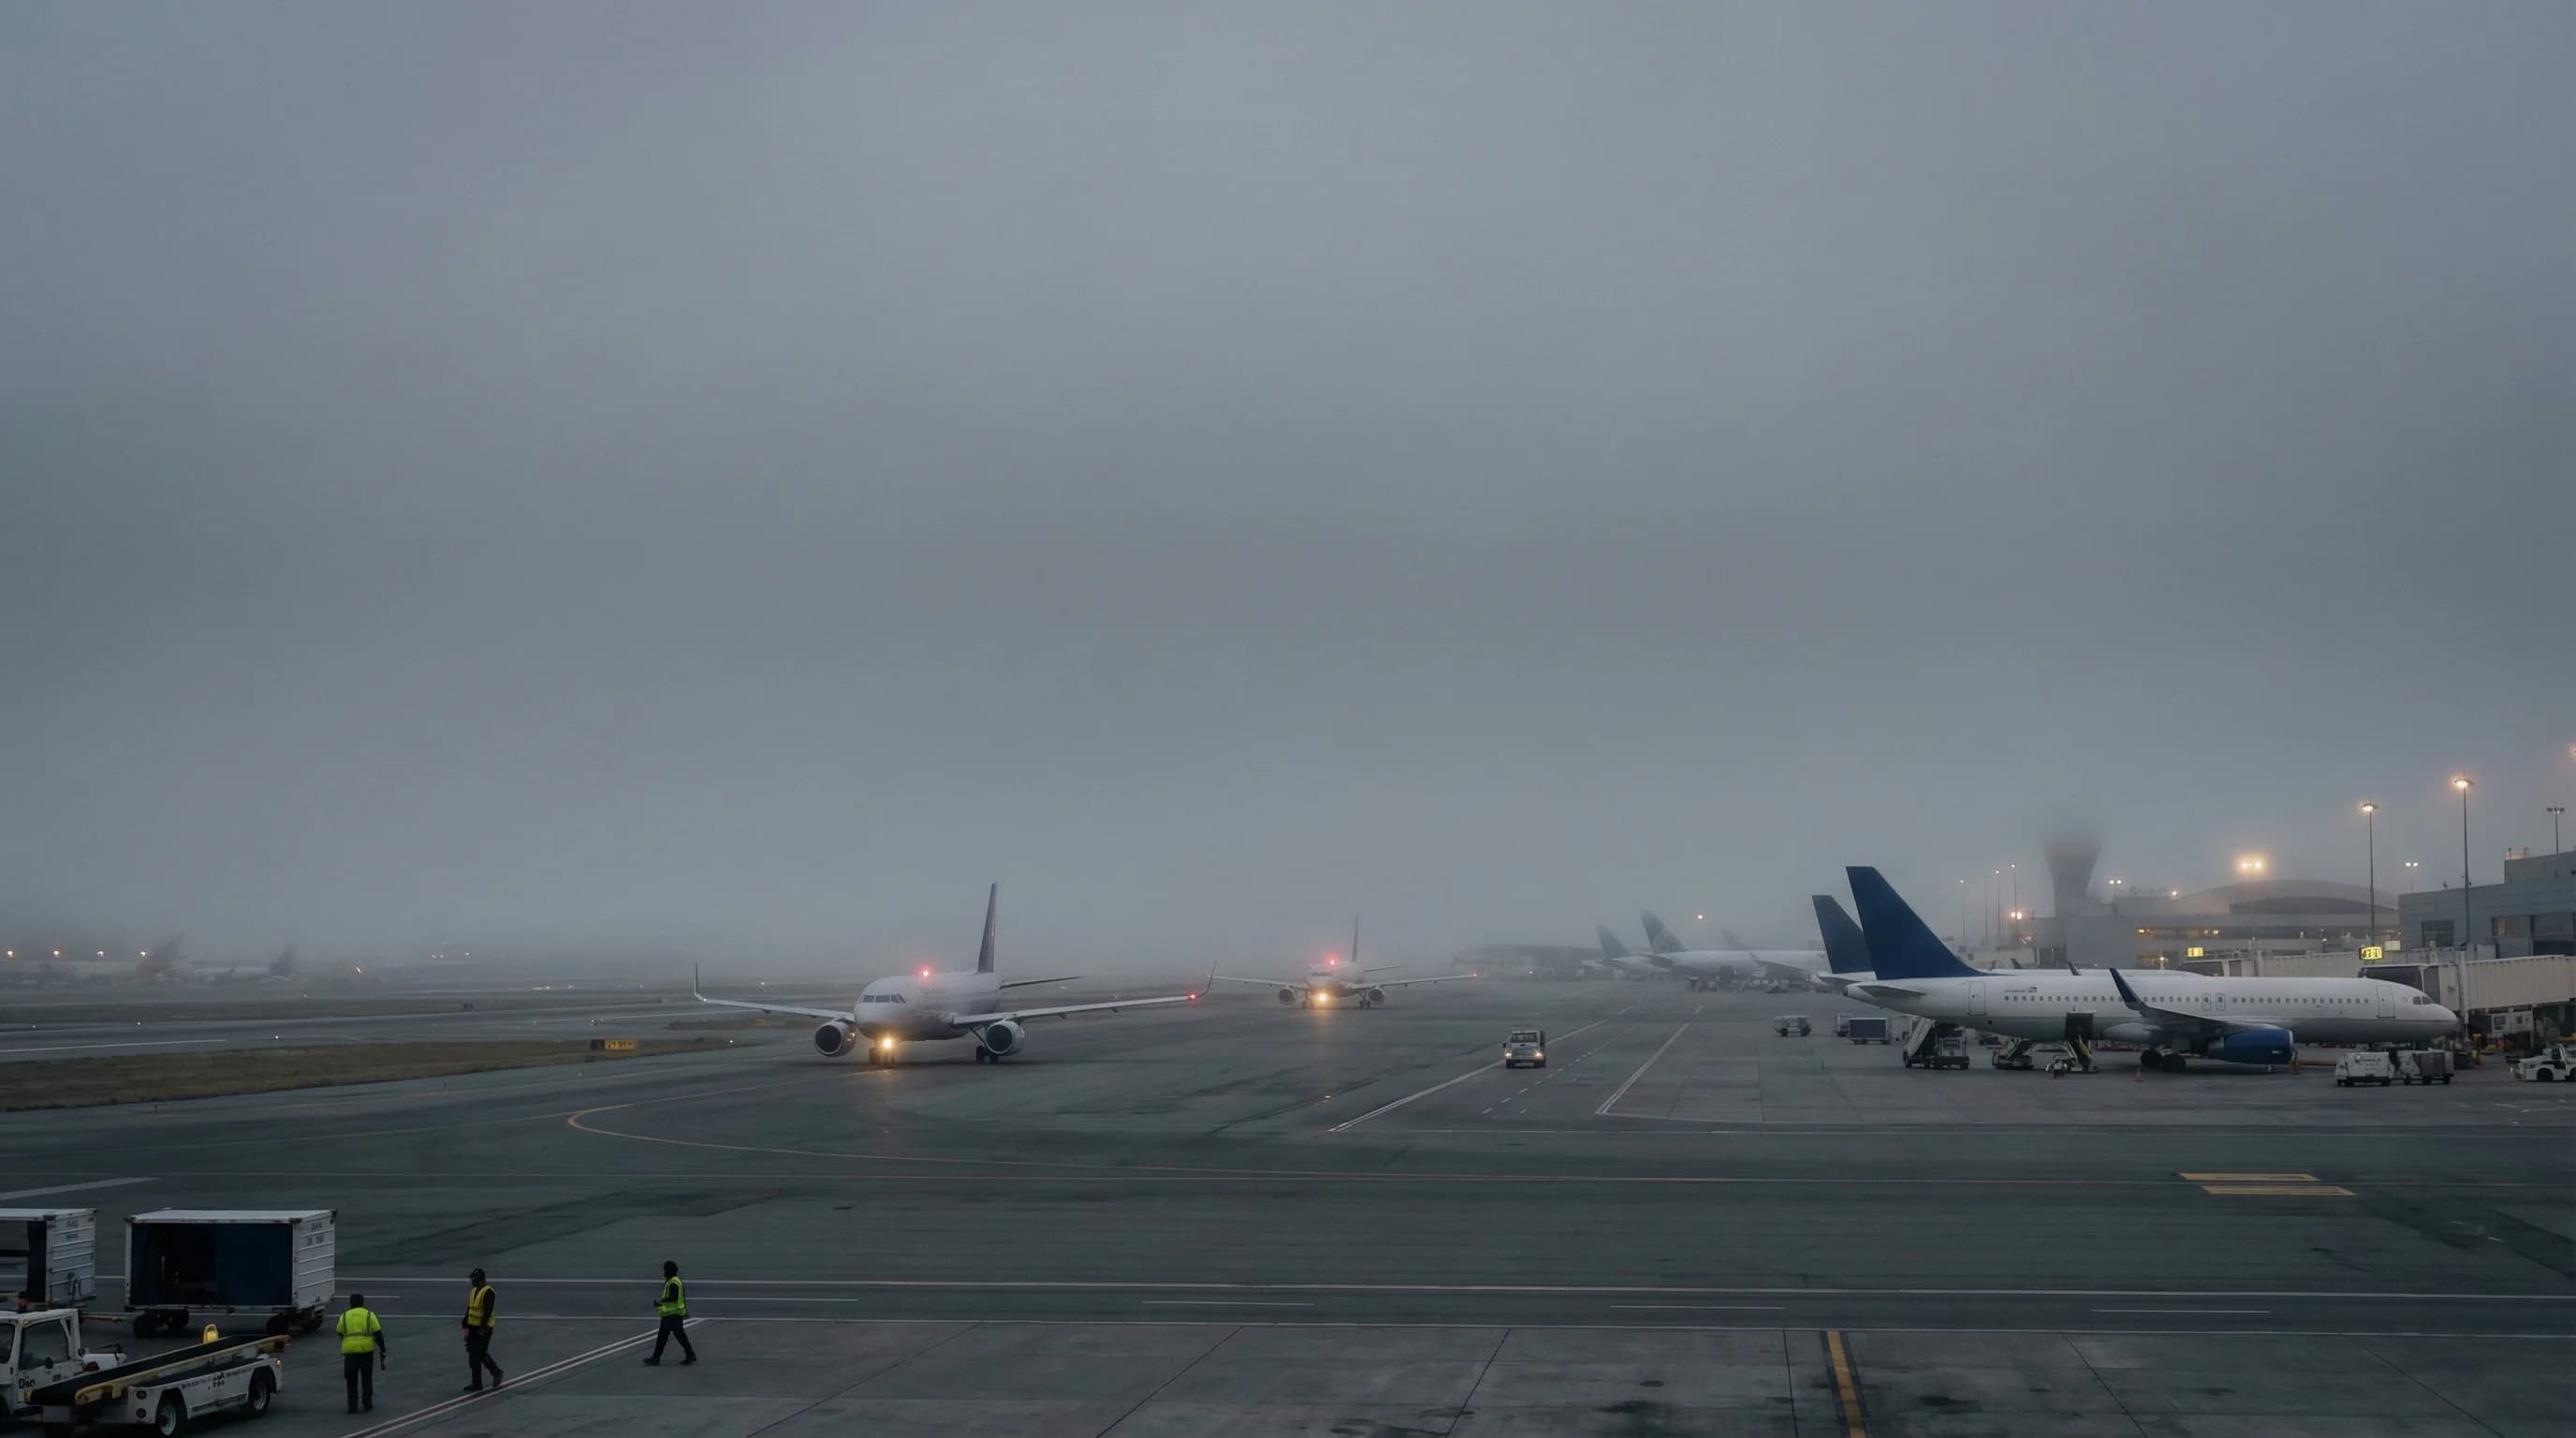
SFO is among the most weather-delayed major airports in the country, not from severe storms but from summer morning fog. When the marine layer drops visibility below approach minimums, arrival capacity is cut nearly in half, causing ground delay programs that cascade across the national network.
6min read →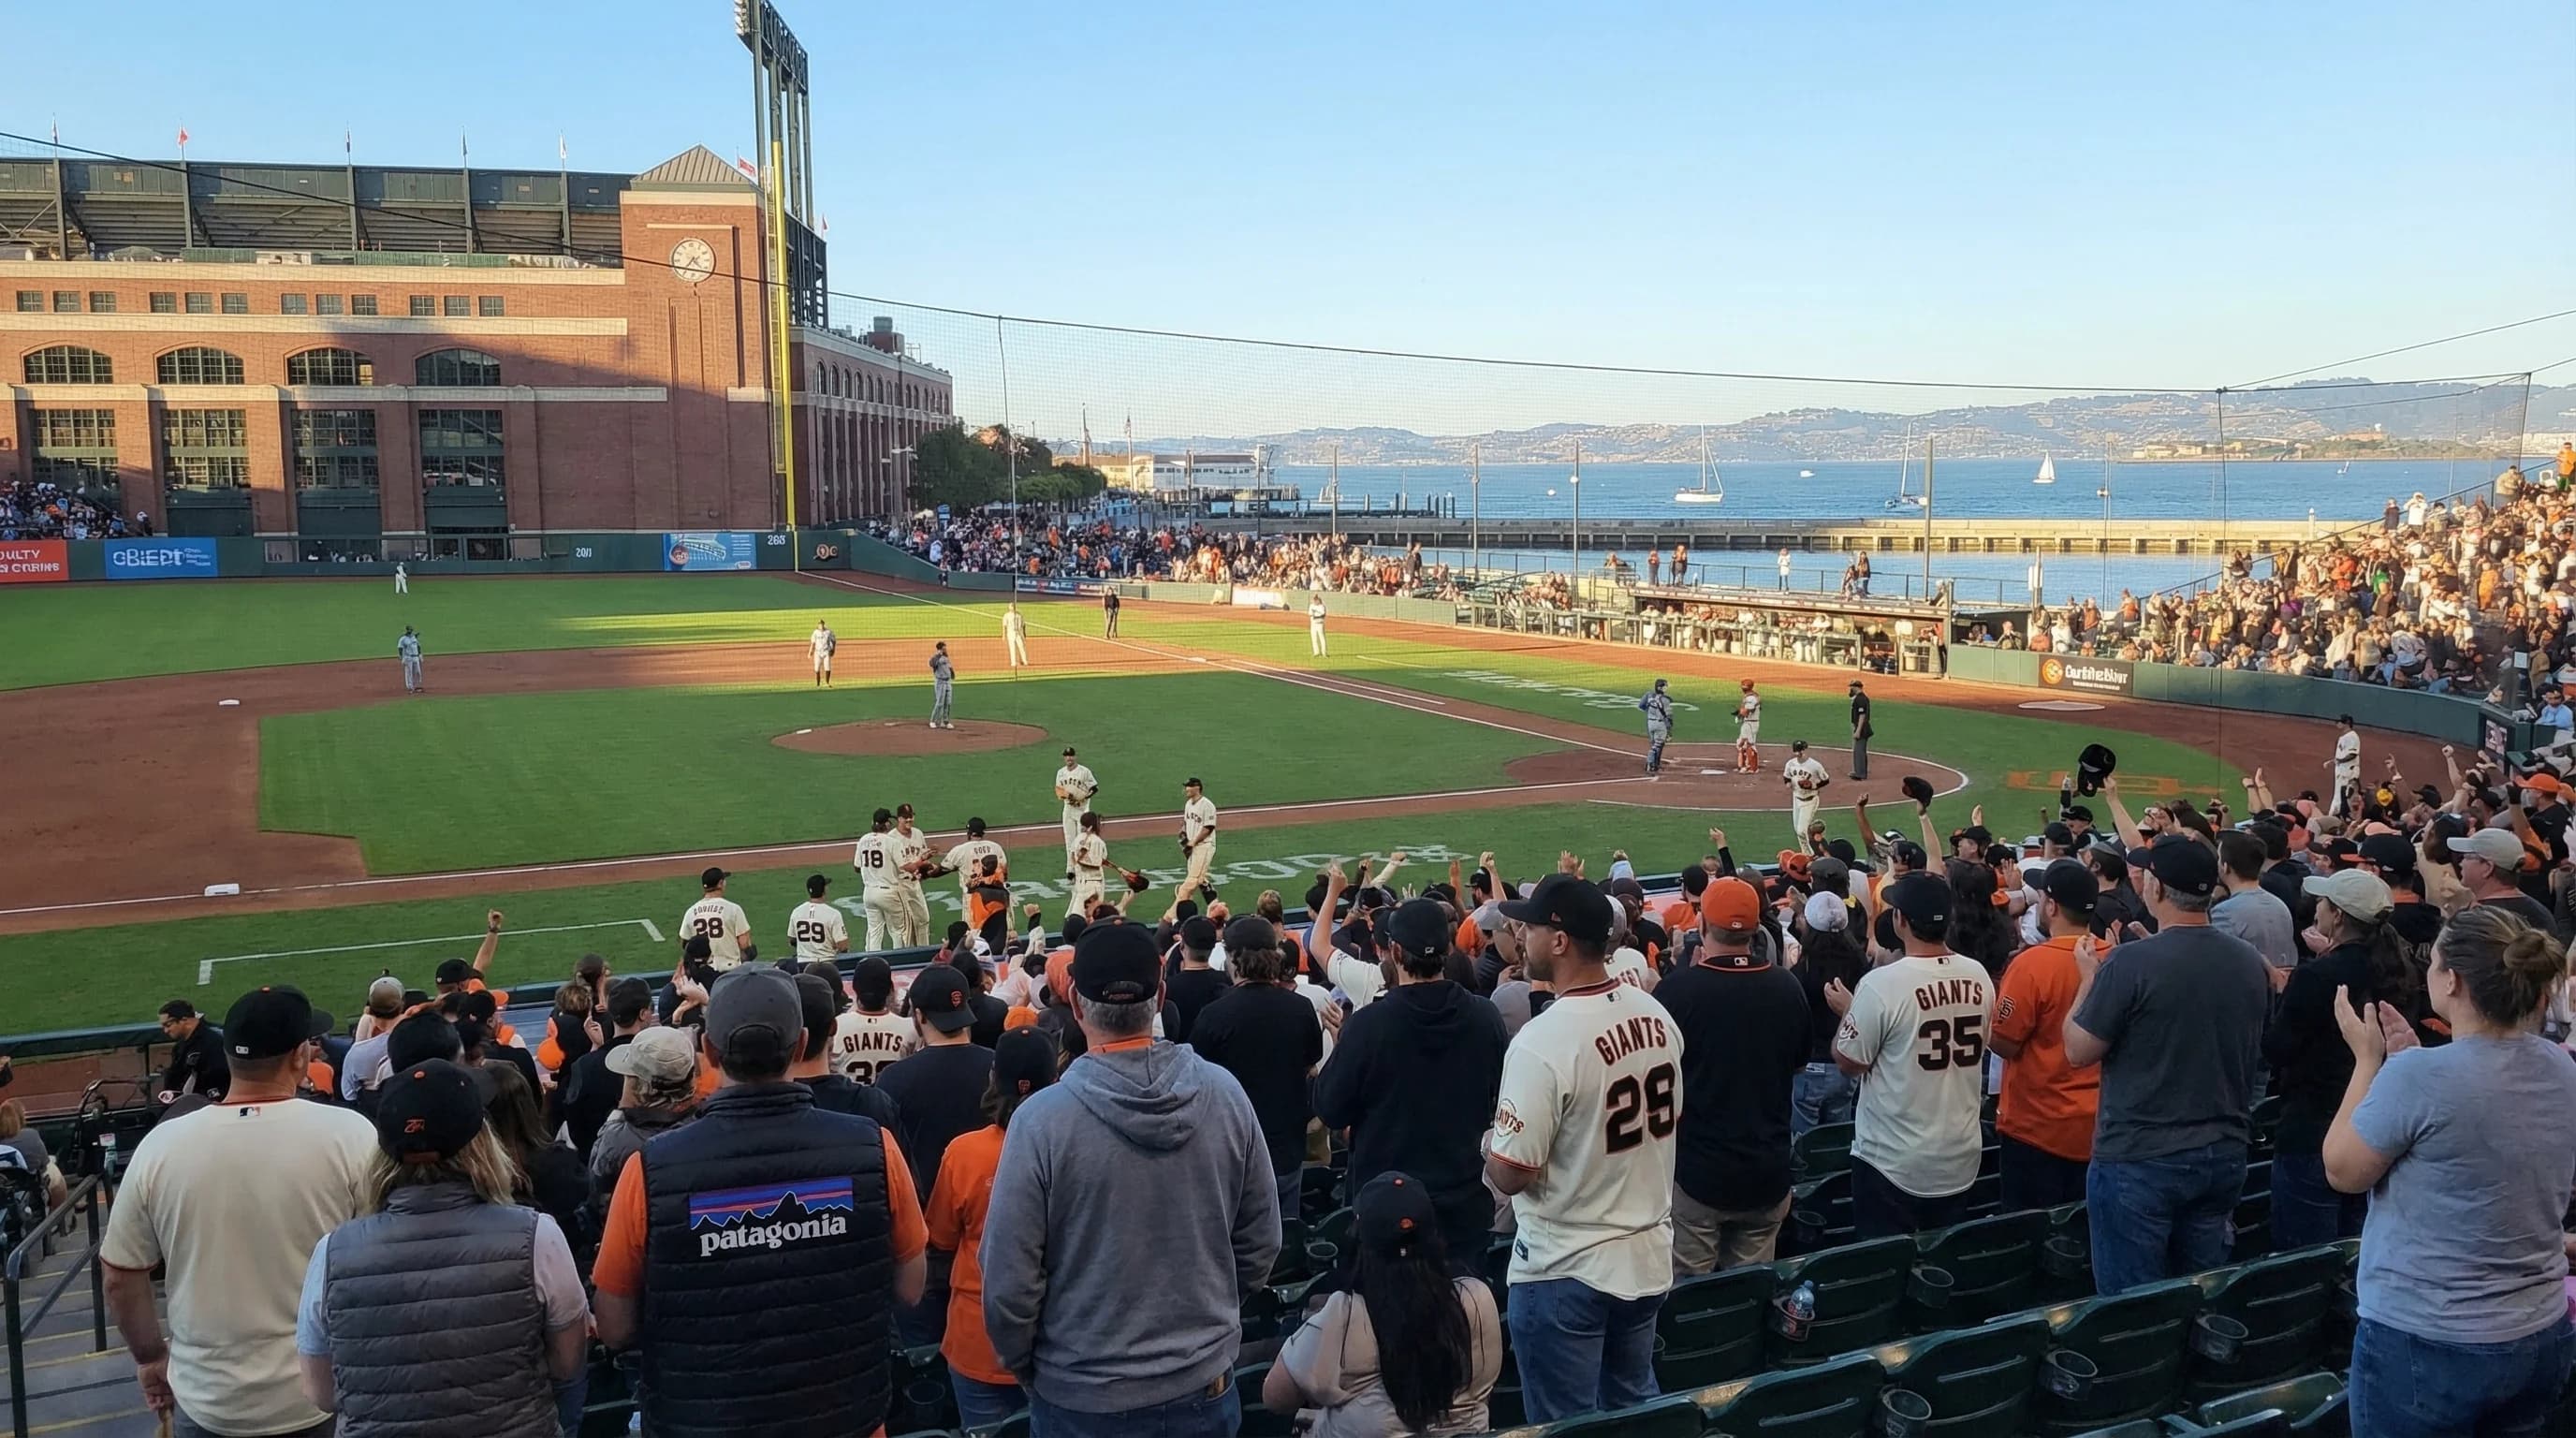
Oracle Park sits on the bay waterfront with a direct exposure to the afternoon sea breeze. July games are cold, 60°F with 20 mph wind. September and October games are warm and sunny. Knowing which games have which weather makes Oracle Park one of the best ballpark experiences in the country.
5min read →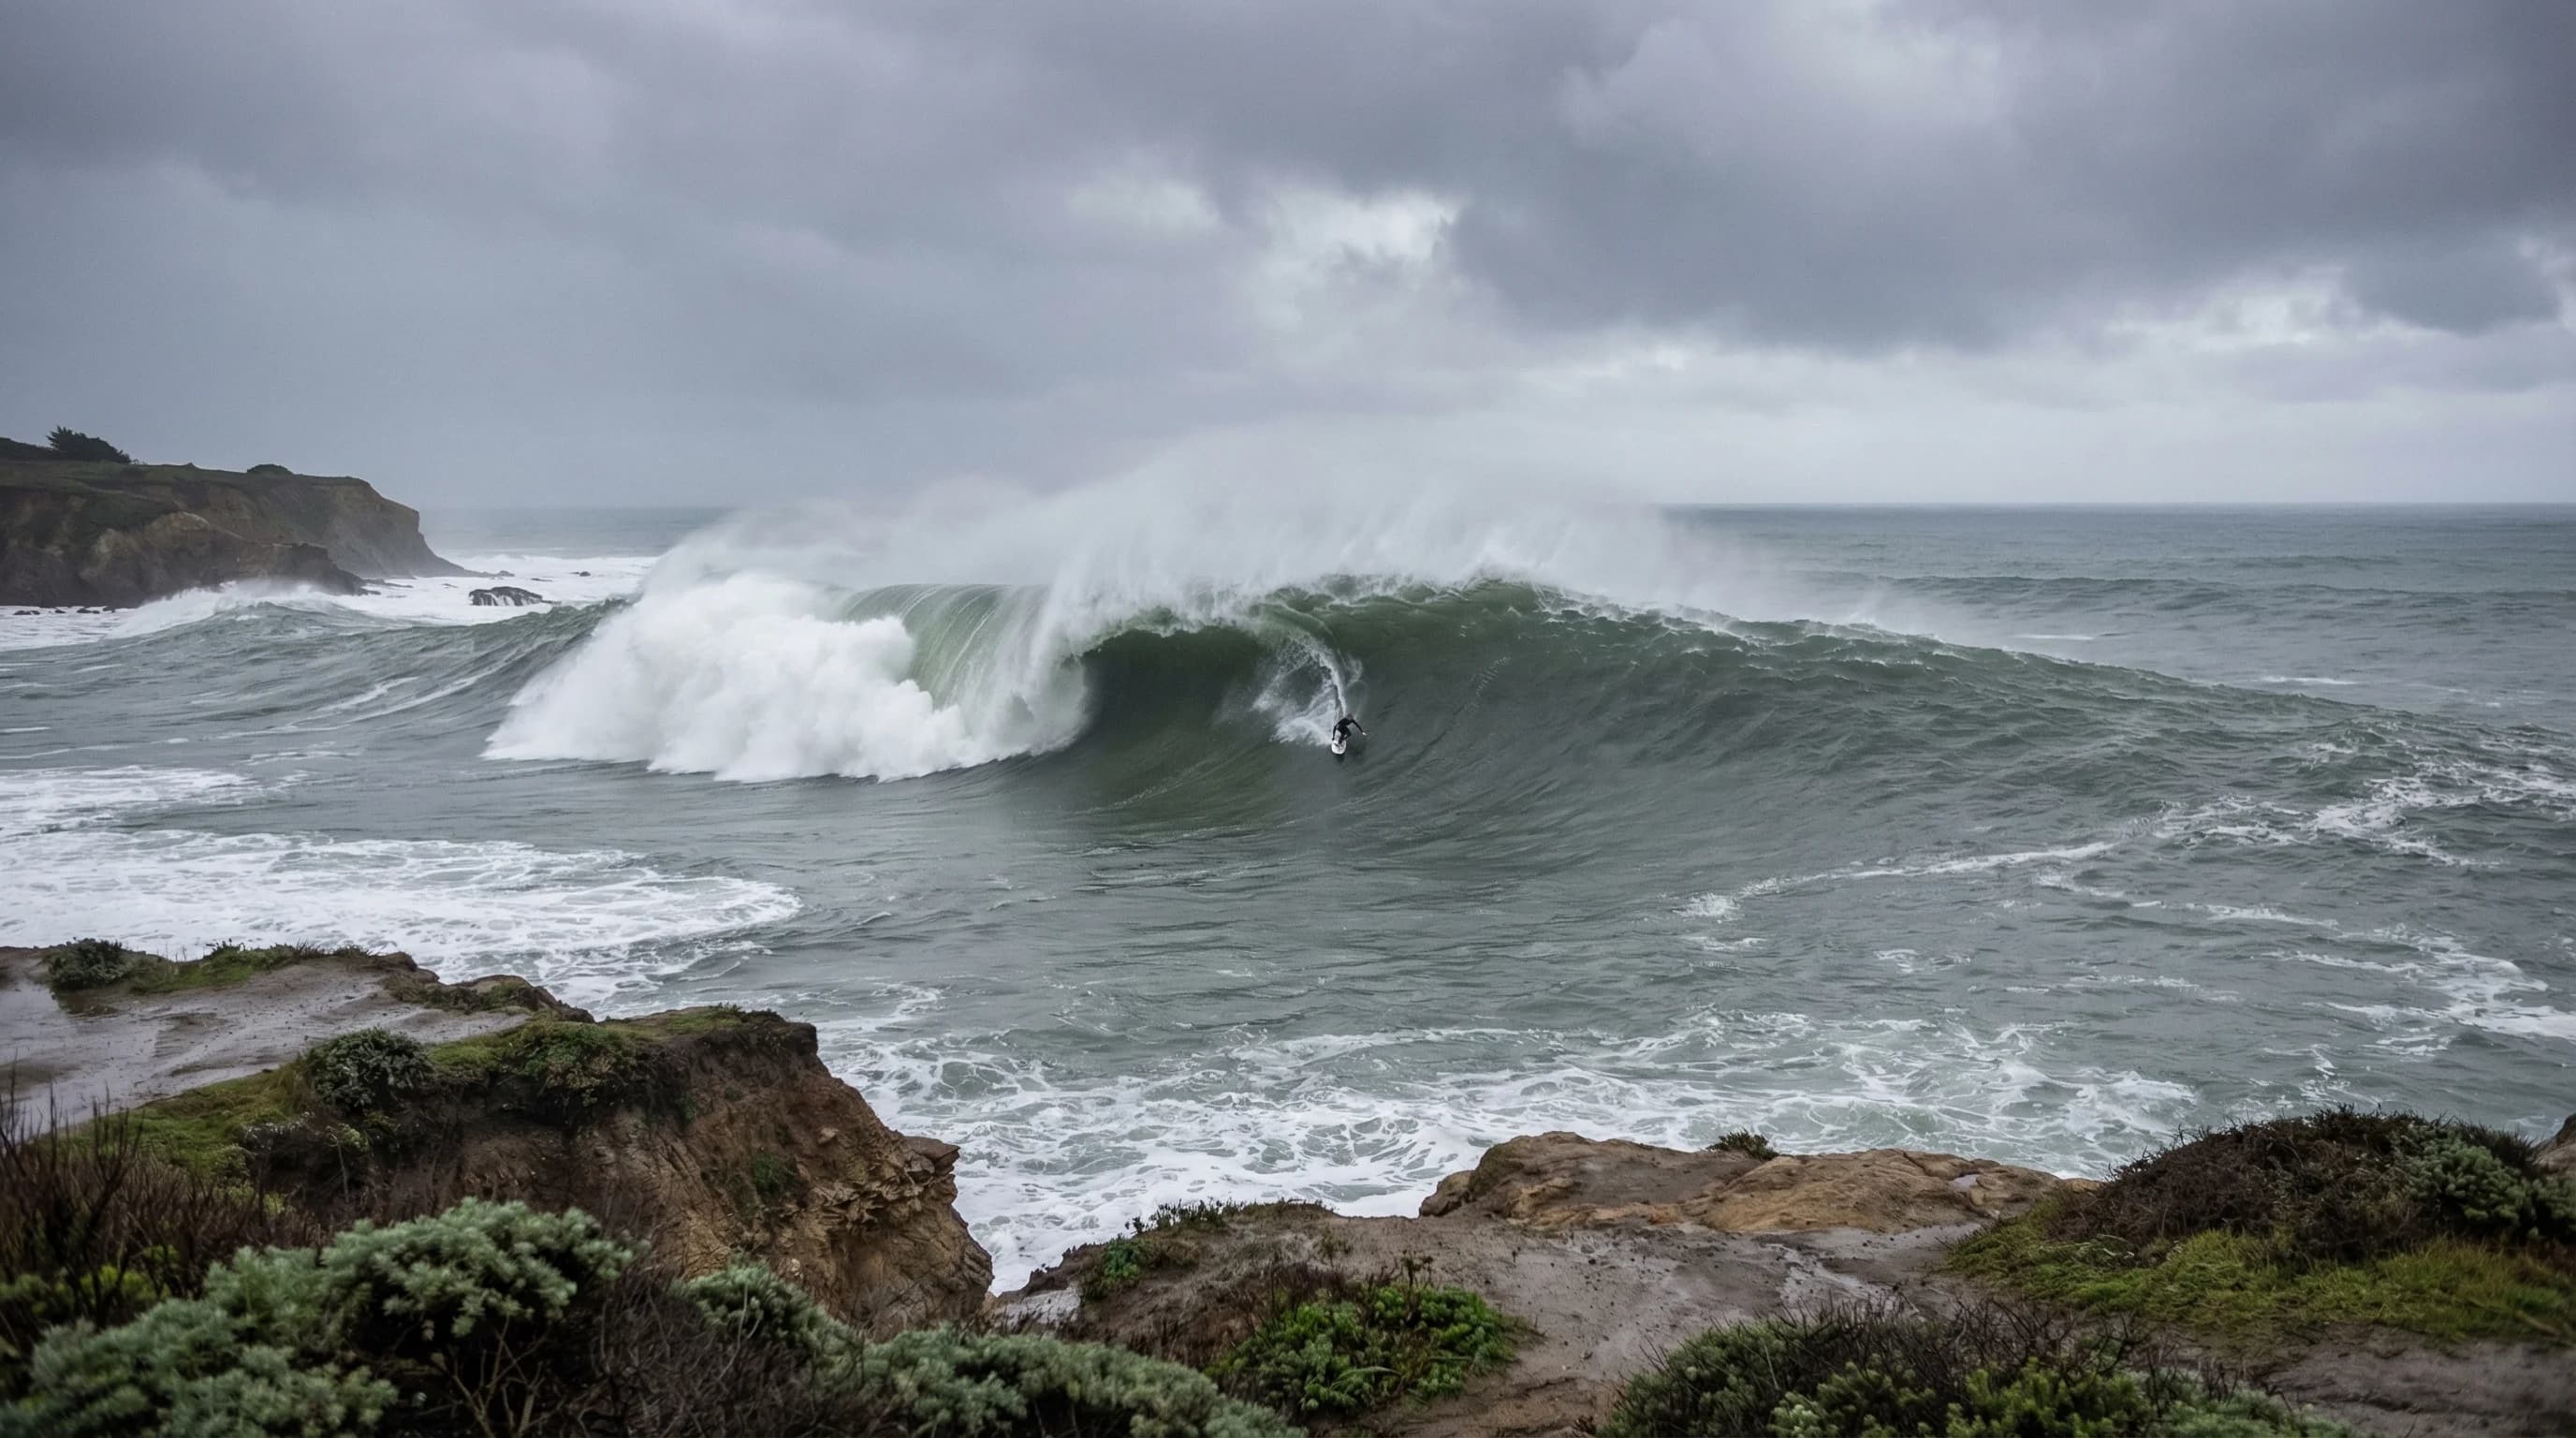
Mavericks at Half Moon Bay is dormant in summer and one of the most powerful waves on Earth in winter. The reef requires northwest swell from North Pacific winter storms, November through March. January and February produce the biggest days, with wave faces regularly reaching 40-60 feet.
6min read →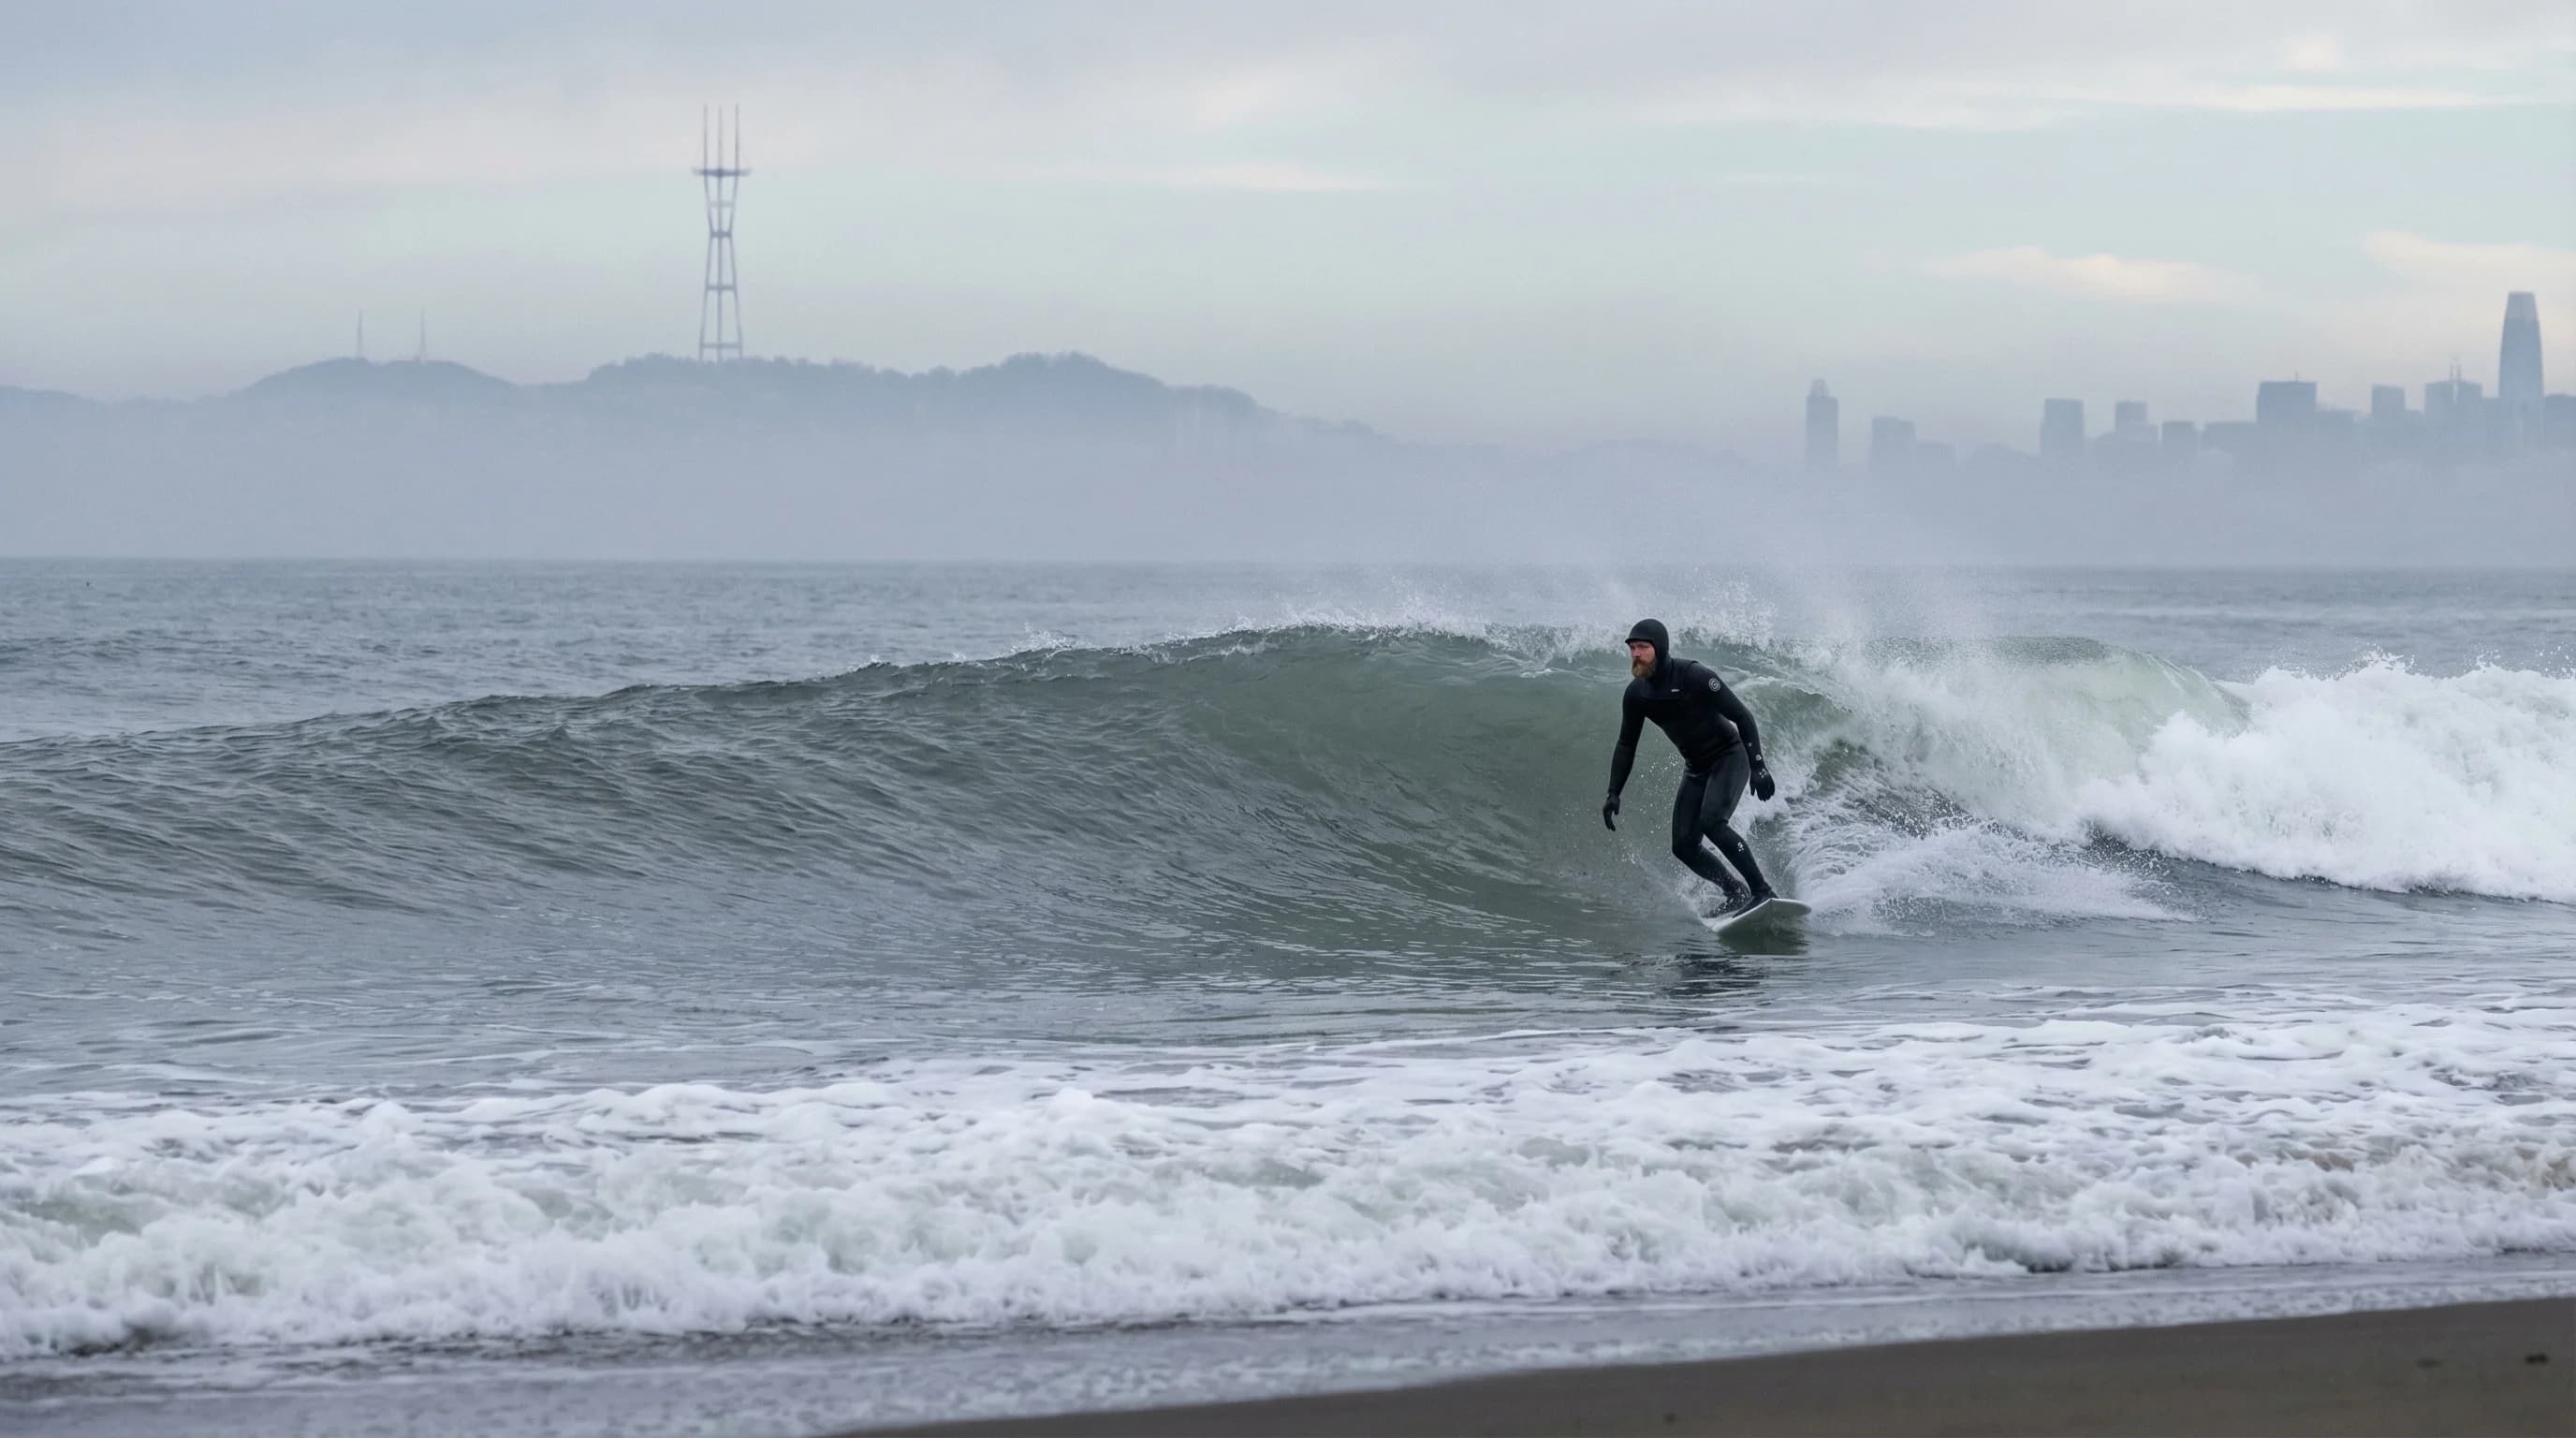
Fall is the best surfing season in the Bay Area, early North Pacific swells, easing wind, and uncrowded lineups. Winter brings the biggest waves but also the most onshore wind. Summer waves are small but accessible for beginners if you surf in the morning before the sea breeze builds.
6min read →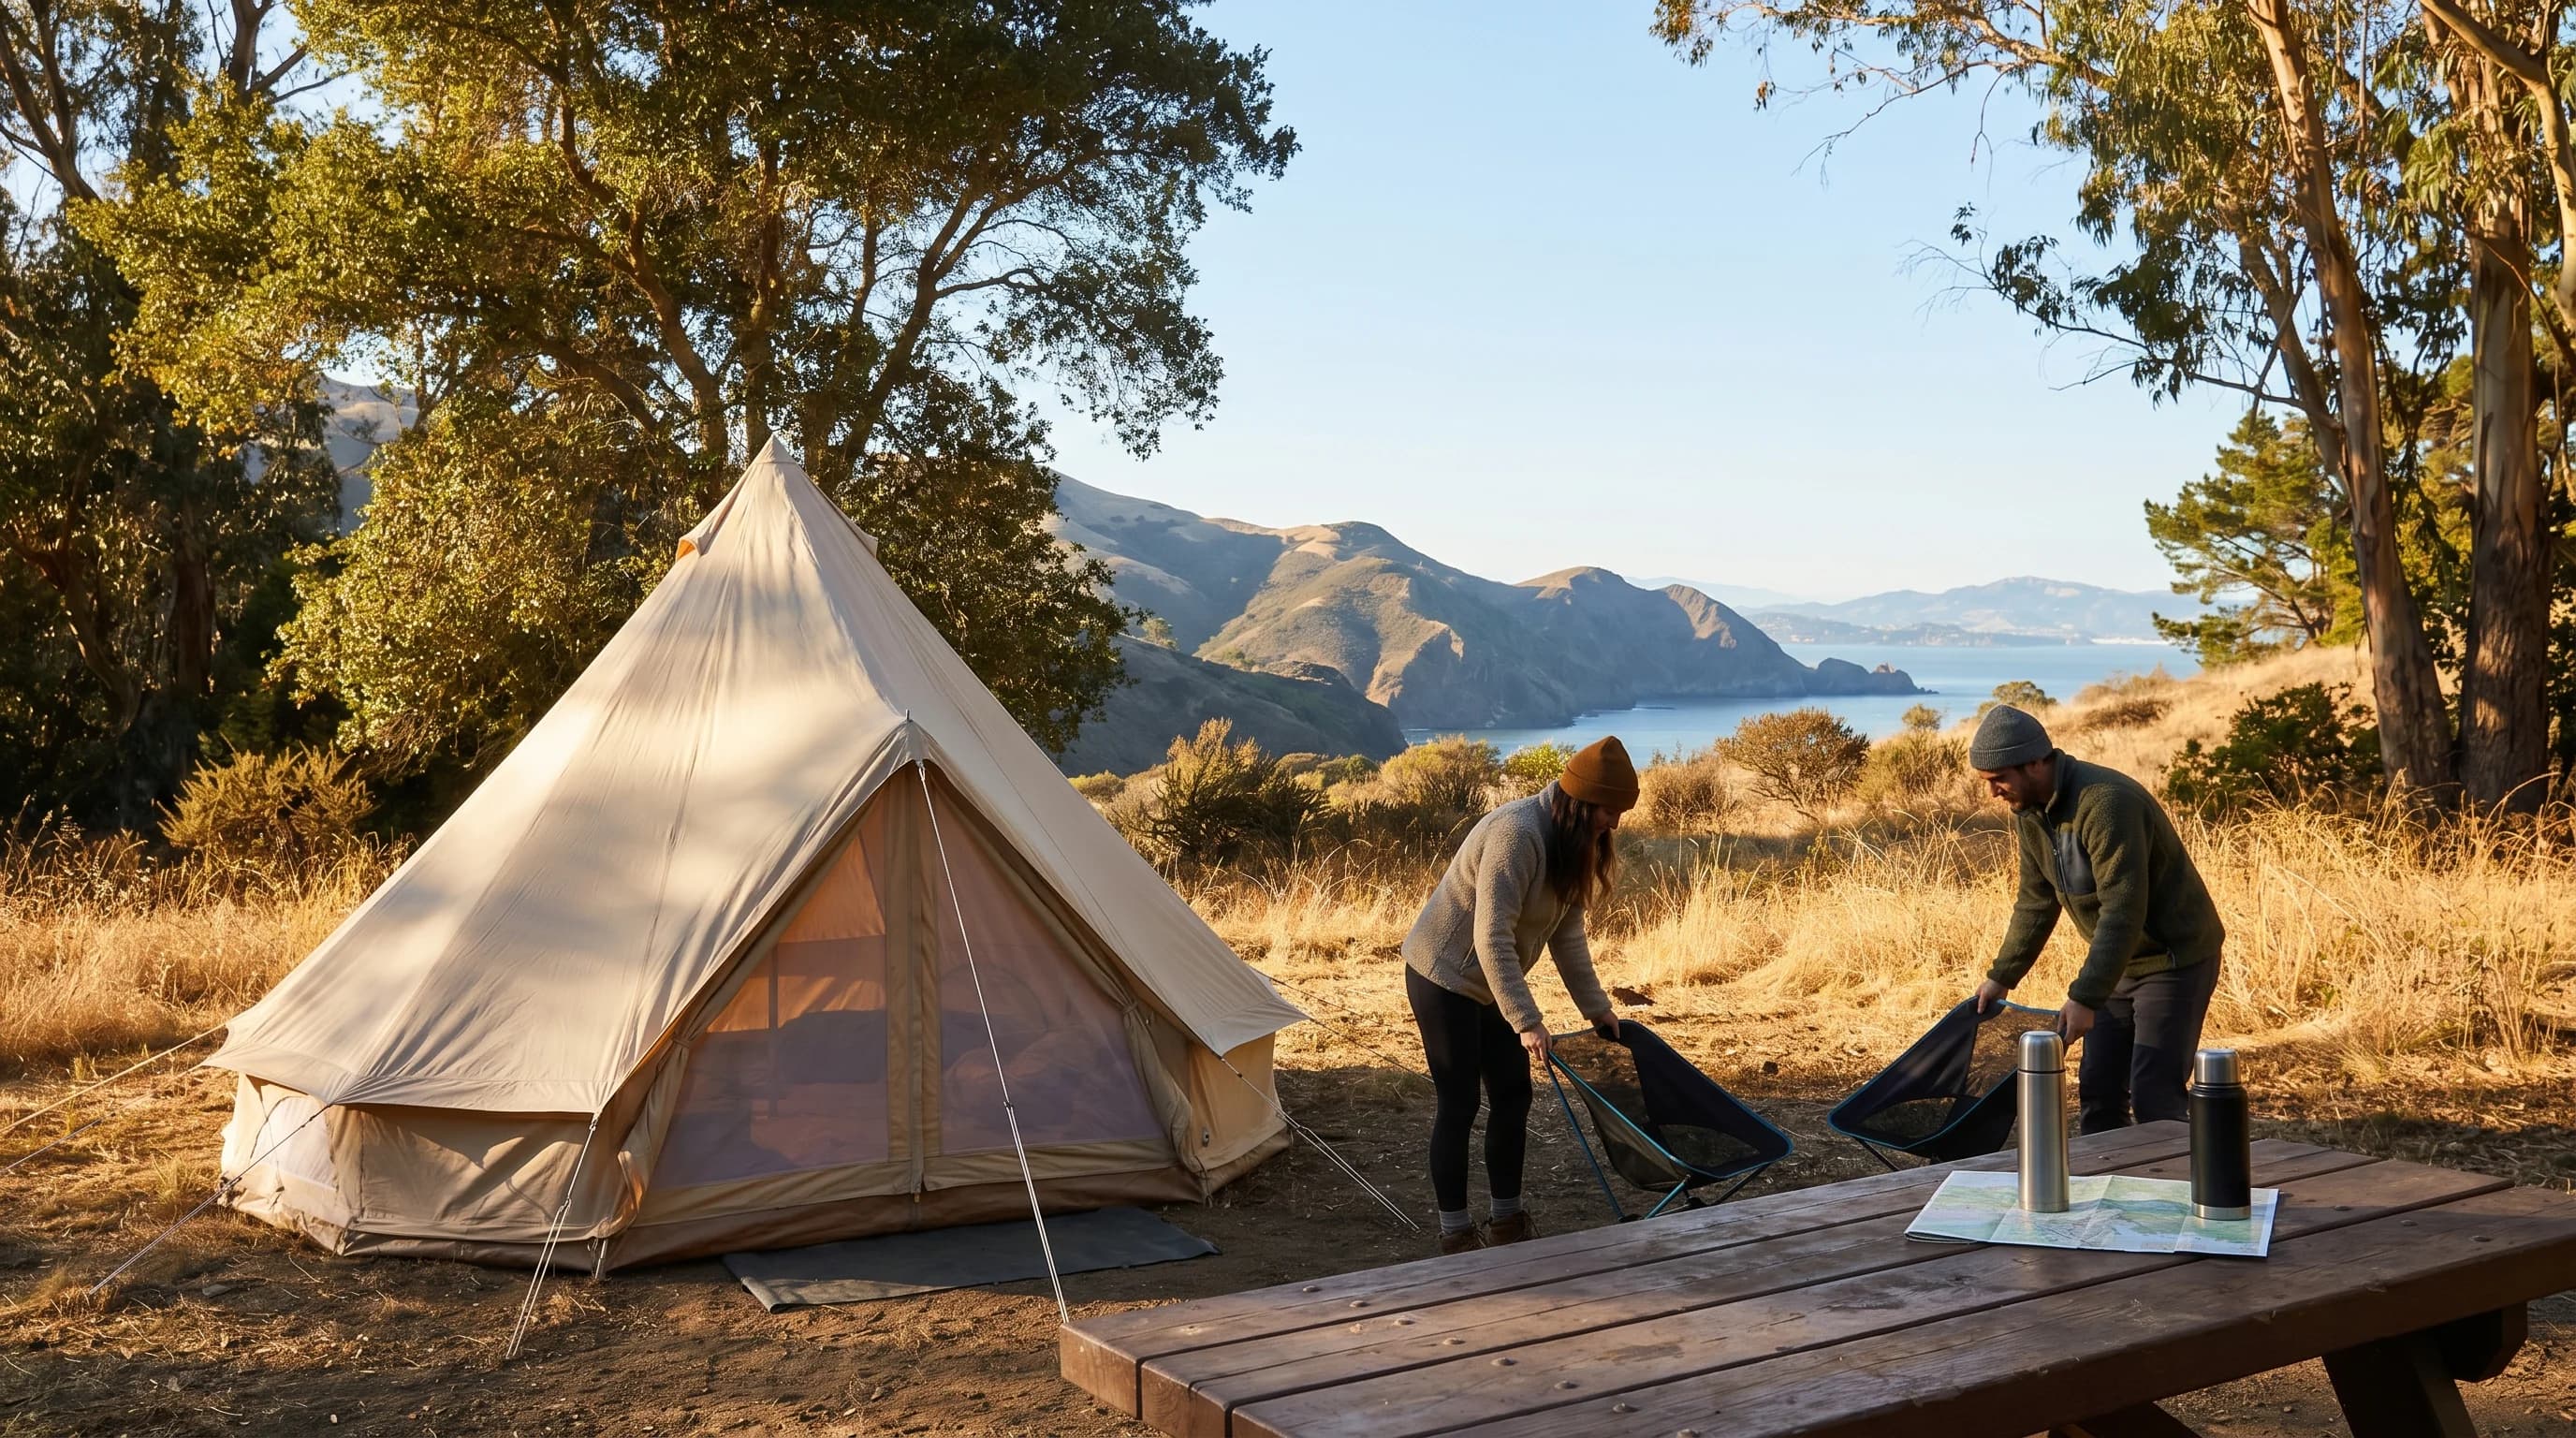
Bay Area camping weather varies dramatically by location and season. Coastal Marin camps are foggy and cool in summer but spectacular in fall. Mount Diablo and inland parks are too hot in summer. Spring and fall are the right seasons. Universal rule: bring a sleeping bag rated to 35°F year-round.
6min read →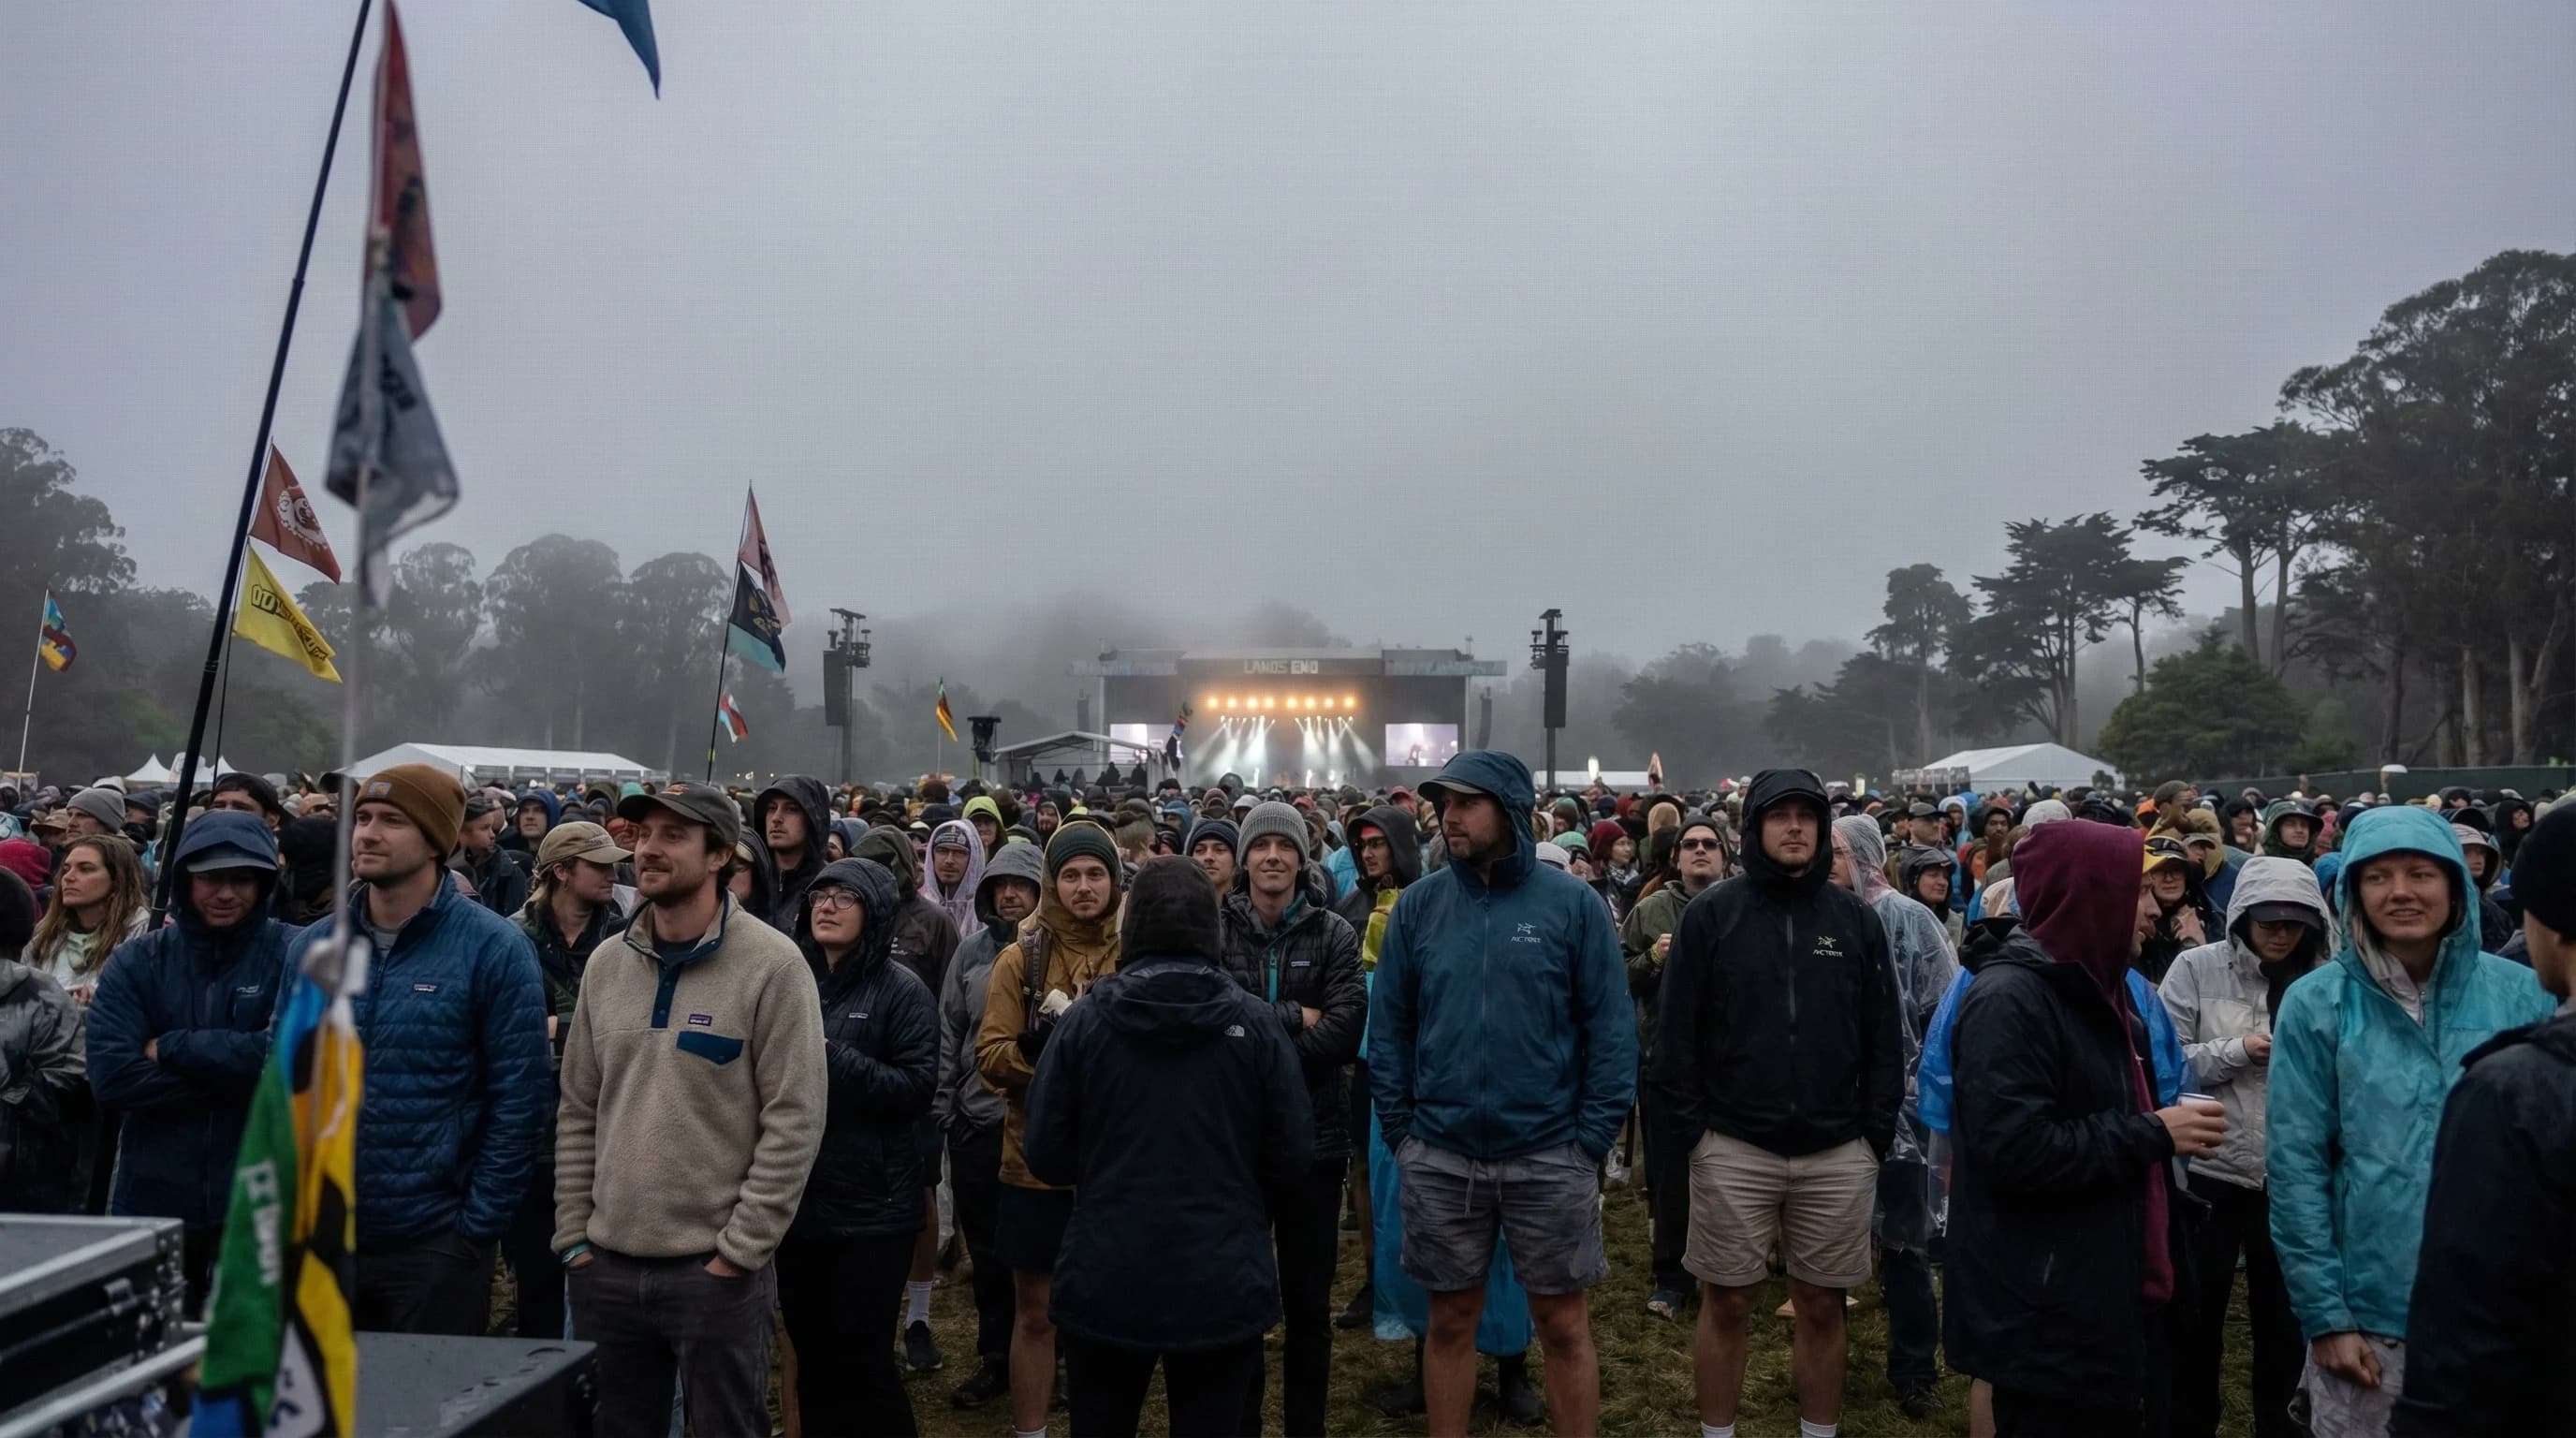
Outside Lands takes place in Golden Gate Park in early August, peak San Francisco fog season. Temperatures are typically 55-65°F with persistent westerly wind. The "bring a jacket" advice is not a local cliché. It is the correct response to what the weather will actually be.
5min read →
Thanksgiving in San Francisco is mild by national standards, mid-50s to low 60s°F, never freezing. About one in three Thanksgiving weekends sees rain as the wet season begins. Clear years produce beautiful low-angle November light over the bay.
5min read →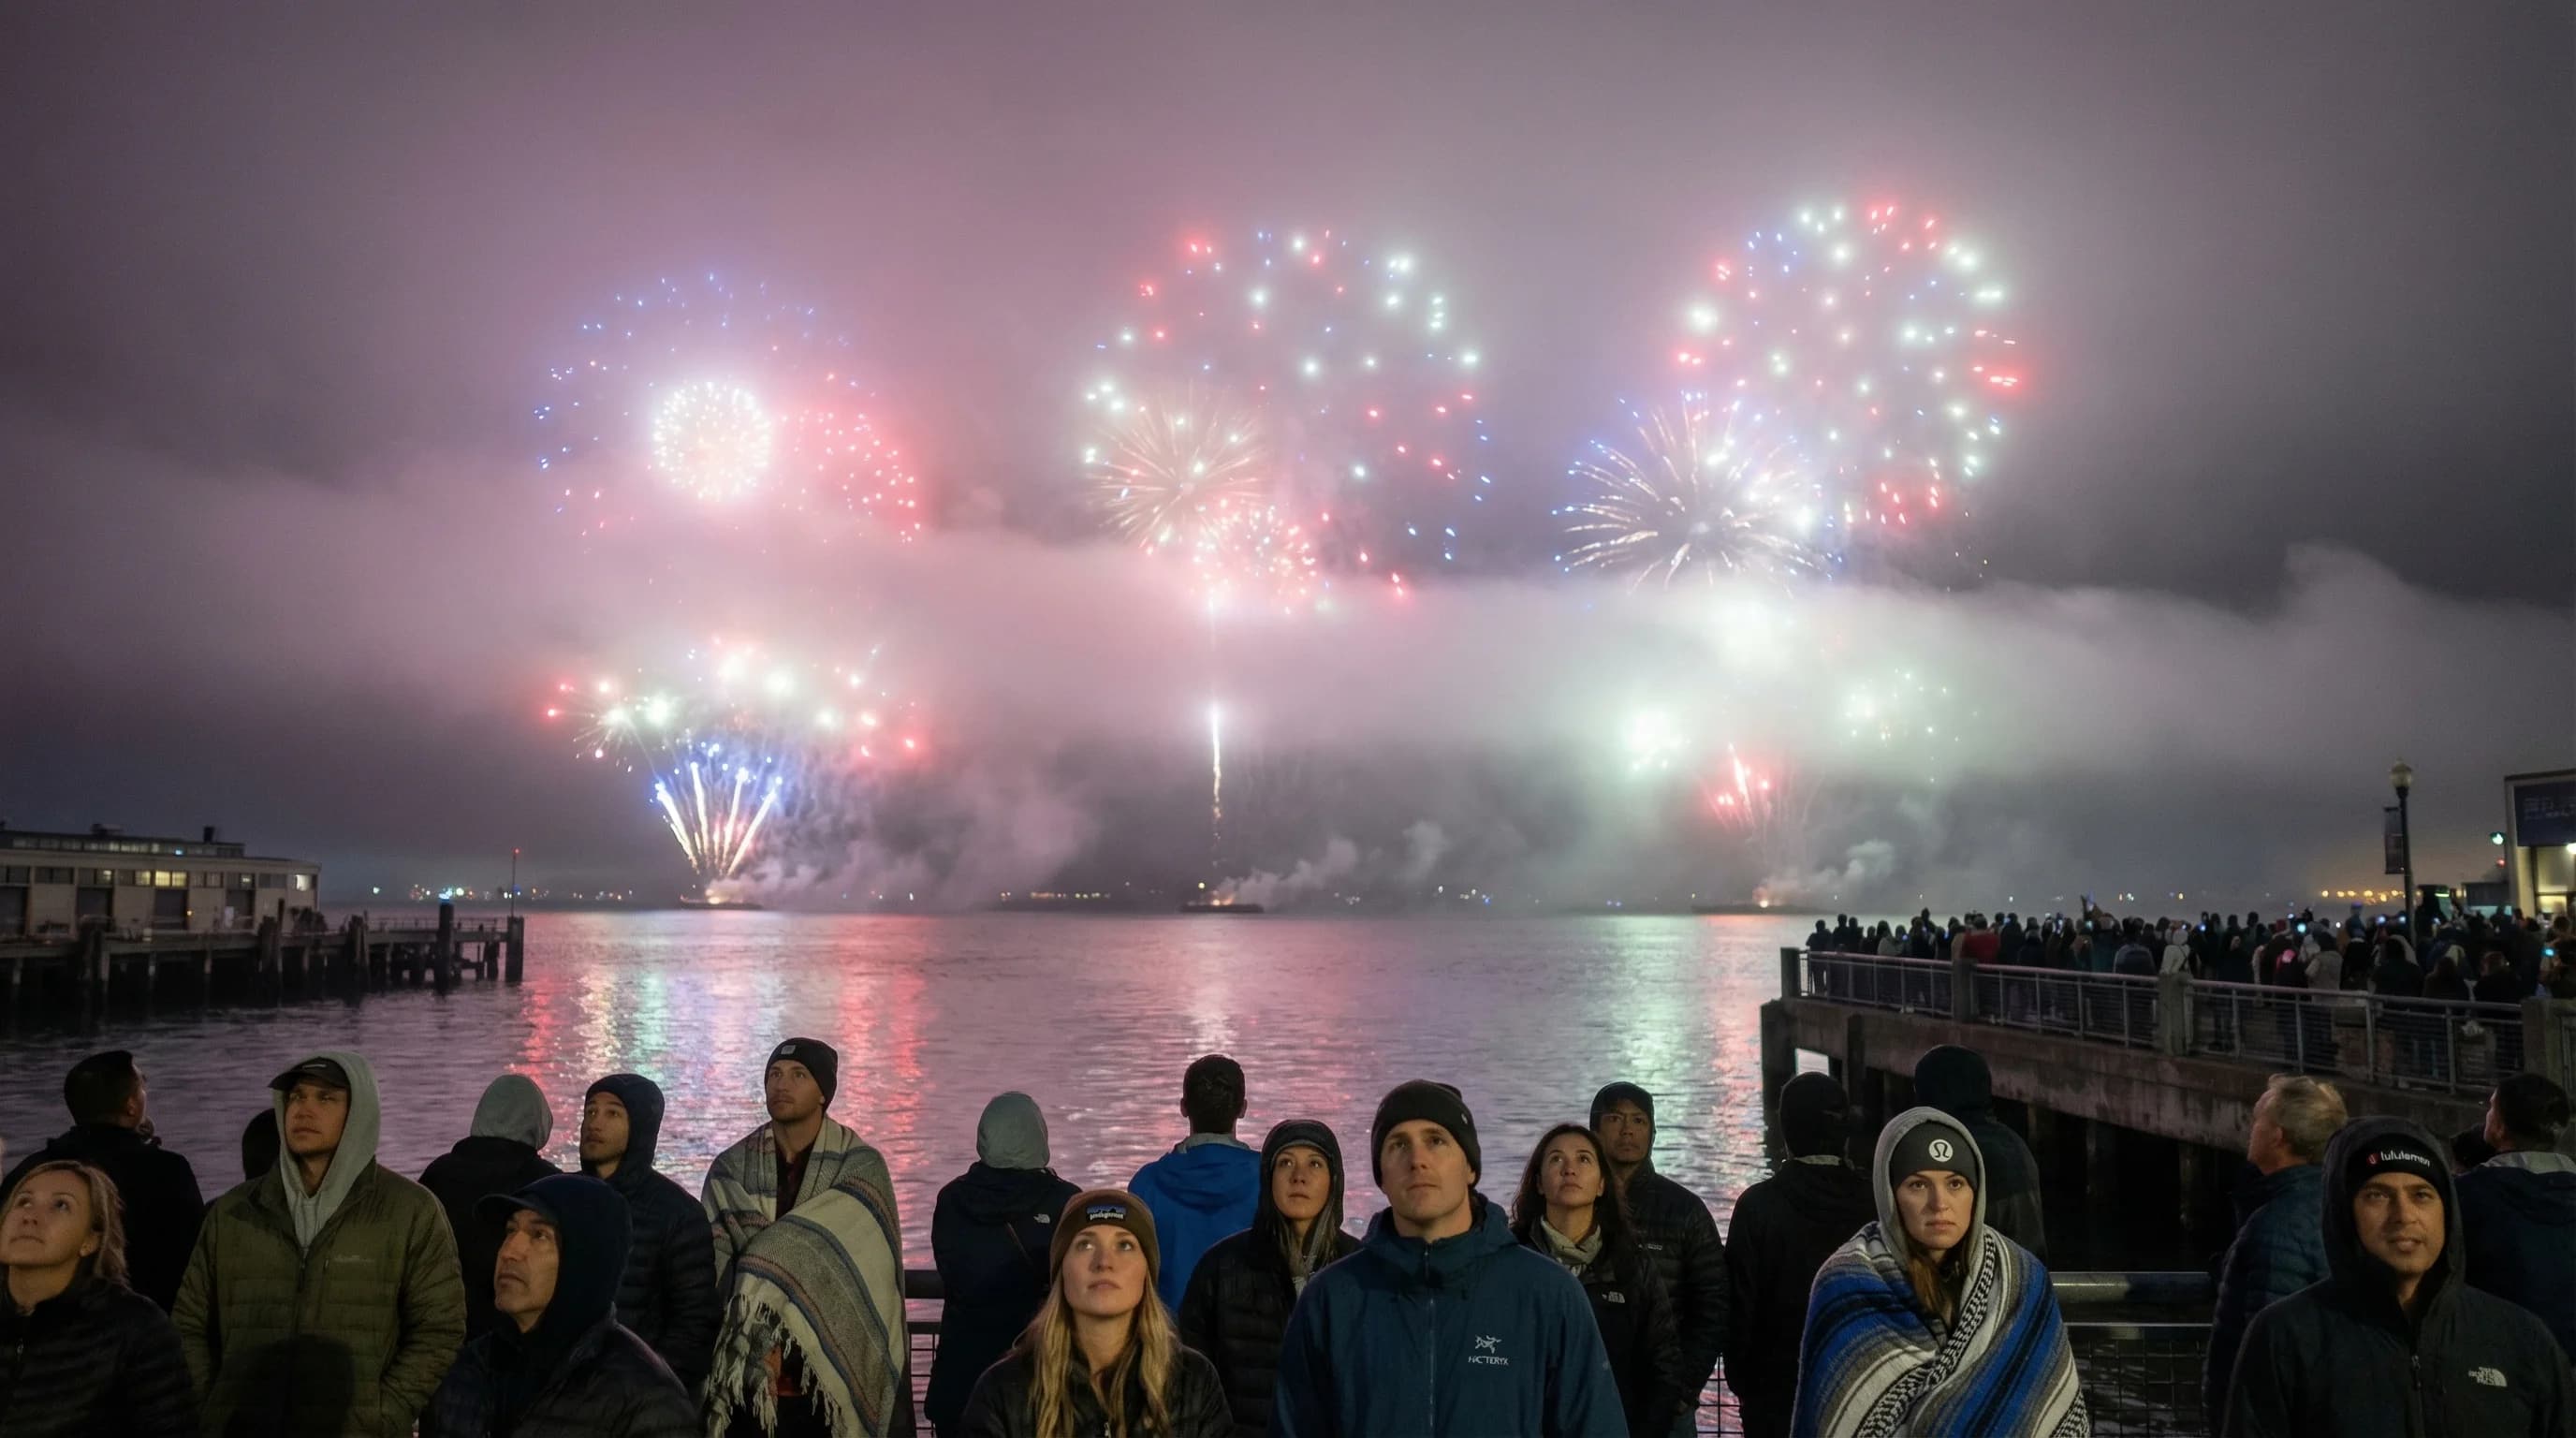
July 4 falls at the peak of San Francisco fog season. The fireworks often fire into a ceiling of marine layer fog, spectacular up close, obscured from distance. The East Bay waterfront and inland cities reliably have clearer skies. Pack a jacket either way: it will be in the 50s by 9:30 p.m.
5min read →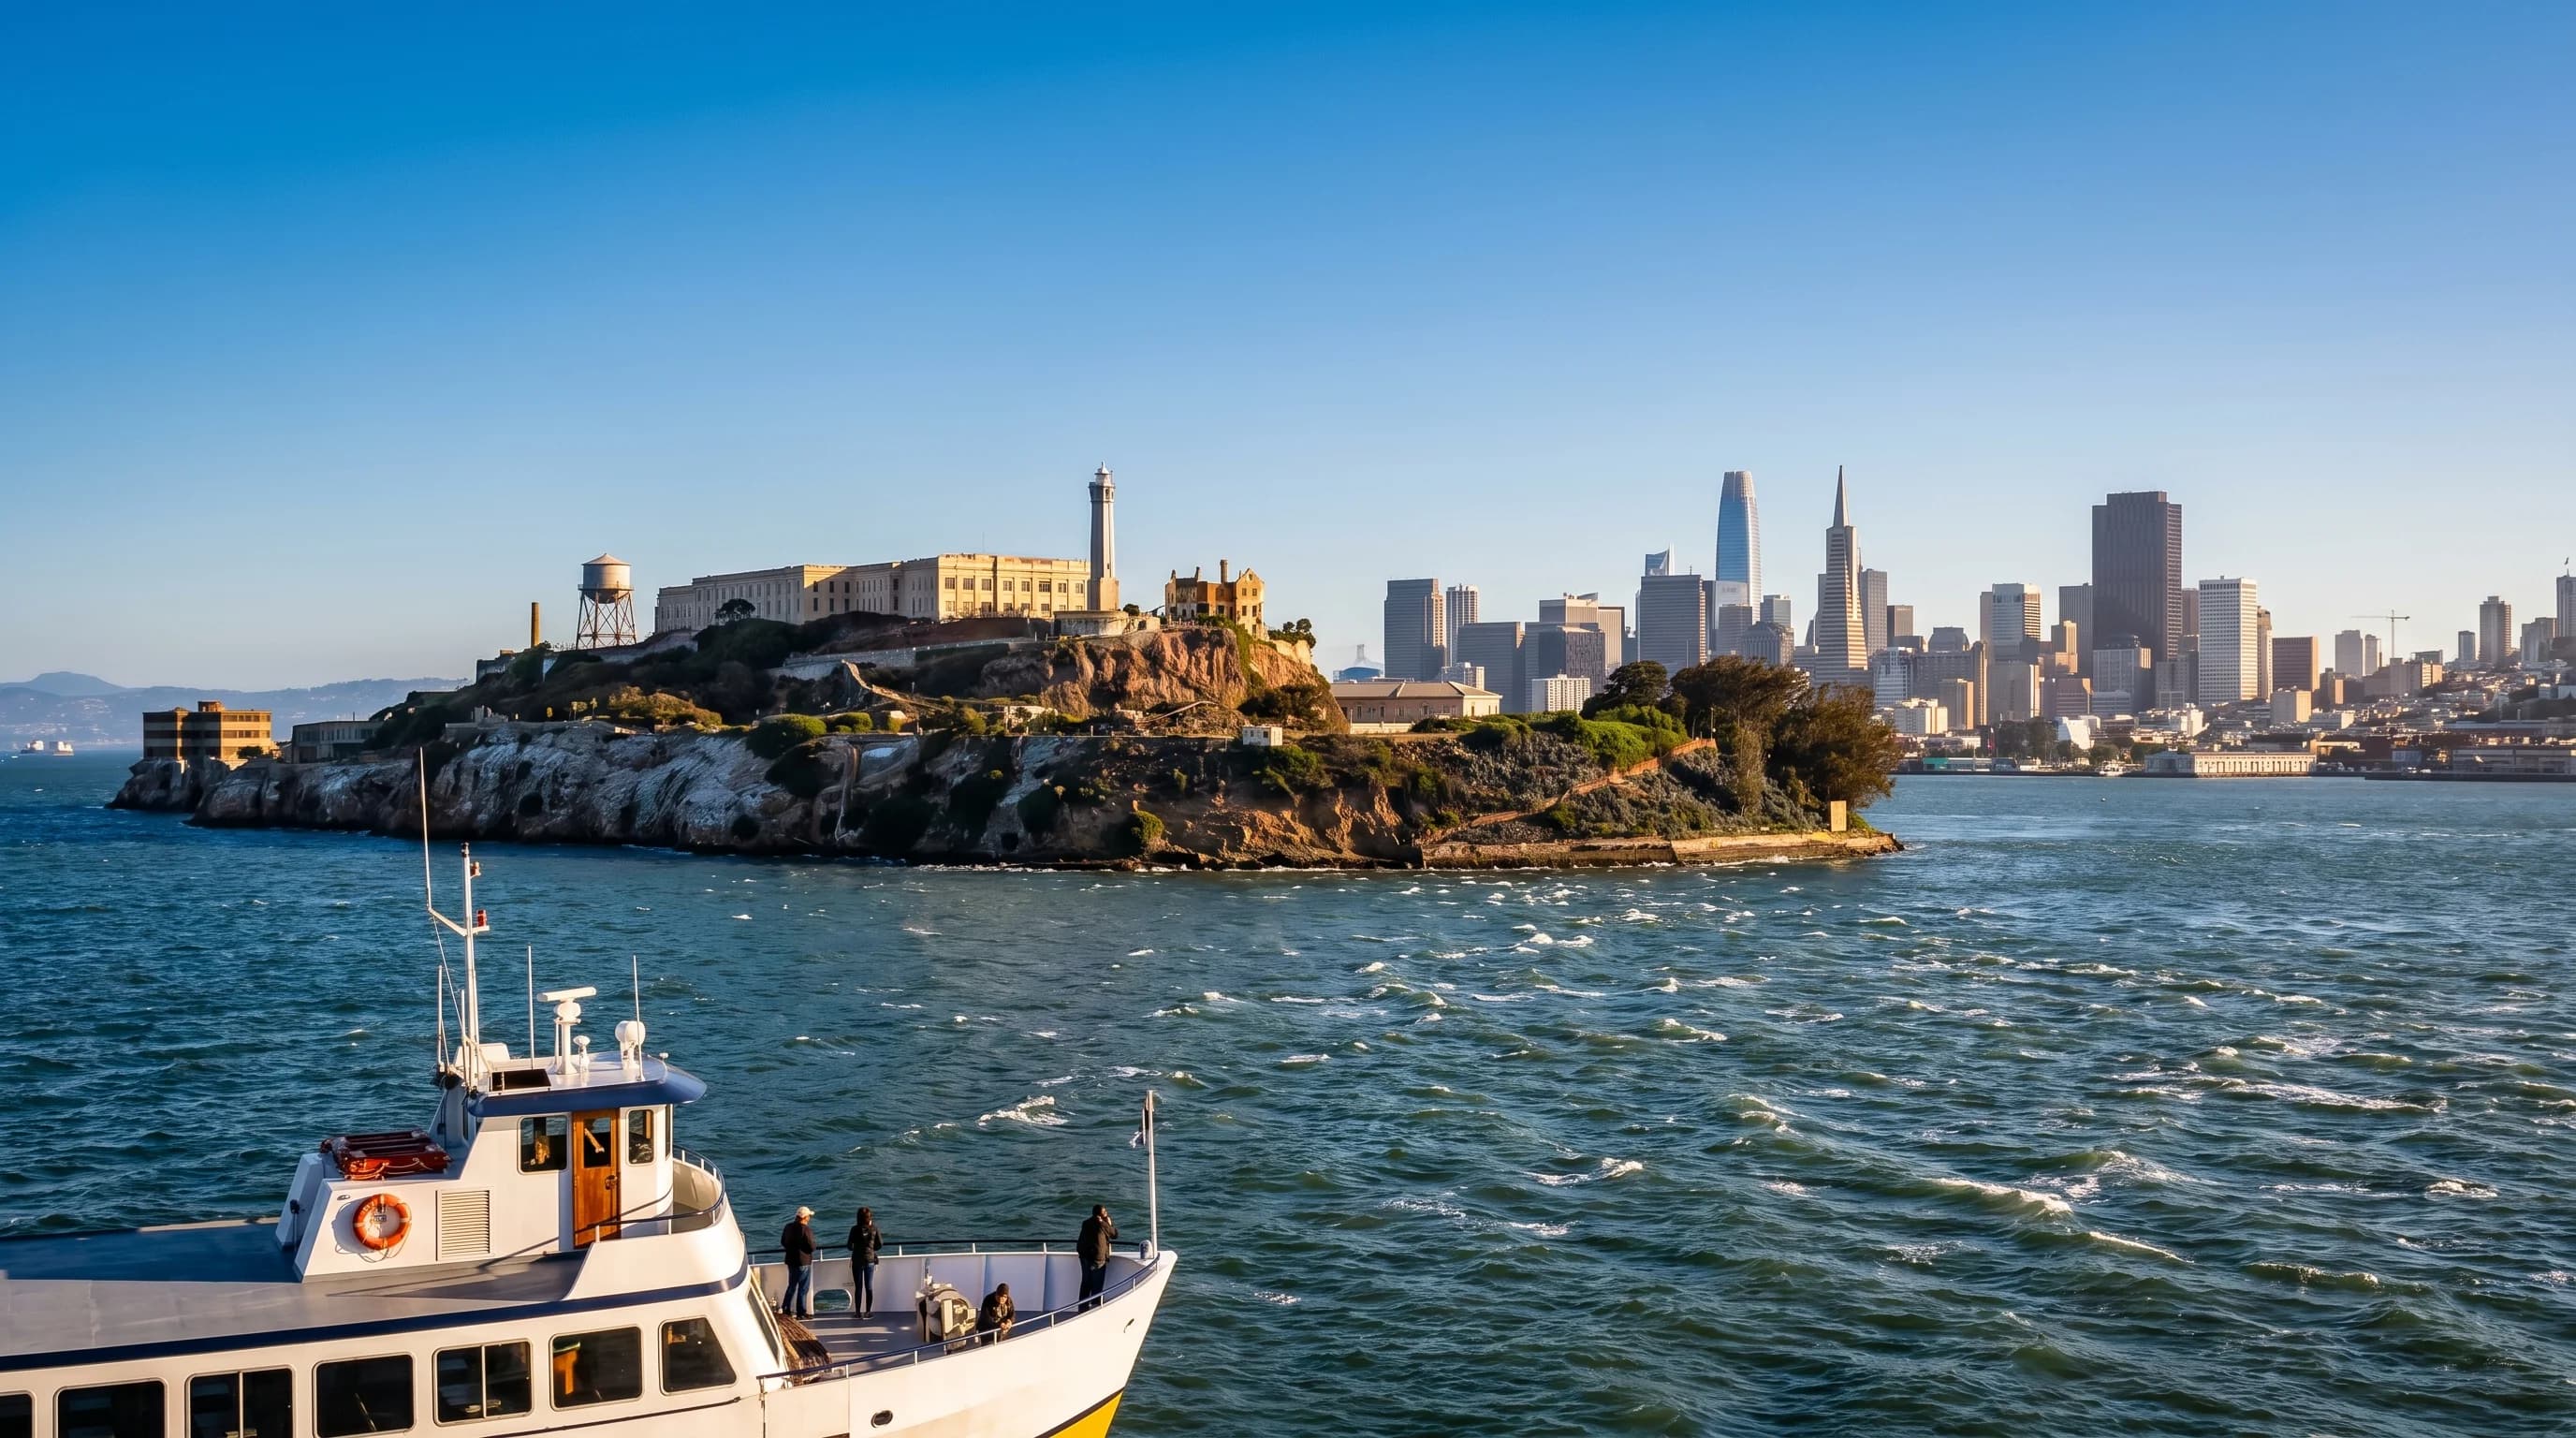
Alcatraz sits 1.25 miles offshore in the bay, fully exposed to wind and marine air. Summer visits are typically 58-65°F with 15-25 mph wind. Pack a jacket regardless of what the mainland weather looked like. May and September-October offer the most comfortable conditions.
5min read →
September and October are the gold standard for outdoor Bay Area weddings, Indian summer, warm afternoons, golden light, essentially zero rain. May is a strong alternative. Summer at a coastal SF venue carries a real fog-and-cold risk that inland wine country venues avoid entirely.
6min read →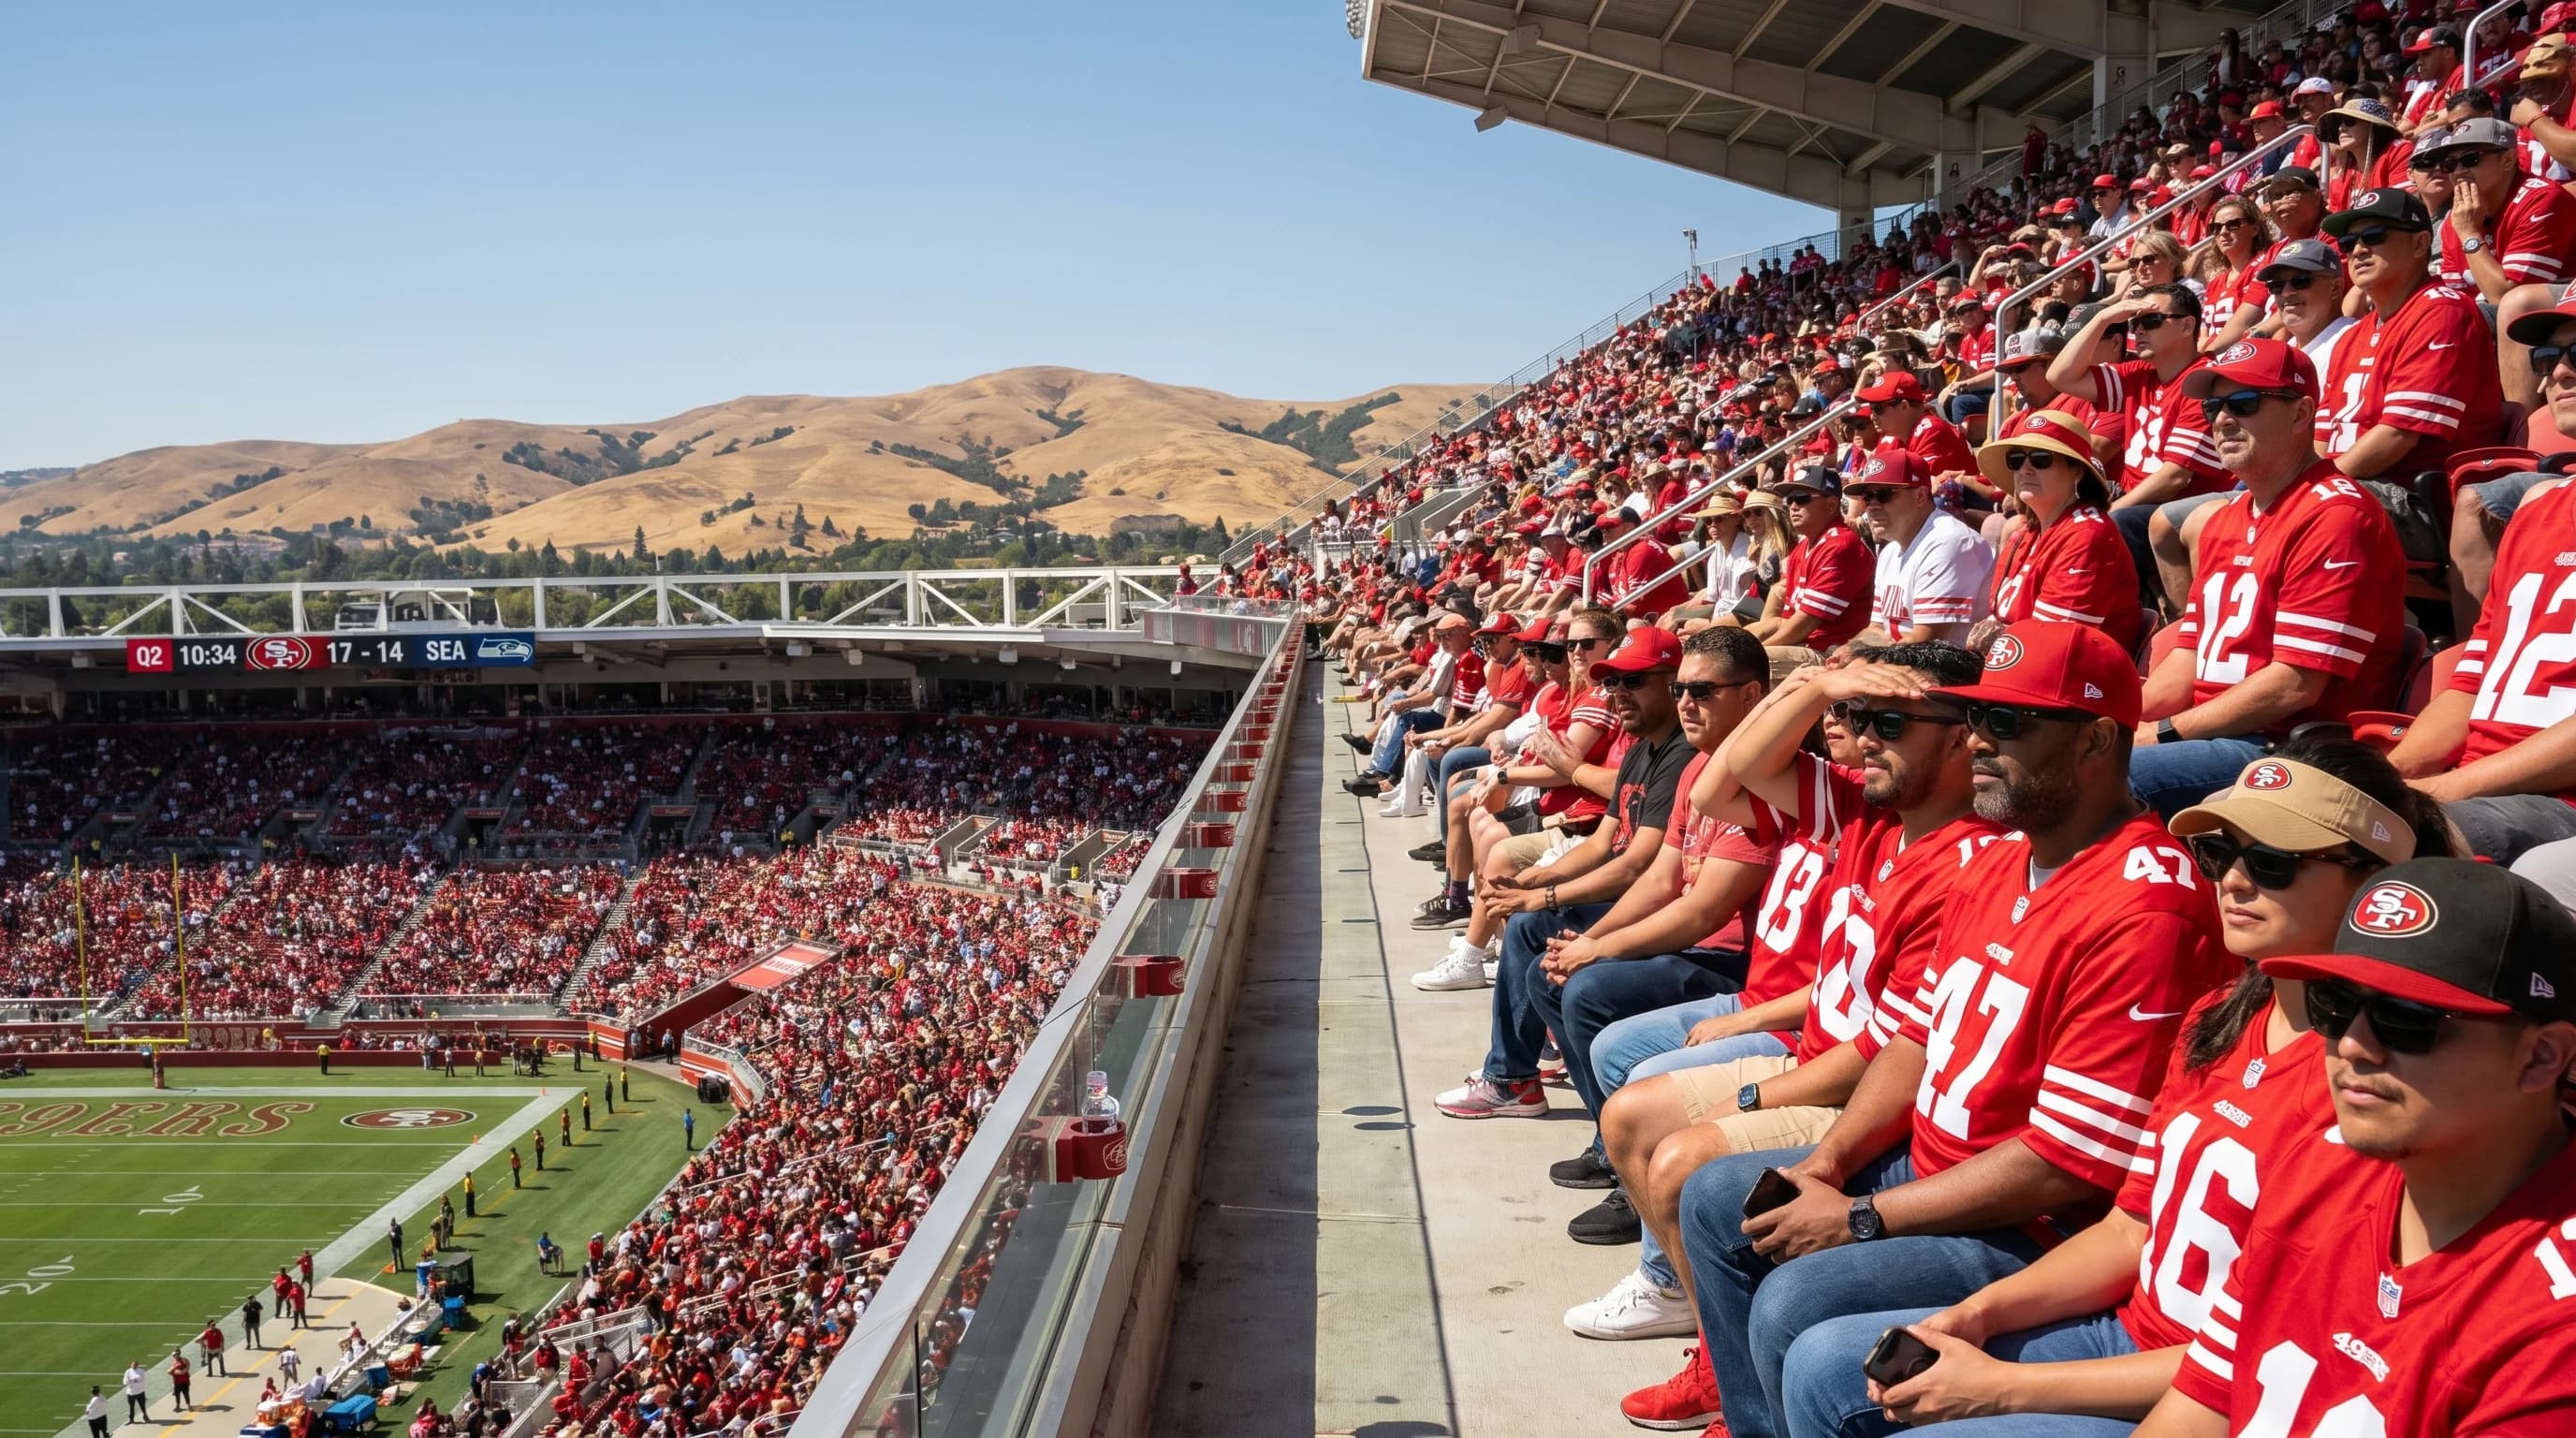
San Francisco Bay Area Stadium, the FIFA name for Levi's Stadium, sits in the warmest part of the Bay Area. September games hit 90°F+, while winter nights drop into the 40s.
5min read →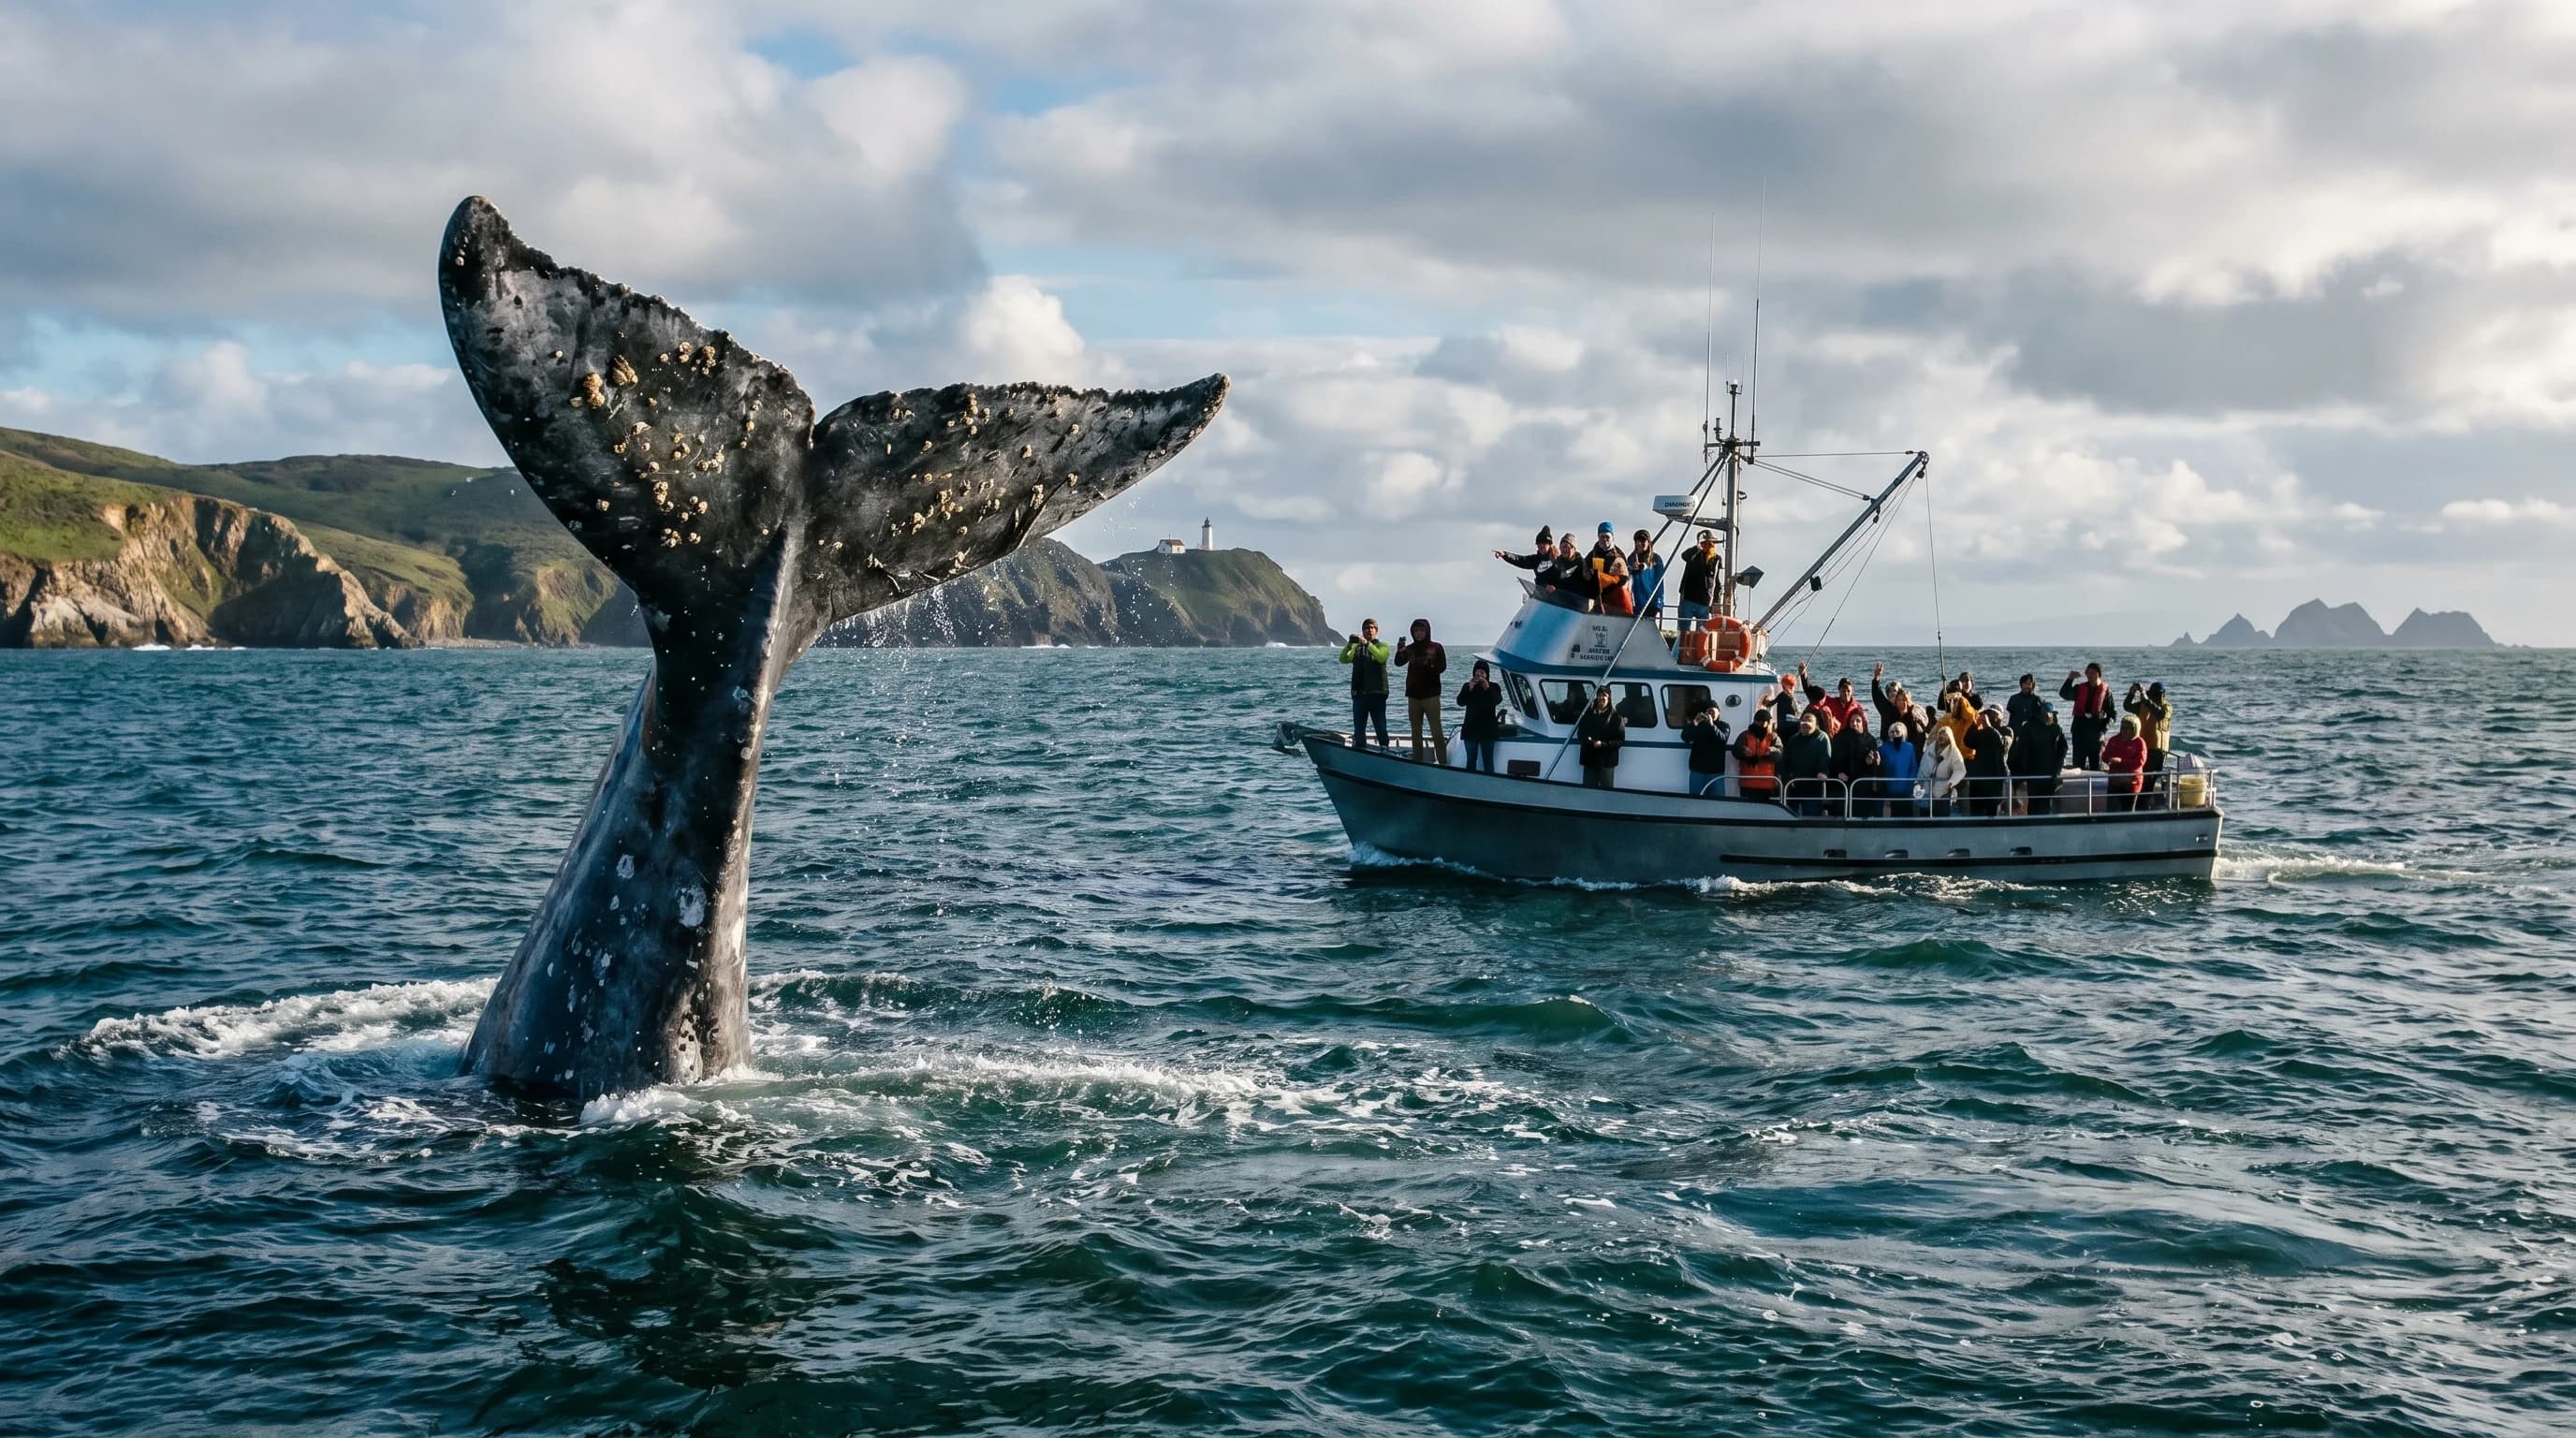
The Bay Area has two whale watching seasons: gray whales (December-May) and humpbacks (June-November). September and October combine peak activity with the best weather.
5min read →