climate scienceseasonaldestinations

Hottest Temperature Ever Recorded in the Bay Area

By SFBayWeather||Updated |5 min read
Hottest Temperature Ever Recorded in the Bay Area

Key Takeaways

  • San Francisco's all-time high is 107°F, set September 9, 2022, breaking the previous record of 106°F set in 2017, which had broken a record from 1961.
  • Inland East Bay cities have recorded temperatures above 115°F during major heat dome events, comparable to the hottest days in California's Central Valley.
  • The coastal-to-inland temperature gradient on Bay Area record heat days can exceed 50°F, Half Moon Bay at 62°F the same day Concord is at 116°F.
  • San Francisco's upper temperature extreme is unstable: the record has been broken twice in 5 years, driven by a warming baseline that pushes each heat event higher.
  • Bay Area heat records are produced by heat domes that suppress the marine layer, combined with Diablo offshore winds that replace cool Pacific air with hot interior air.

The Bay Area's hottest temperature records exist in two separate categories: the coastal cities that the marine layer normally protects, and the inland valleys where summer heat is the baseline. In both categories, the records have been broken in recent years, which tells a meaningful story about the region's changing climate. San Francisco's all-time record has been broken twice since 1961, with the most recent record, 107 degrees Fahrenheit, set in September 2022. In the inland East Bay, temperatures above 115 degrees have been recorded during major heat dome events. Those records are more than weather trivia: they are a preview of what the region will experience with increasing frequency.

San Francisco: Hottest Temperature on Record

San Francisco's official all-time high temperature is 107 degrees Fahrenheit, recorded on September 9, 2022, at the National Weather Service's official measuring station. This broke the previous record of 106 degrees Fahrenheit set on September 1, 2017, which had itself broken a long-standing record of 101 degrees set on June 14, 1961. The pattern reveals something important: San Francisco's upper temperature extreme is not stable. The record has been broken twice in five years, during separate events with separate meteorological drivers.

Both the 2017 and 2022 events were heat dome episodes in which the North Pacific High amplified and extended a ridge of high pressure inland, suppressing the marine layer and allowing Diablo offshore winds to replace the normal cool westerly flow. Without the sea breeze and marine layer, San Francisco is a city on a peninsula with full southern and western sun exposure. In this configuration, it heats rapidly, and without the overnight marine recovery that normally resets temperatures, it begins each subsequent day at a higher baseline.

Bay Area temperature extremes map showing coastal versus inland all-time highs, with San Francisco 107°F and inland East Bay cities above 115°F marked
Bay Area temperature records reveal a clear coastal-to-inland gradient. San Francisco's 107°F record (2022) reflects a rare marine layer failure. Inland East Bay cities regularly reach 110-115°F+ during heat domes, operating in a fundamentally different climate regime.

Inland Bay Area: The Real Heat Frontier

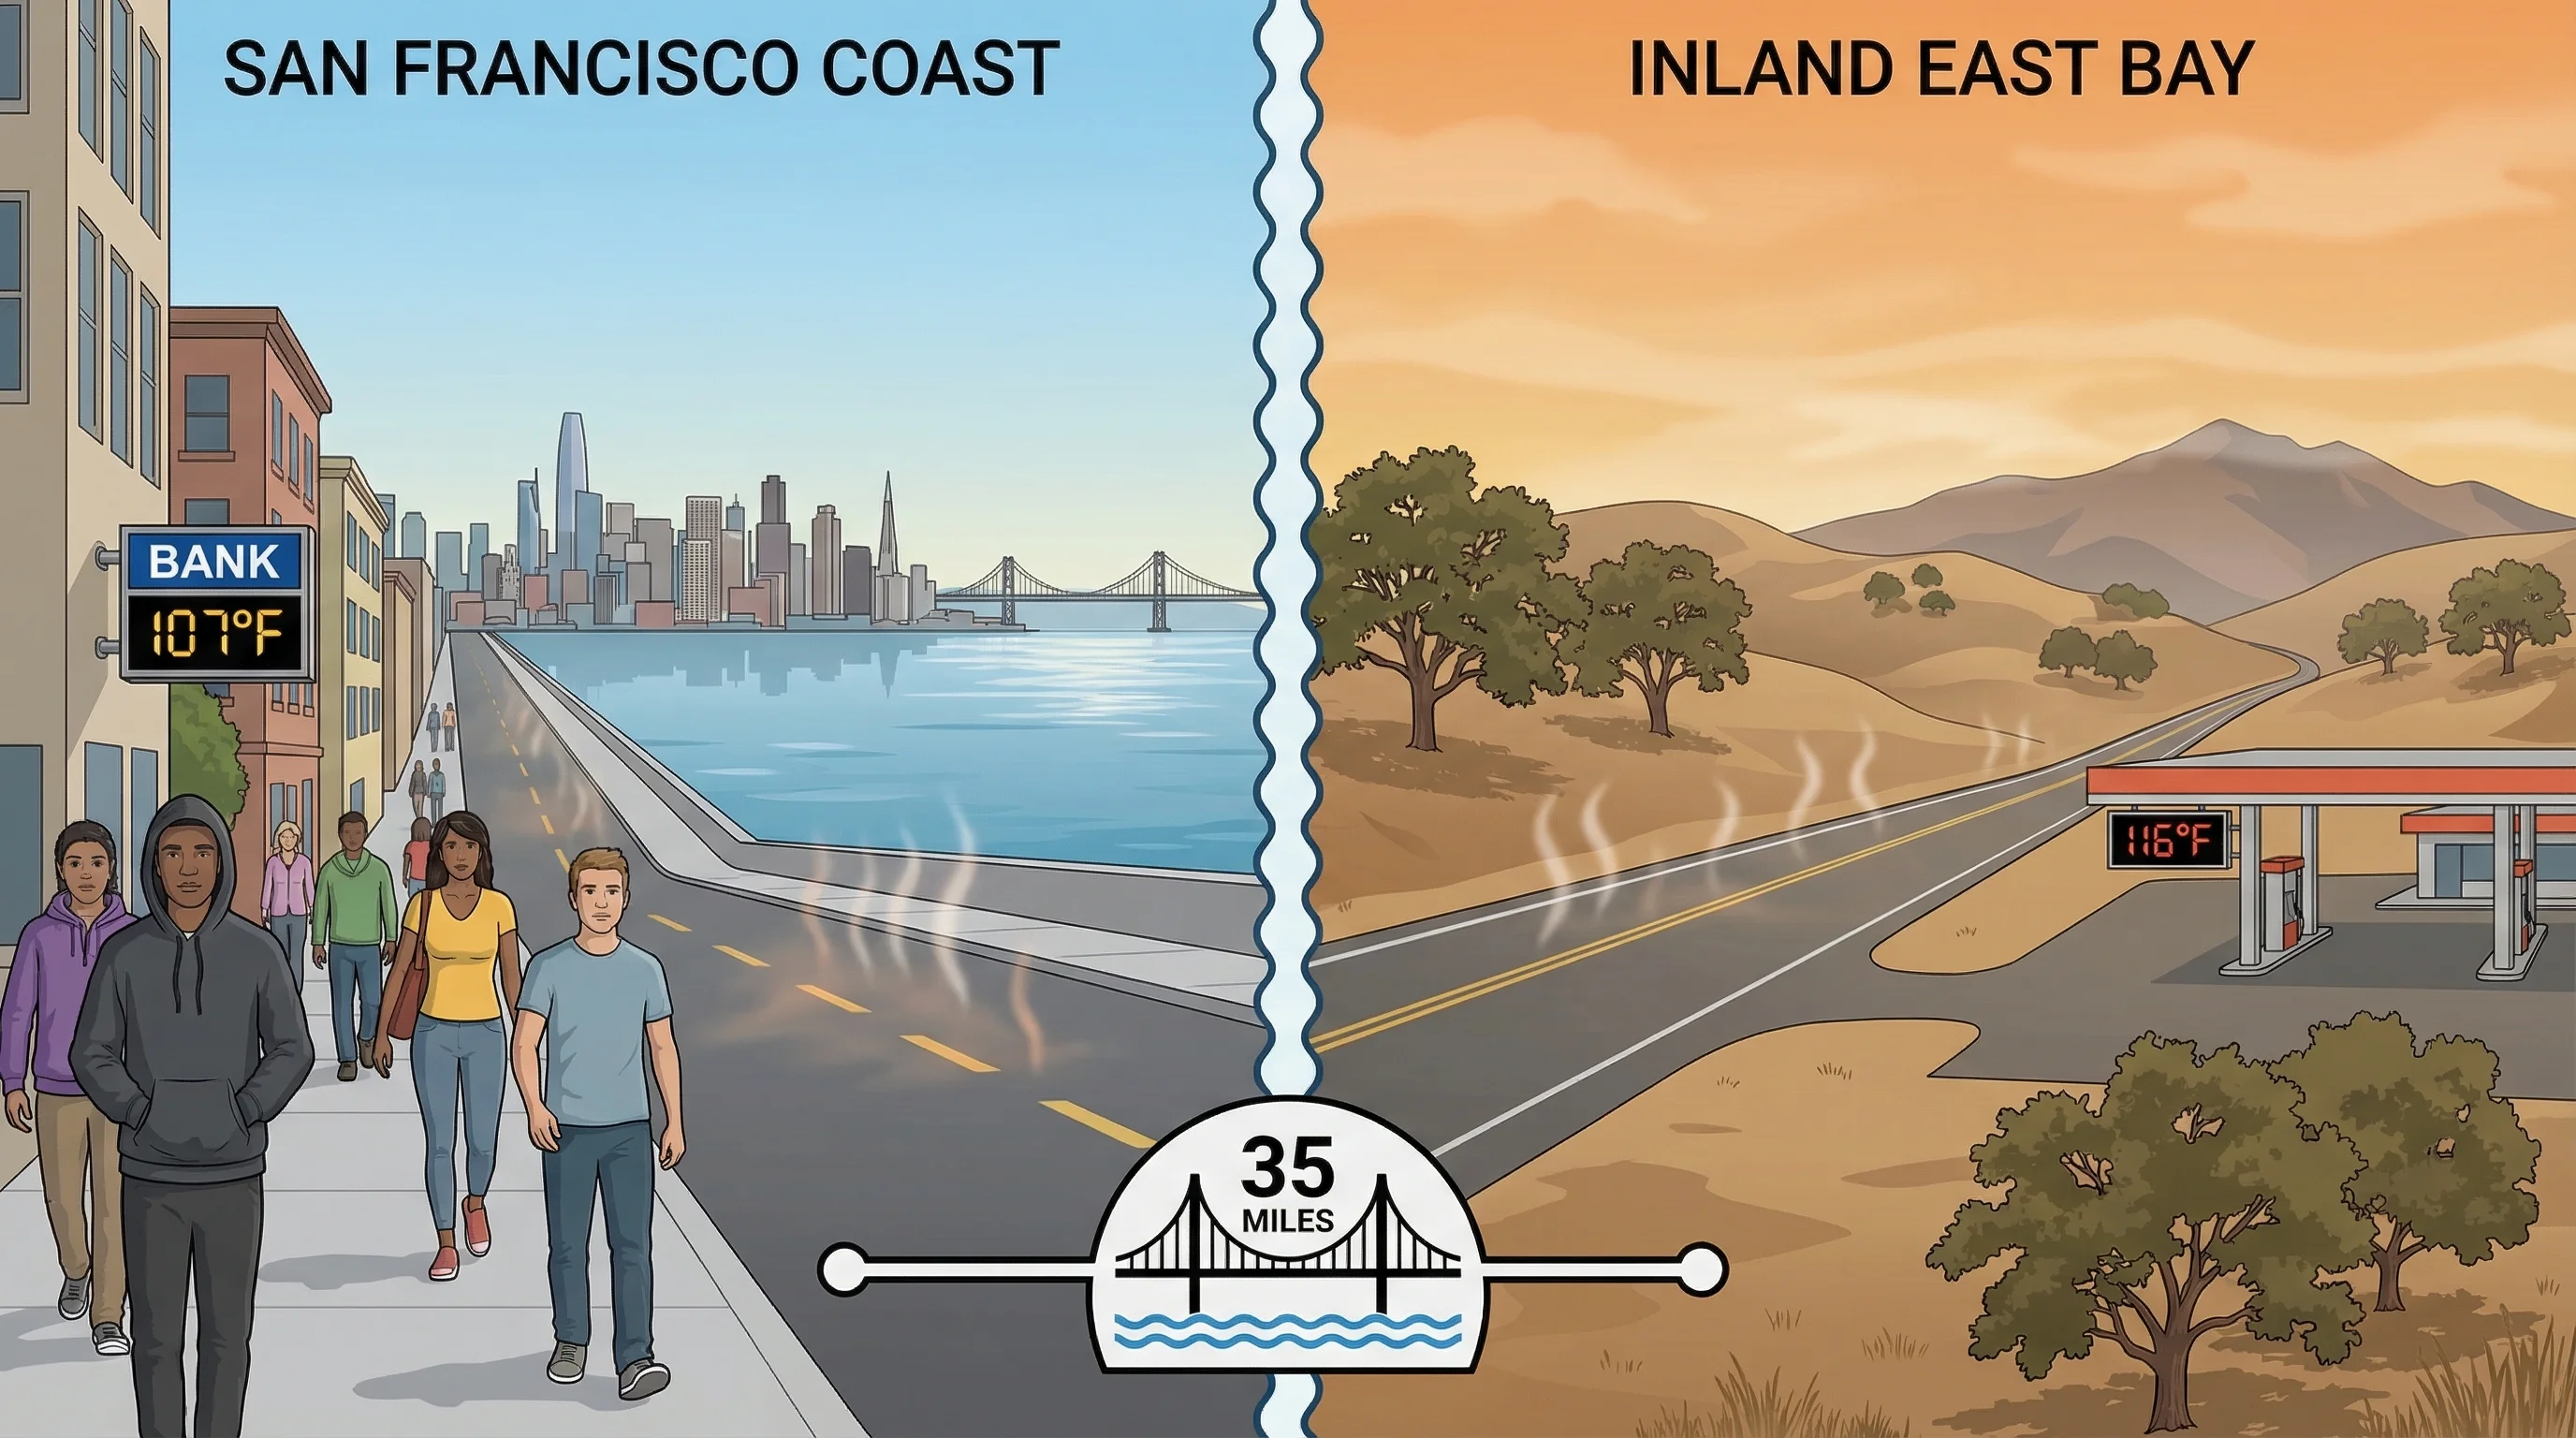
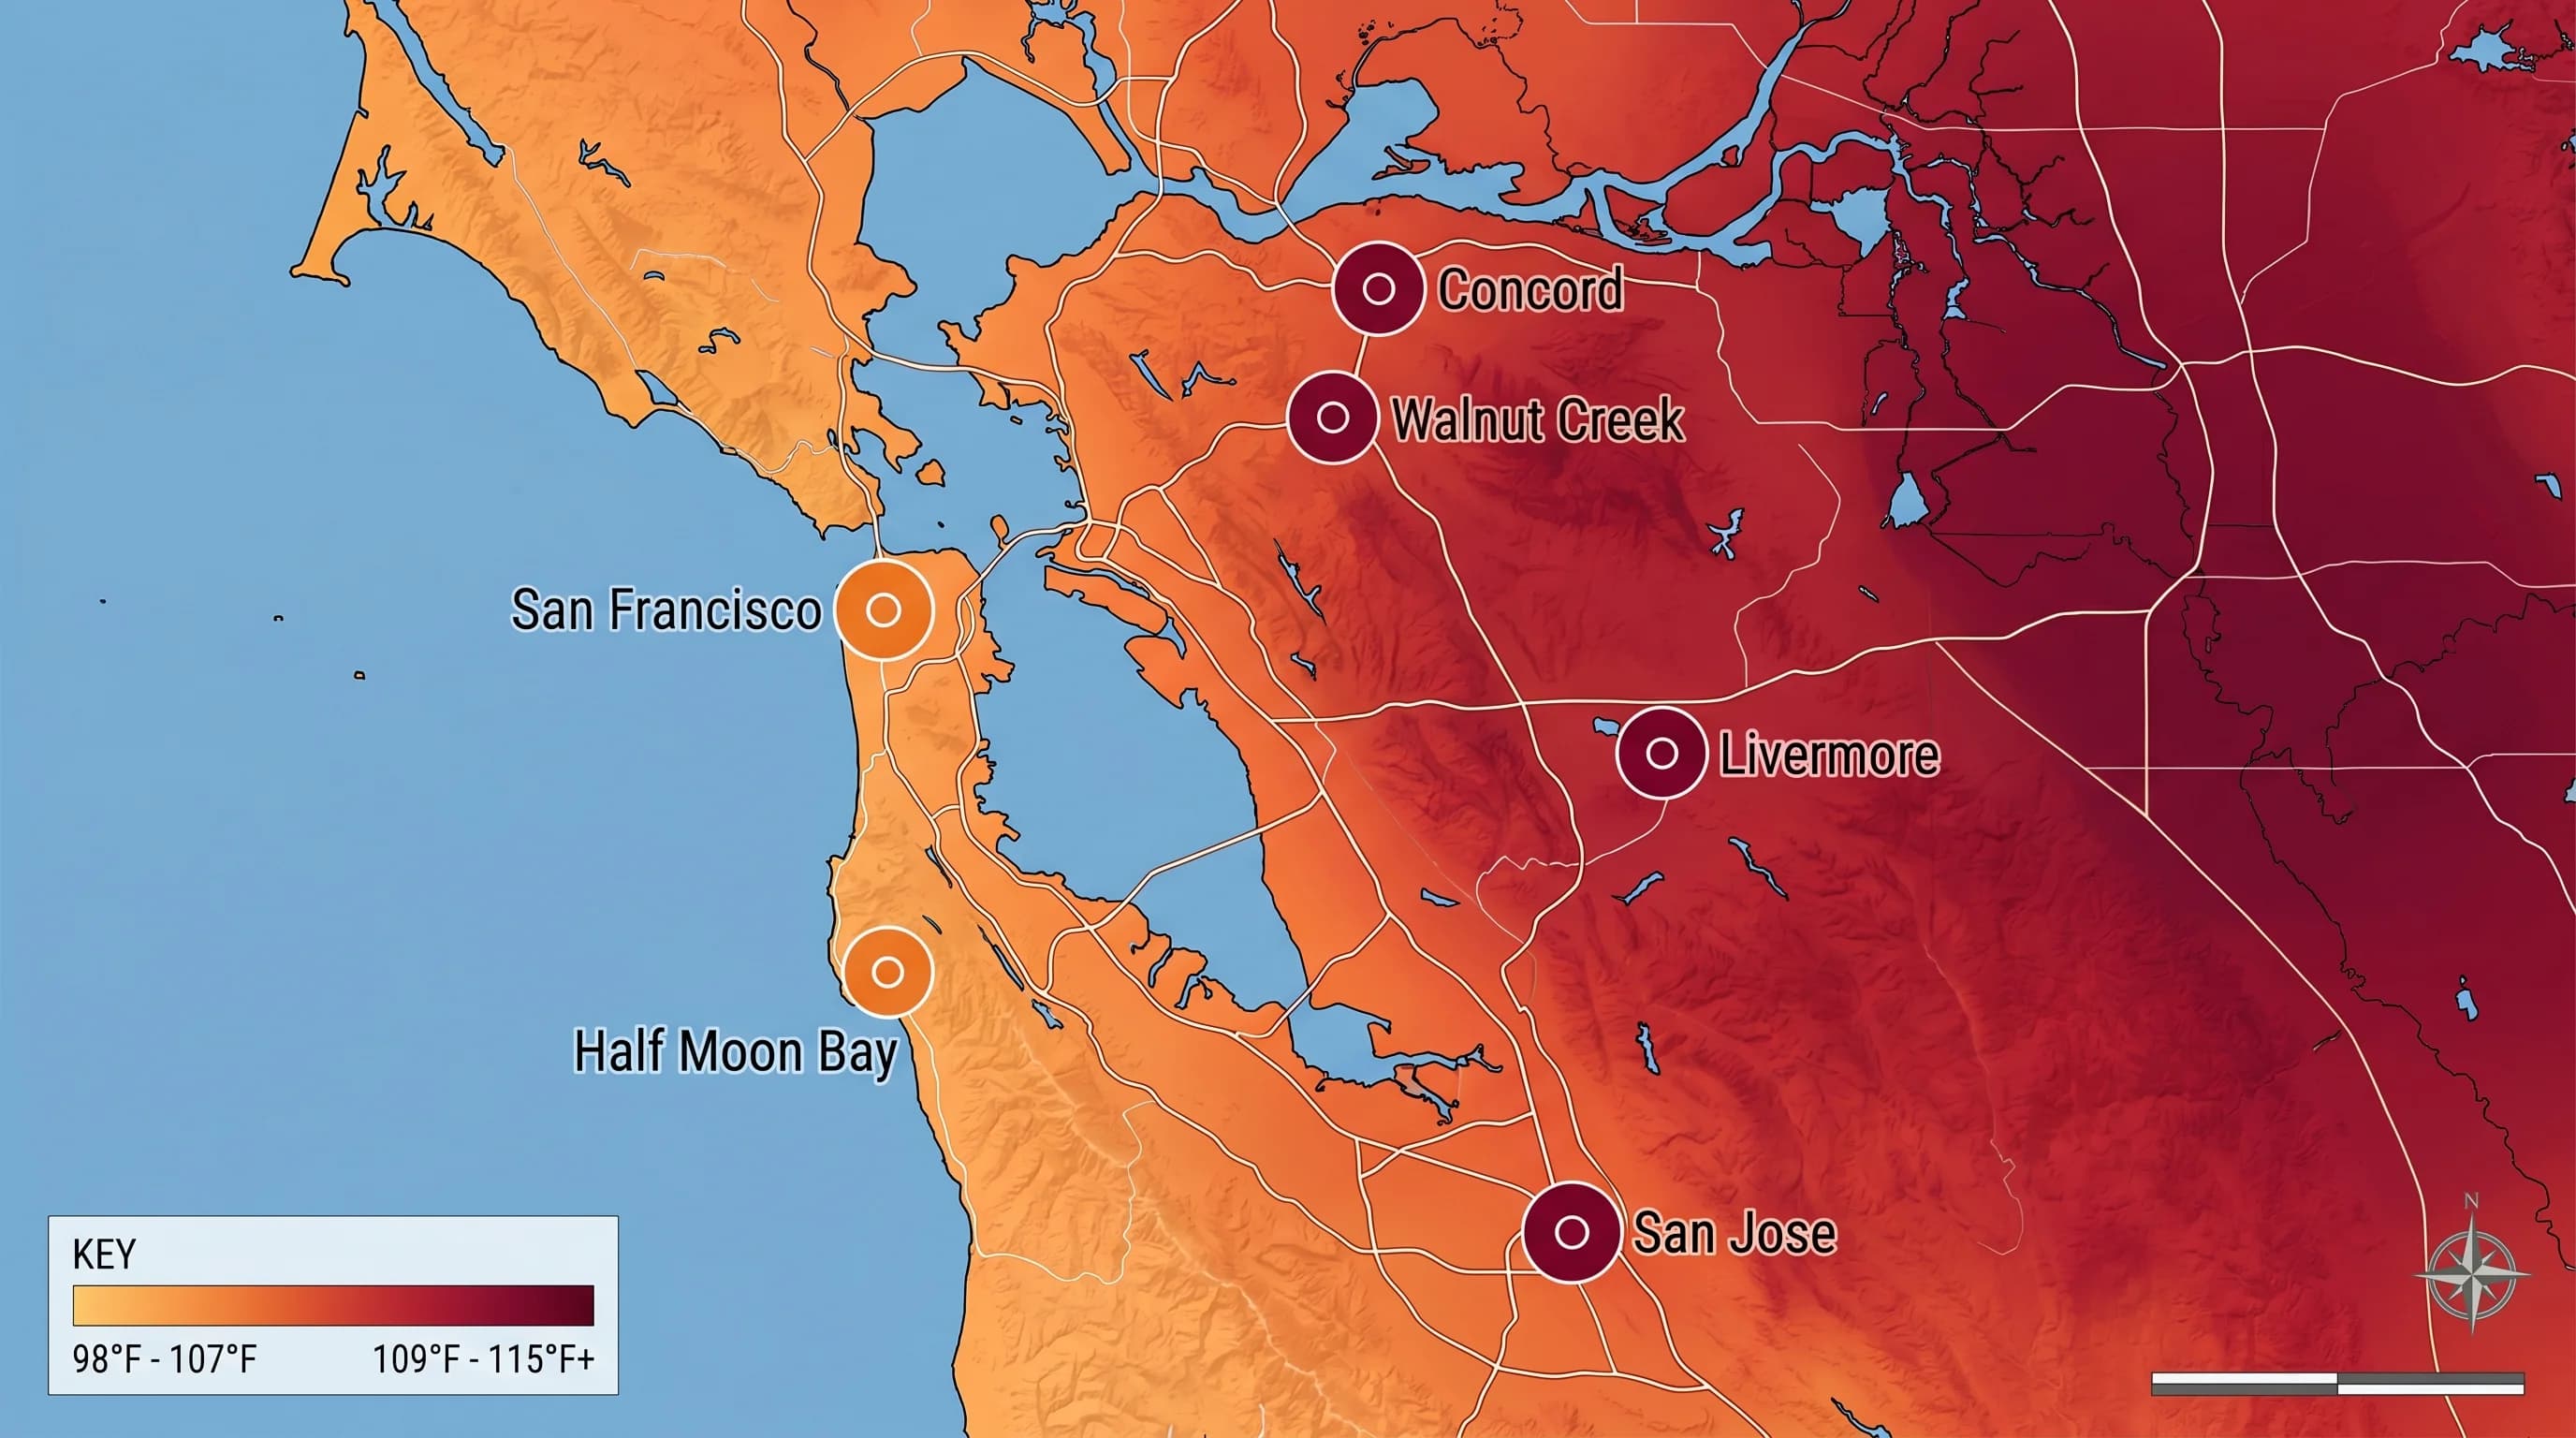
The inland East Bay and South Bay valleys record temperatures that dwarf the coastal records. Livermore and Concord have both recorded temperatures above 115 degrees Fahrenheit during major heat dome events. The 2020 heat dome pushed Concord to 116 degrees. The 2022 event pushed Livermore to 116 degrees as well. These temperatures are not anomalous for inland California; they are comparable to what Sacramento, Fresno, and Bakersfield experience in severe heat waves. The difference is that the Bay Area's inland communities are a short drive from the ocean, which creates a surreal contrast: the same day that Concord is at 116 degrees, Half Moon Bay 30 miles west is at 62 degrees.

The geographic pattern of Bay Area heat records makes meteorological sense. The marine layer's cooling effect diminishes with distance from the coast and with elevation barriers between a given location and the ocean. Locations that are topographically shielded from the sea breeze, deep in valleys, behind hills, far from any direct oceanic exposure, record the highest temperatures because they receive none of the marine protection on the worst days. The 50-plus degree difference between coastal and inland temperatures during a major heat event is one of the largest temperature gradients over short distances of any metropolitan area in the world.

Heat Records and Climate Trajectory

The frequency of record-breaking heat in the Bay Area has increased noticeably. The 1961 San Francisco record stood for 56 years. It was then broken in 2017 and broken again in 2022. Climate scientists attribute this acceleration to the underlying warming trend: as average temperatures rise, the baseline from which heat events start is higher, pushing records higher even when the atmospheric dynamics driving the events are no more extreme than historical episodes. A heat wave that would have produced 100-degree temperatures in San Francisco decades ago may now produce 106 or 108 degrees because the starting temperature is already several degrees warmer.

Frequently Asked Questions

What is the hottest temperature ever recorded in San Francisco?

107°F, set on September 9, 2022. This broke the previous all-time record of 106°F set on September 1, 2017, which had itself broken a record of 101°F from June 14, 1961. All three records were set during heat dome events when the North Pacific High suppressed the marine layer and Diablo winds brought hot interior air to the coast.

What is the hottest temperature ever recorded in the Bay Area?

The inland East Bay cities hold the Bay Area's highest recorded temperatures. Concord and Livermore have both recorded temperatures above 115°F during major heat dome events, including 116°F during the August 2020 heat dome. These temperatures reflect the full inland heat experience when the marine layer completely fails to reach the inland valleys.

Why is the temperature difference between the coast and inland so large during heat events?

During a normal Bay Area summer afternoon, the coast-to-inland temperature difference is about 15-20°F. During a major heat dome event that suppresses the marine layer, that difference grows to 40-55°F. The coast's normal cooling mechanism; the sea breeze and marine layer; is completely absent, allowing inland valleys to heat freely while some coastal marine influence remains. Half Moon Bay may be at 62°F the same afternoon that Concord is at 116°F; 54 degrees apart, 35 miles apart.

How does the Bay Area's heat ceiling compare to other California cities?

Inland Bay Area cities like Livermore and Concord approach or match extreme temperatures seen in the Central Valley: 115-116°F in the most extreme events. Sacramento and Fresno have similar peaks. Coastal San Francisco's 107°F record is extreme for a city with maritime exposure but modest by the standards of interior California. The Bay Area's uniqueness is the extreme range; Half Moon Bay rarely exceeds 75°F while Livermore can hit 115°F on the same day, a 40°F gradient within the same metropolitan area.

Are Bay Area heat records being broken more frequently?

Yes. San Francisco's all-time heat record was broken three times in about 60 years: 1961, 2017, and 2022. The acceleration is consistent with climate change raising the background temperature floor. Each heat dome event now starts from a higher baseline, so extreme temperatures reach higher peaks than equivalent events in the past. The 2022 record of 107°F would have been considered physically impossible in San Francisco within living memory of longtime residents.

Live Bay Area Conditions

Compare fog, temperature, wind, and comfort across the map.

See which microclimates are clear, cool, windy, or warming up right now.

Open the Weather Map
🔒Privacy Policy📄Terms of Service