A few times each year, the tides in San Francisco Bay rise significantly higher than normal. Streets near the waterfront flood without any rain. Shoreline trails disappear under several inches of water. Parking lots along the Embarcadero turn into shallow ponds. These are king tides, and they are not storms, malfunctions, or flukes. They are the predictable result of the sun, moon, and Earth aligning in a way that amplifies tidal forces to their annual maximum. In the Bay Area, king tides have taken on an additional significance: they are widely used as a preview of what ordinary high tides will look like as sea levels rise over the coming decades.
What Are King Tides?
Tides are driven by the gravitational pull of the moon and, to a lesser degree, the sun. The moon pulls water toward it as it orbits Earth, creating bulges of elevated water on the side of the Earth facing the moon and the opposite side. The sun exerts a similar effect, smaller in magnitude but significant. When the sun and moon align, their combined gravitational pull amplifies the tidal range. This is a syzygy, and it produces the spring tides that occur twice monthly at new and full moons. King tides go one step further: they occur when the moon is at perigee, its closest approach to Earth in its elliptical orbit, and the Earth is simultaneously near perihelion, its closest approach to the sun in its own slightly elliptical orbit. The combination of maximum lunar gravity, maximum solar gravity, and the aligned geometry produces the highest predicted tides of the year.
King tides are not a scientific term. Astronomers and oceanographers use "perigean spring tide." King tide is a colloquial term that originated in Australia and spread through coastal communities worldwide as a plain-language way to describe these extreme high-tide events. In California, the term is widely used by the Coastal Commission, NOAA, and community scientists who photograph and document them.
When Do King Tides Occur in the Bay Area?
The Bay Area sees its highest king tides in December and January, when Earth reaches perihelion, its closest point to the sun, in early January each year. The specific dates vary annually based on the lunar cycle, but the December and January full and new moons produce the most extreme predicted tides. A secondary king tide window occurs in November and sometimes late October, when conditions are nearly as favorable.
NOAA publishes predicted tide heights months in advance. San Francisco's tidal benchmark at the Ferry Building is one of the longest continuous tide gauge records on the West Coast, extending back to 1854. A king tide at the San Francisco gauge typically peaks between 6.5 and 7 feet above mean lower low water, the standard tidal datum. Ordinary high tides in San Francisco Bay average around 5.5 to 5.8 feet. The difference of one to two feet during king tides may sound modest, but in low-lying areas where the land sits only a foot or two above typical high tide lines, that extra height causes flooding.
Coastal flooding during king tides is made worse when storms or strong onshore winds coincide with the event. Wave action, surge from storm systems, and elevated ocean water from atmospheric pressure drops can add another foot or more to an already high tide. The worst Bay Area king tide flooding events typically combine a predicted king tide with a significant winter storm arriving at the same time.
Where King Tides Flood in the Bay Area
The communities most affected by king tides are those built on low-lying bay fill, former marshland, or shoreline areas within a foot or two of the current high tide line. Several Bay Area locations flood during nearly every king tide event.
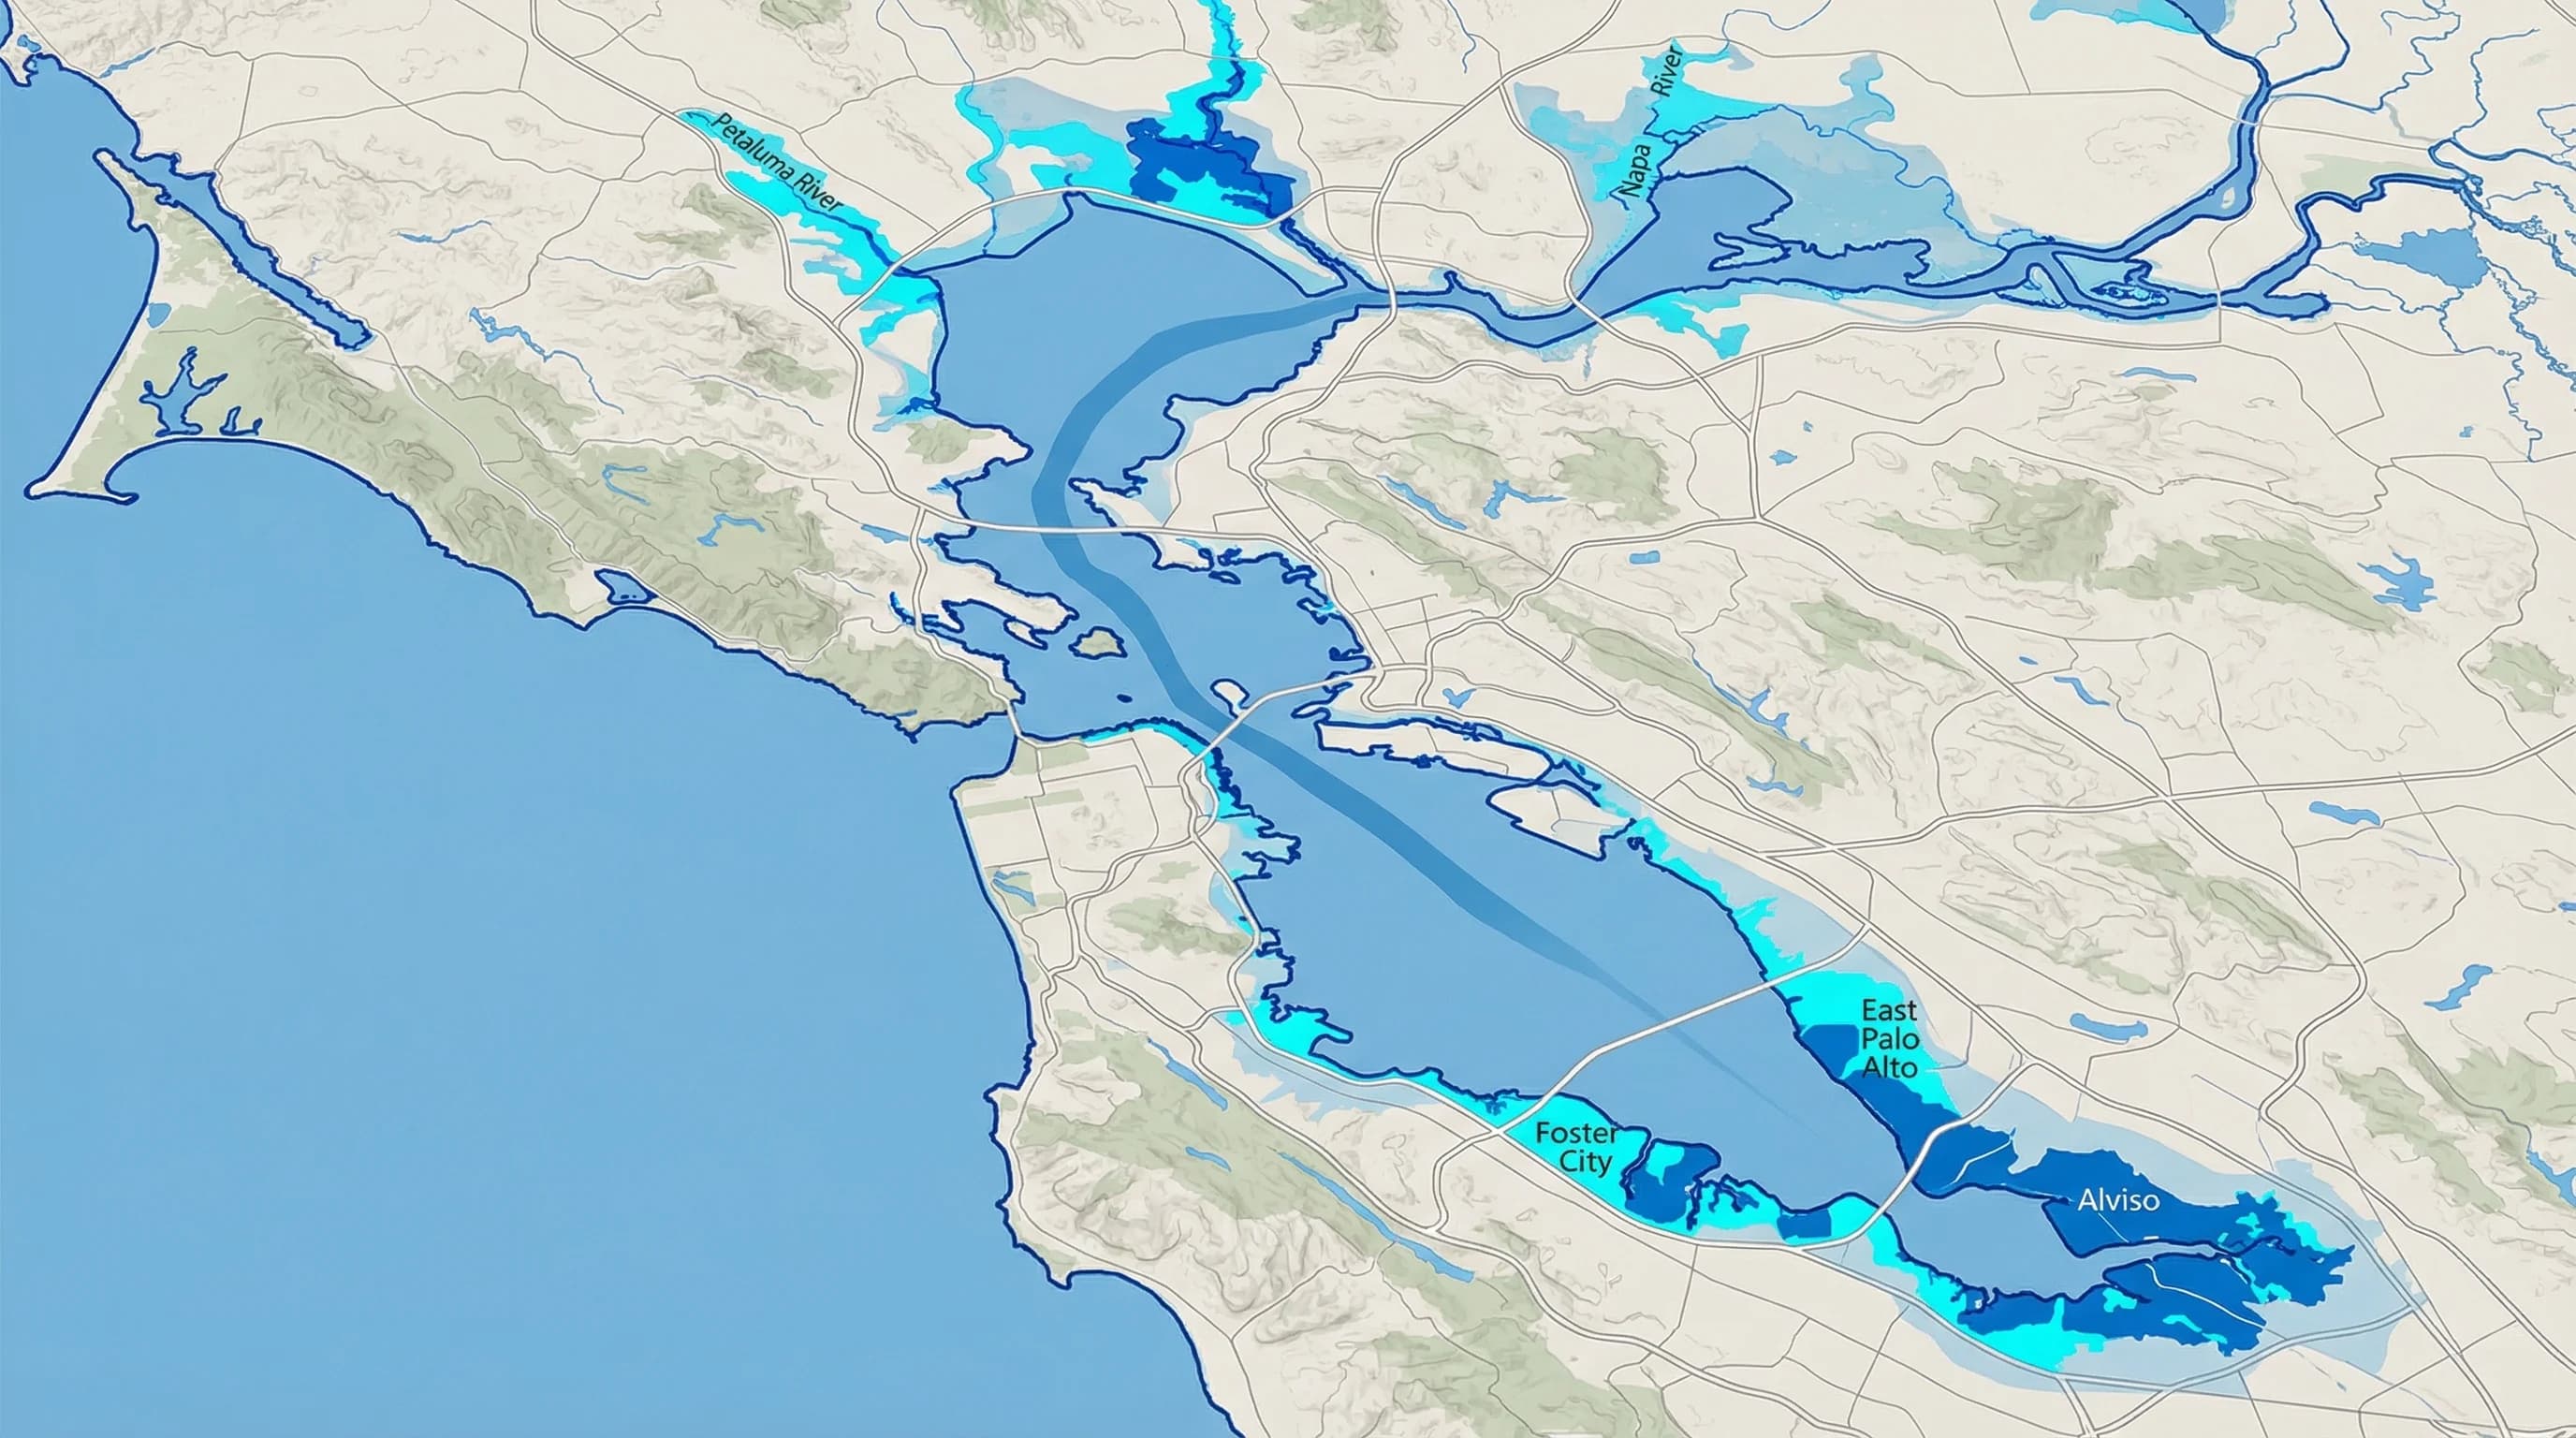
Alviso, at the southern end of San Francisco Bay in San Jose, is among the most vulnerable communities in the entire Bay Area. Much of Alviso sits at or below sea level, protected from regular tidal flooding only by levees. During king tides, levee-adjacent streets and the Alviso Marina County Park can flood even without a storm. Alviso is frequently cited in sea level rise planning documents as one of the highest-risk communities in the region.
Foster City on the Peninsula was built almost entirely on bay fill in the 1960s and sits just a few feet above sea level. The city relies on a system of levees and drainage infrastructure to stay dry during high tides. King tides push water up against these levees and can back up storm drains, causing flooding in low-lying residential and commercial streets even during dry weather.
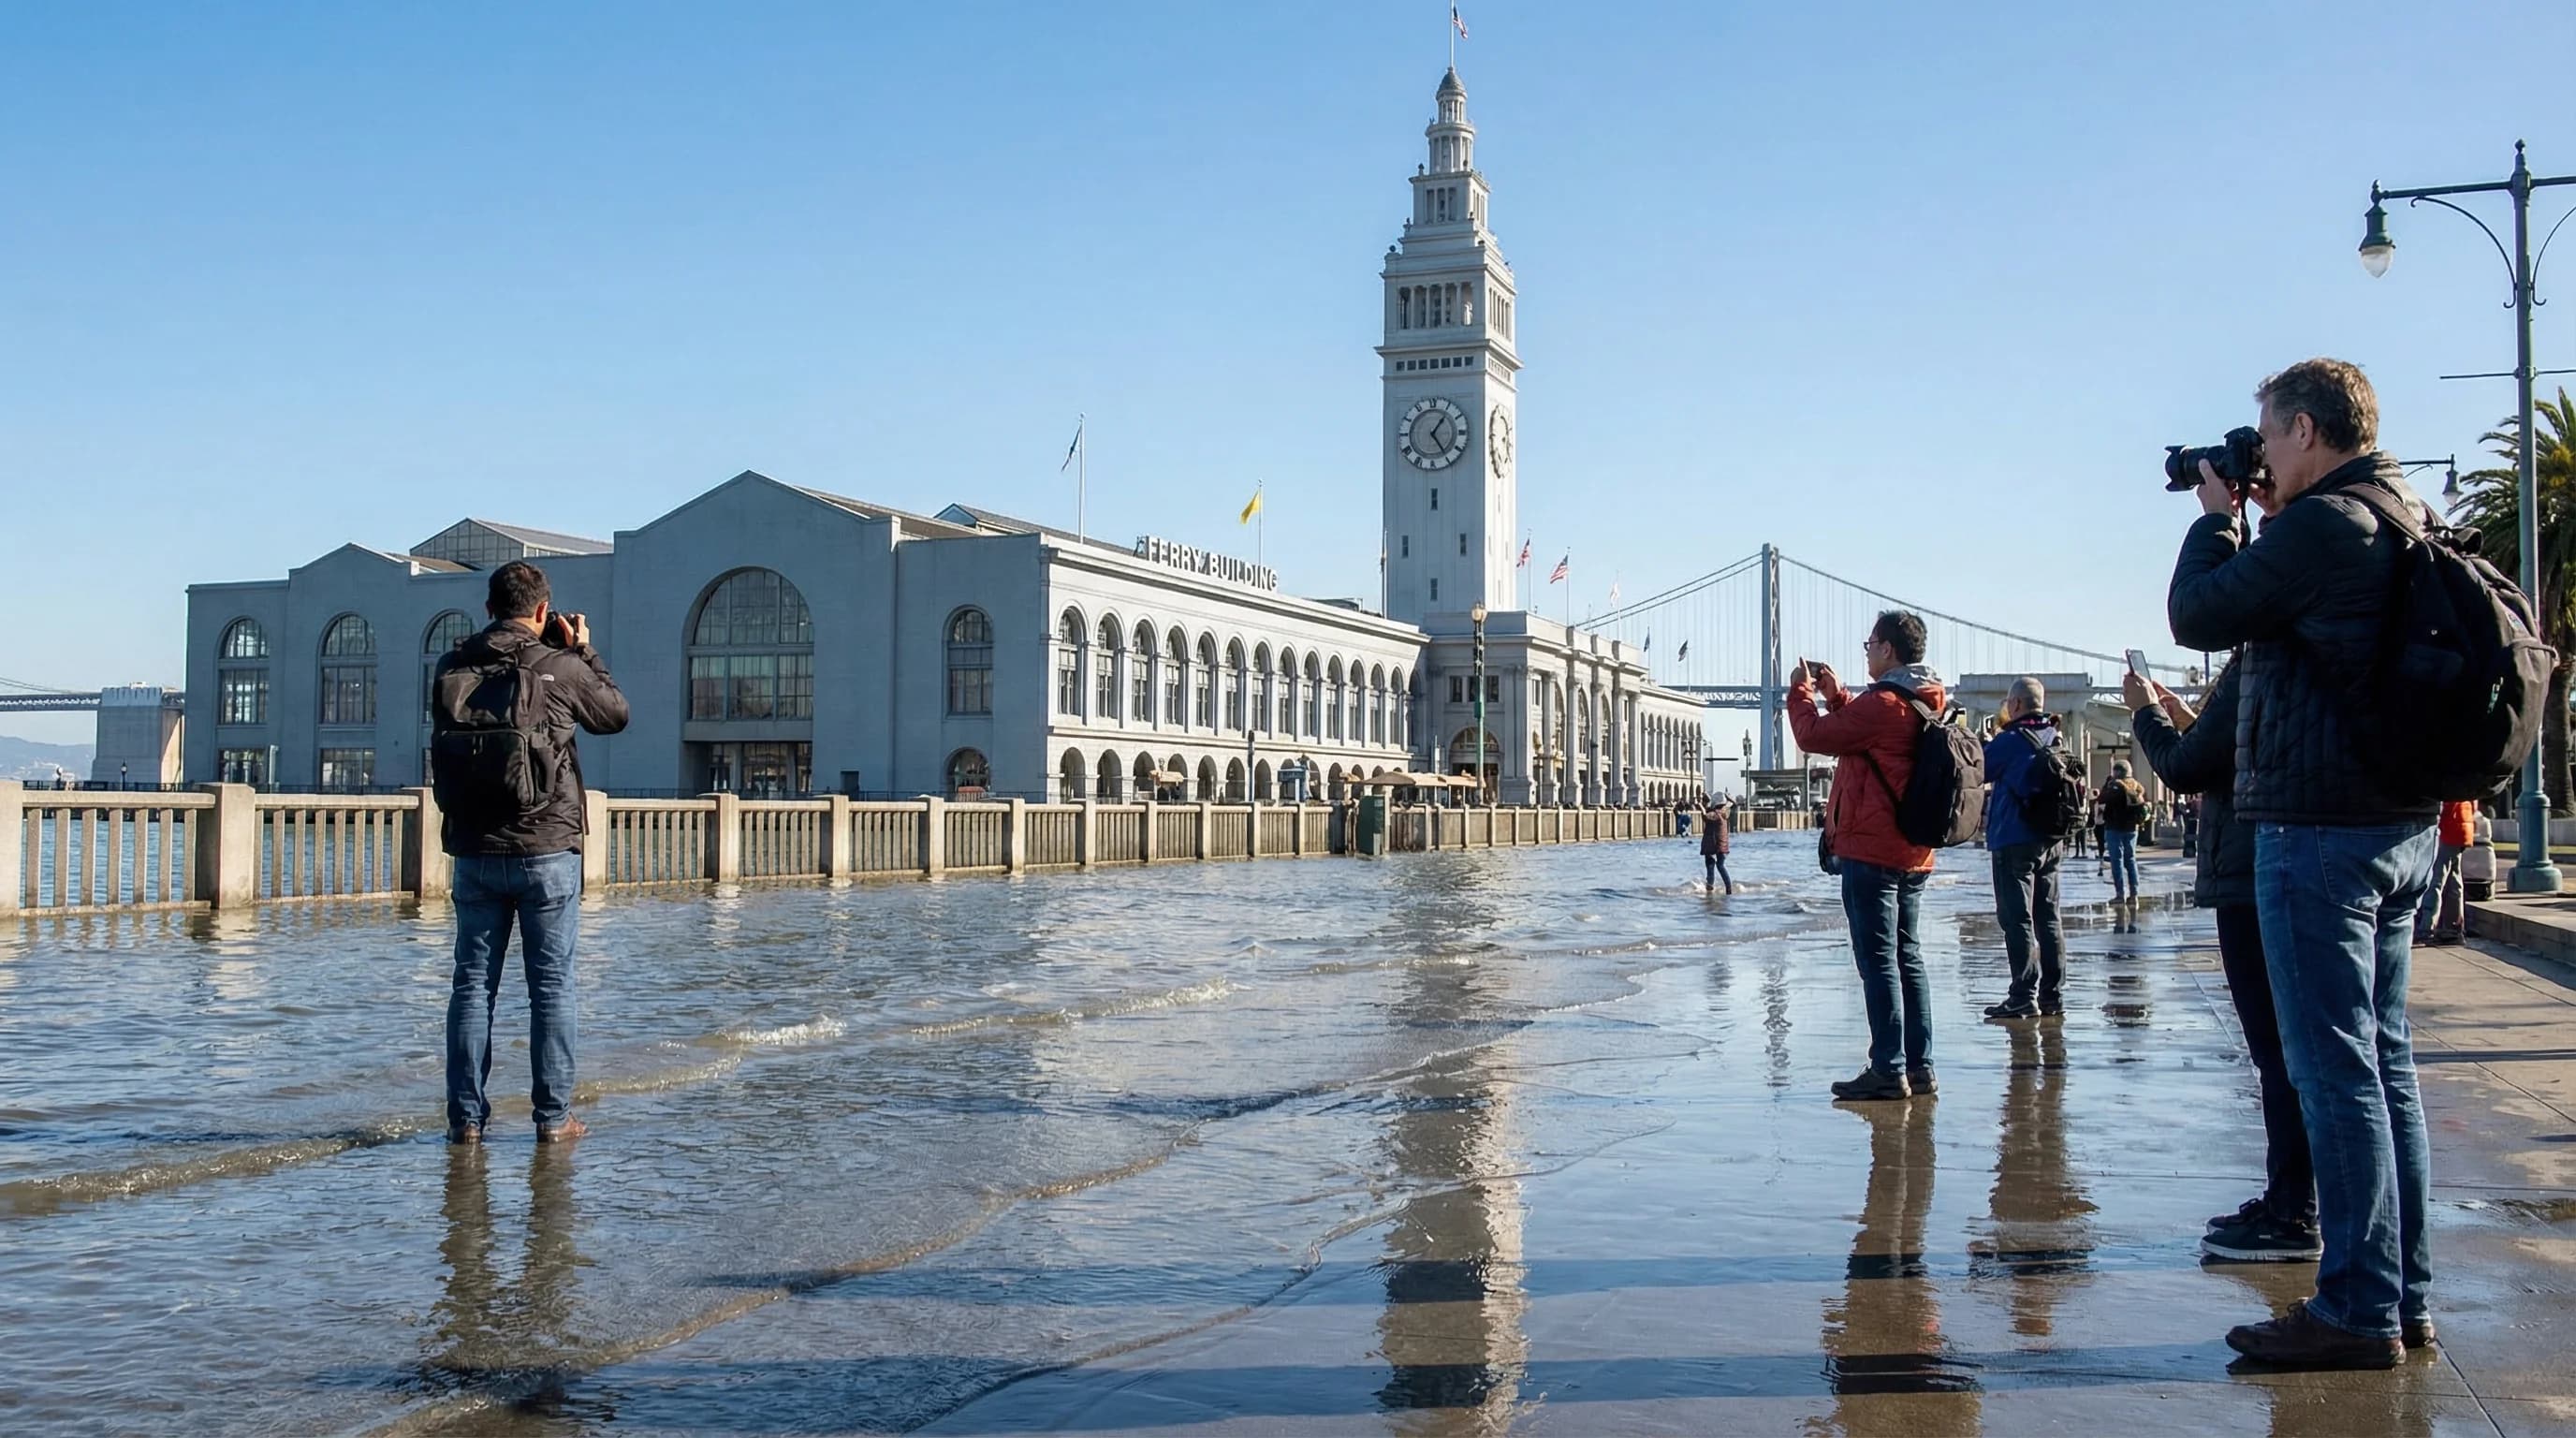
The Embarcadero in San Francisco floods at street level during the highest king tides. The area around the Ferry Building, particularly along the waterfront promenade and adjacent parking areas, can take on several inches of water. This is one of the most photographed king tide locations in the Bay Area precisely because it is so visible and centrally located.
Other recurring king tide flood spots include portions of Petaluma along the Petaluma River, the Napa River corridor through downtown Napa, East Palo Alto's bay shoreline, portions of the Richmond waterfront, and low-lying areas in Marin City and Sausalito near the water.
King Tides as a Sea Level Rise Preview
The California Coastal Commission runs the California King Tides Project, which has mobilized thousands of volunteers to photograph king tide flooding since 2010. The project's core idea is simple: the flooding you see during a king tide today is a reasonable approximation of what a normal high tide will look like if sea levels rise by one to two feet. That level of rise is projected for the Bay Area by 2050 to 2100 under moderate scenarios from the California Ocean Protection Council.
The photographs are useful in a way that maps and projections are not. Seeing a flooded street in your neighborhood, documented in a real photograph on a clear day with no storm present, communicates risk more directly than a color-coded map. The King Tides Project has produced an archive of thousands of images from around the Bay Area shoreline showing exactly what locations look like when tidal water rises to levels that will become routine.
Sea level in San Francisco Bay has risen approximately 9 inches since 1900, based on the NOAA tide gauge record. The rate of rise has accelerated in recent decades. Under the California Ocean Protection Council's "likely" scenario, the Bay Area should expect an additional 1.1 to 2.7 feet of rise by 2100. Under high-end scenarios that account for accelerated ice sheet loss, projections exceed 5 feet. Each foot of sea level rise converts a king tide flood event into a regular high-tide flood event.
How to Track King Tides in the Bay Area
NOAA's tide predictions are published a year in advance and are free to access attidesandcurrents.noaa.gov. The San Francisco station (Station ID 9414290) is the primary reference for Bay Area tides. To identify upcoming king tide windows, look for predicted high tides exceeding 6.5 feet at the San Francisco gauge in December and January. The NOAA site also shows the difference between predicted (astronomical) tides and observed tides, which tells you how much additional water is present from atmospheric and oceanographic conditions on any given day.
The California Coastal Commission's King Tides Project website announces king tide events each fall and recruits photographers to document flooding around the state. For the Bay Area specifically, the Bay Conservation and Development Commission (BCDC) tracks sea level rise and tidal flooding through its Adapting to Rising Tides program, which includes interactive maps showing which Bay Area areas are projected to flood at various sea level rise scenarios.
If you want to see a king tide in the Bay Area, the Embarcadero in San Francisco near the Ferry Building is the easiest and most visually striking location. Come at predicted high tide, not at low tide, and check the NOAA prediction for the day you plan to visit. A predicted high of 6.8 feet or above at the San Francisco gauge will produce visible street-level flooding along the waterfront on a calm day. Add a winter storm to the equation and the flooding will be considerably more dramatic.