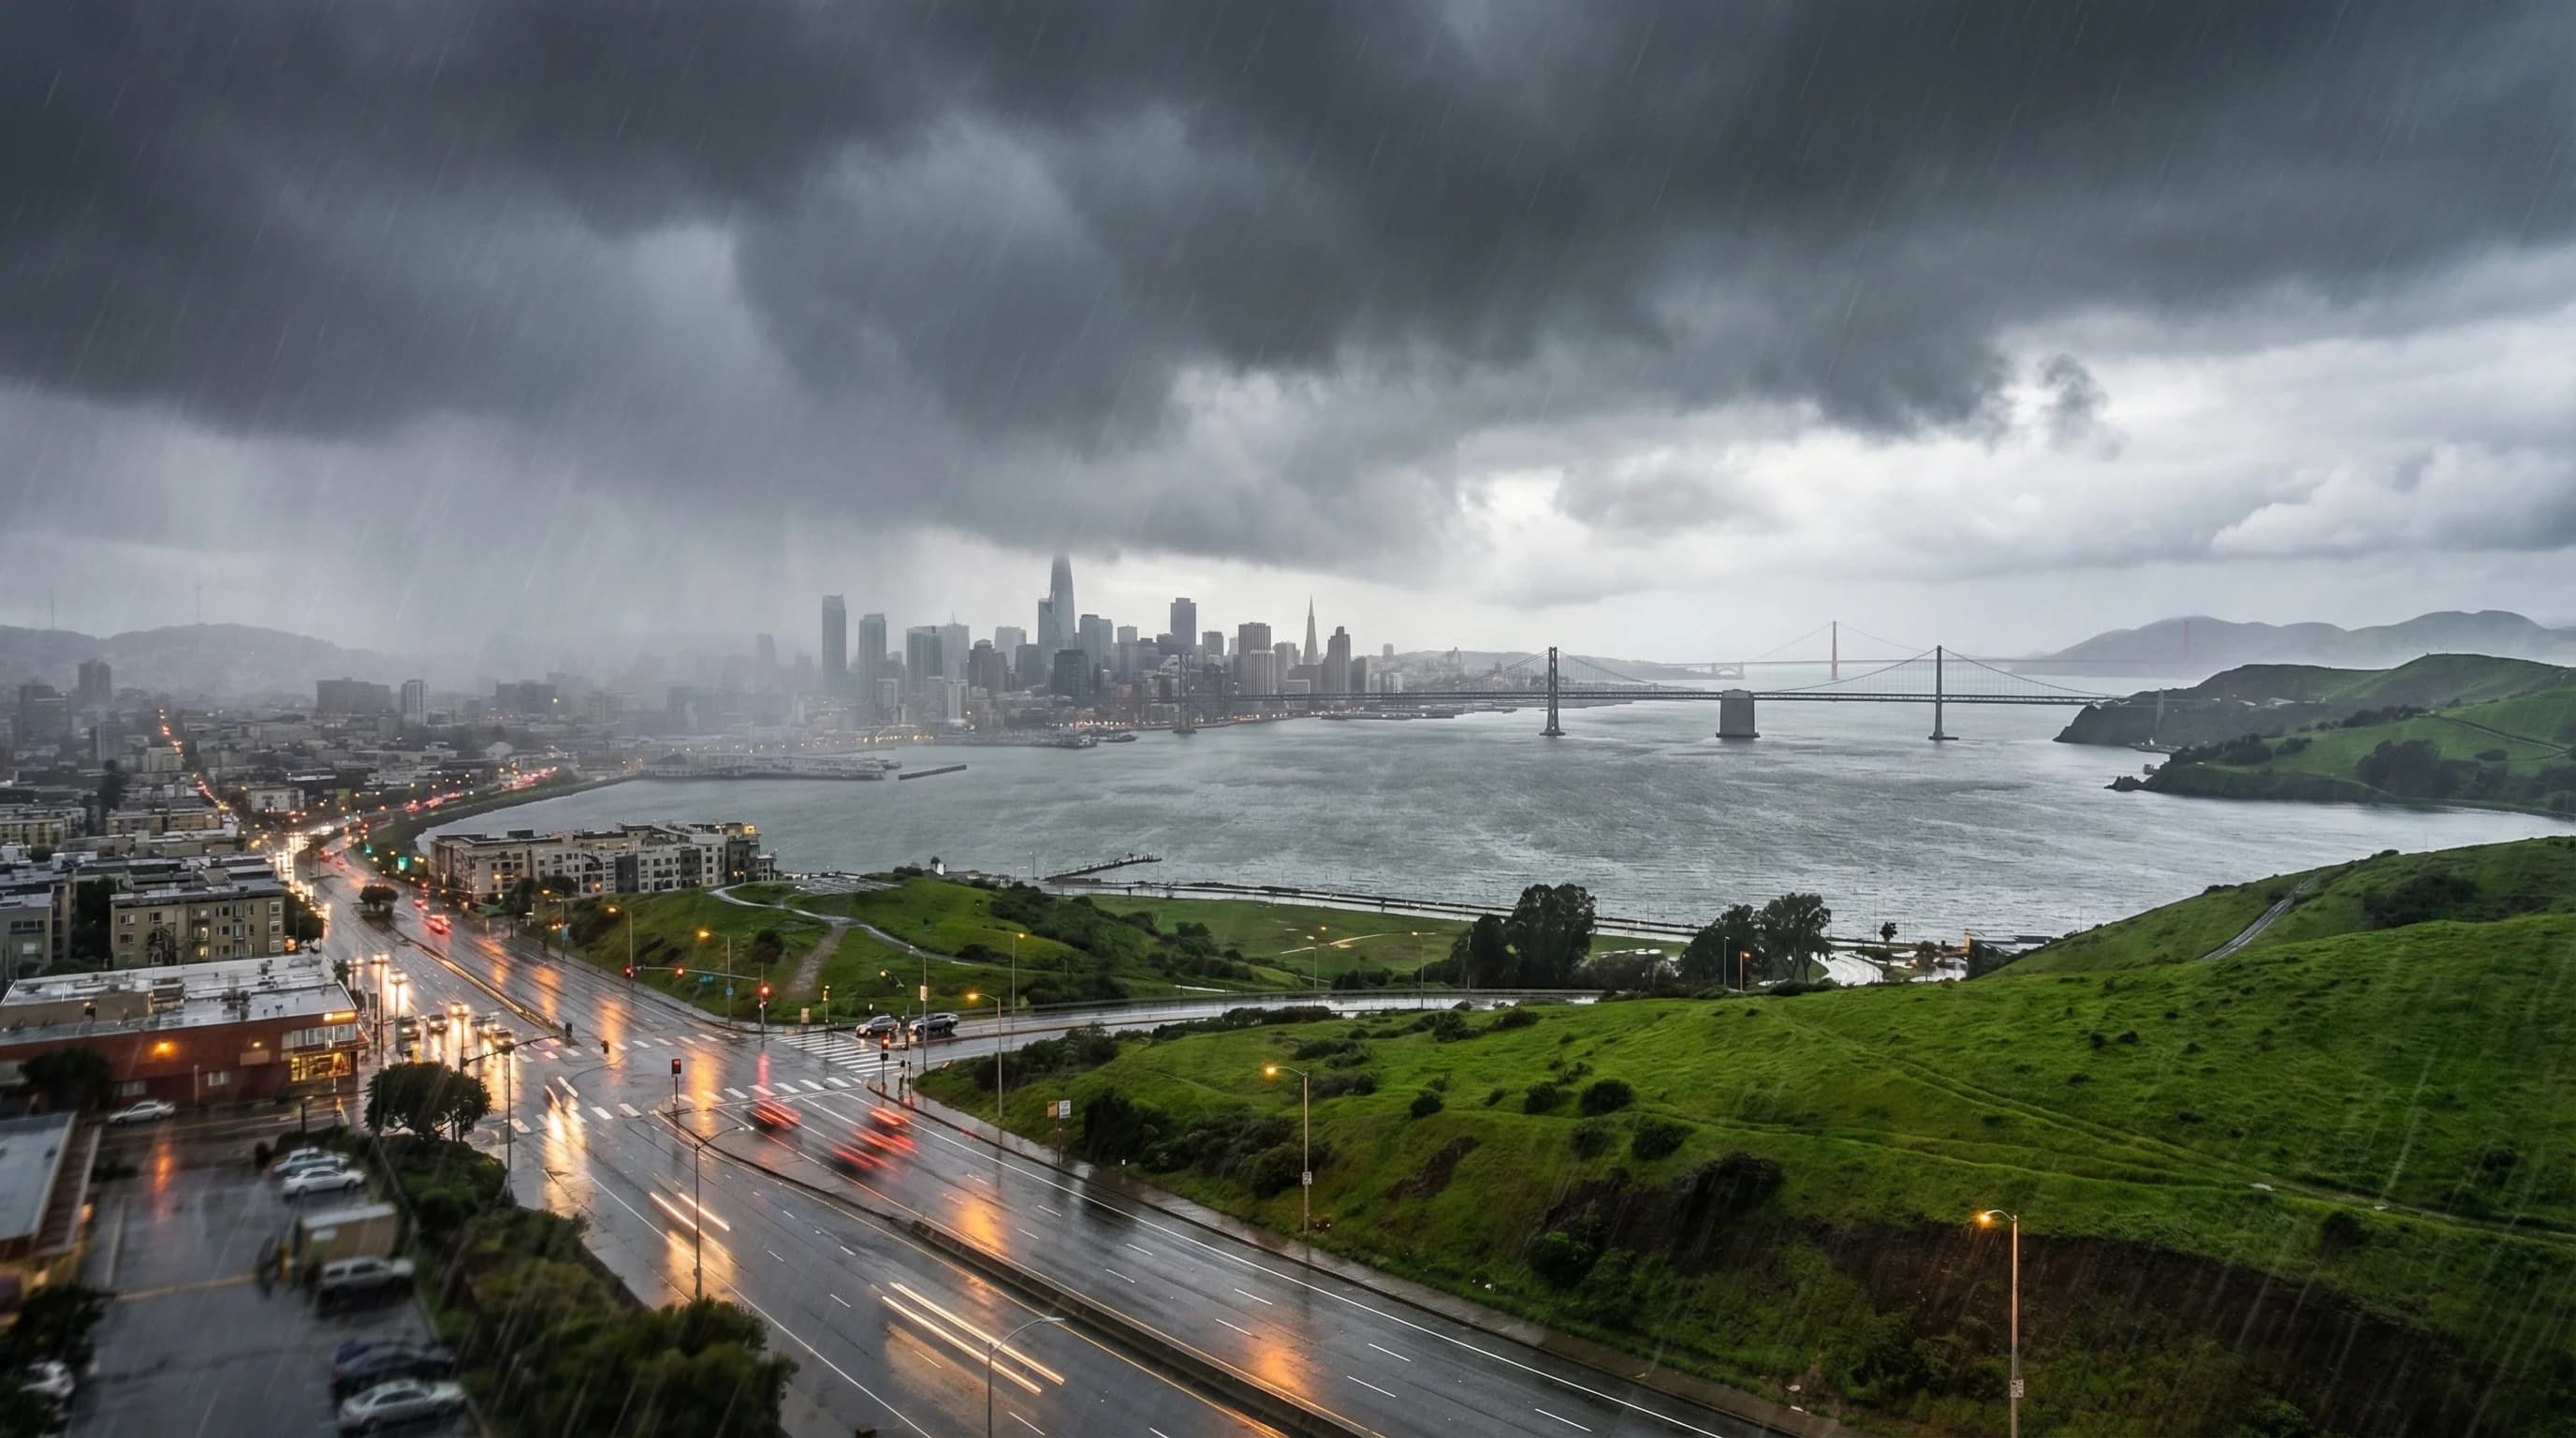
The Bay Area has a Mediterranean climate, which means almost all of its annual rain falls in a roughly five-month window from November through March. The other seven months are almost entirely dry. This pattern is extreme by the standards of most American cities: Atlanta, Georgia, gets roughly 50 inches of rain annually, spread across all twelve months. The Bay Area gets less than half that, but San Francisco concentrates its 22 inches into a roughly five-month sprint. That seasonal concentration, its structure and variability, defines nearly everything about how the Bay Area works.
Why the Bay Area Has a Wet Season
The Mediterranean climate pattern is driven by the seasonal migration of atmospheric pressure systems. In summer, the North Pacific High sits north of California, blocking storm tracks from reaching the state and creating the hot, dry conditions of the drought season. In winter, the High weakens and shifts south, and the storm track drops to a latitude where it can direct Pacific weather systems directly into Northern California.
The jet stream, a high-altitude river of fast-moving air that guides storm systems, typically positions itself across the northern Pacific in summer and dips southward in winter. When the jet stream drops to roughly 35 to 45 degrees North latitude, which corresponds to Northern California's position, storms can travel directly from the Pacific into the Bay Area. The transition from dry to wet season happens when the jet stream descends: usually sometime in October or November, though the exact timing varies significantly year to year.
The Structure of a Typical Wet Season
Within the wet season, rainfall does not arrive uniformly. It comes in discrete storm events separated by dry interludes. A typical Bay Area winter includes 10 to 20 significant storm events, each lasting one to three days, with dry spells of several days to several weeks between them. The dry spells during winter often bring some of the Bay Area's most beautiful weather: clear skies, cool temperatures, low humidity, and excellent visibility.
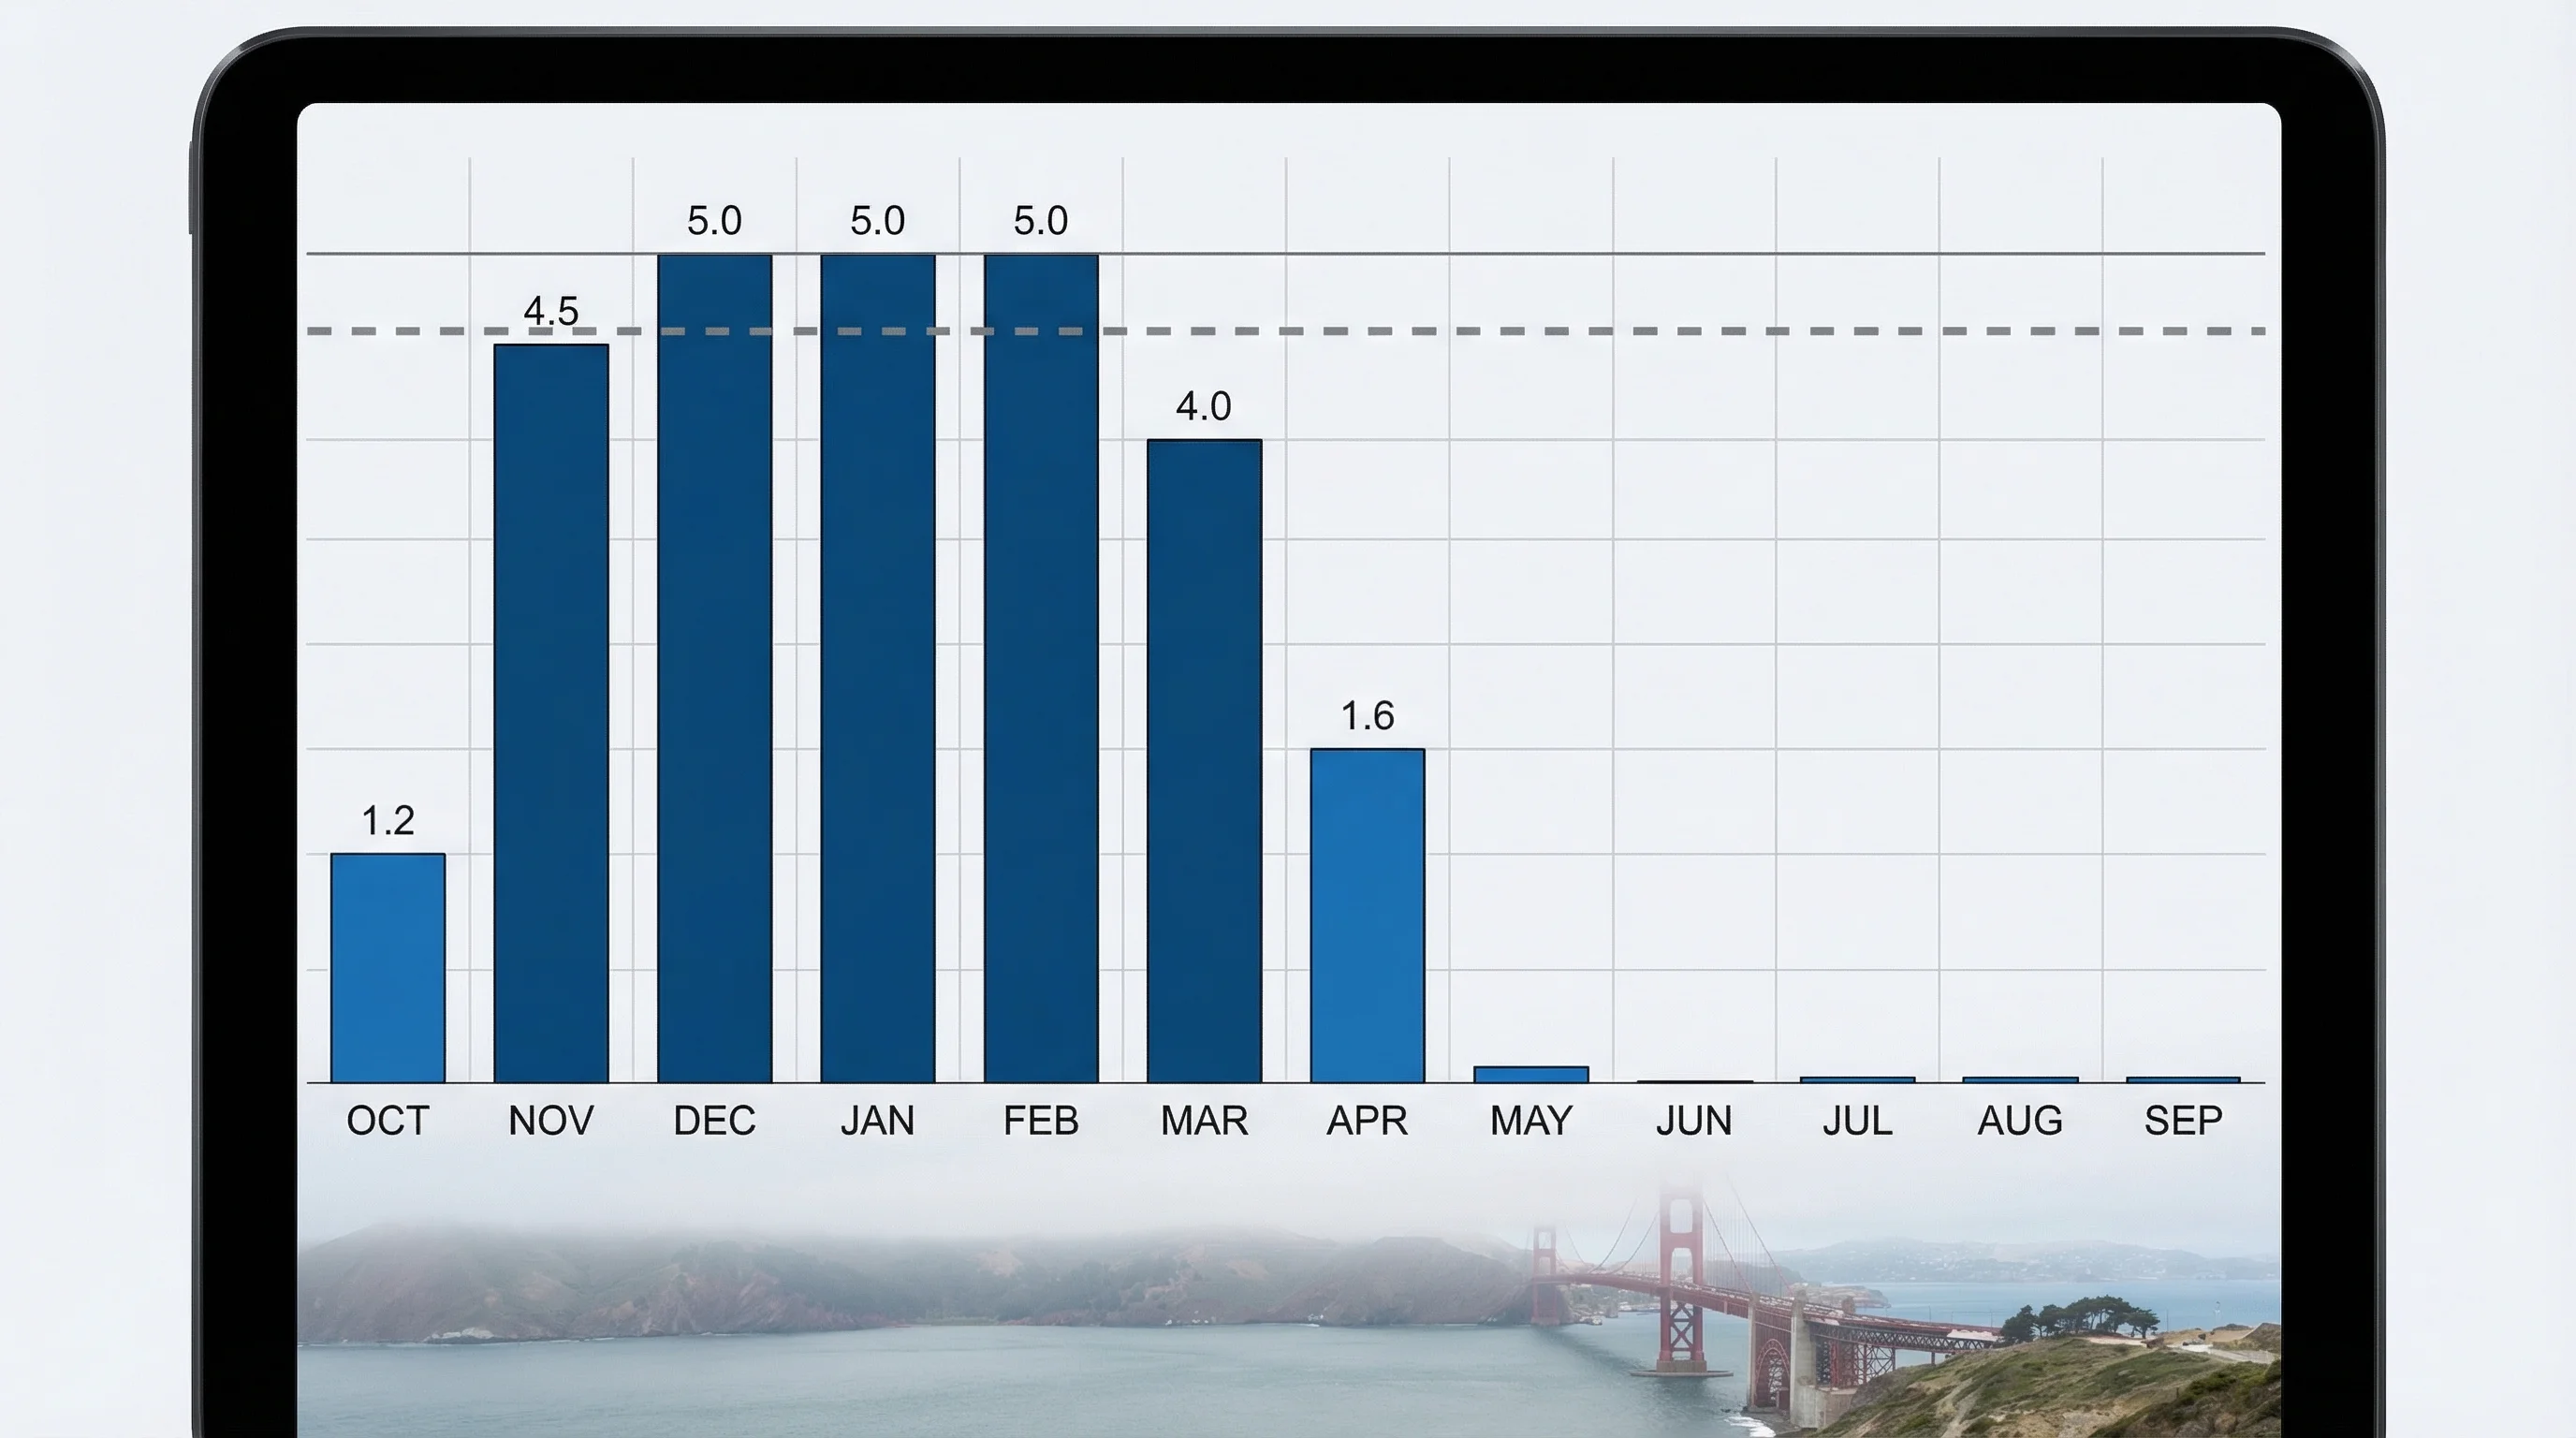
December and January are historically the wettest months in San Francisco, typically accounting for 40 to 50 percent of the annual rainfall total between them. February is also wet. March sees declining storm frequency but can still deliver significant rainfall, particularly in La Niña years when the storm track stays positioned across Northern California into spring. April through October is the dry season, with May through September averaging essentially zero measurable rainfall across the Bay Area.
The extreme concentration of rainfall in winter means the Bay Area has a fire season that runs through the dry period. By October, after months without rain, vegetation in coastal hills and inland ranges is tinder-dry. The combination of dry vegetation and seasonal offshore winds, which peak in September and October, creates the conditions that make the Bay Area's fall the most dangerous fire period.
How Wet Seasons Vary: Drought Years vs. Flood Years
Bay Area annual rainfall is one of the most variable weather statistics in the United States. San Francisco's annual precipitation averages around 22 inches, but individual years can range from 8 inches in a severe drought year to 35 inches or more in a very wet year. This roughly 4-to-1 ratio of wet-to-dry years is extraordinary. Most American cities have year-to-year rainfall variability of 2-to-1 or less.
The primary driver of this variability is the El Niño-Southern Oscillation. El Niño years, when the tropical Pacific is warmer than average, tend to push the jet stream southward and deliver more than average rainfall to Southern California, but the effect on Northern California is mixed. Some El Niño winters are very wet in the Bay Area; others are drier than normal. La Niña years, with a cooler tropical Pacific, more consistently produce dry winters in Southern California but can deliver exceptional rainfall to Northern California when the storm track positions favorably.
Multi-year drought patterns can be severe. The 2012-2017 drought was the most intense on record in California, with four consecutive dry winters that depleted reservoirs, killed millions of trees in the Sierra Nevada, and set the stage for the severe wildfire seasons that followed. Conversely, the 2016-17 winter broke the drought spectacularly with a series of intense atmospheric river events that refilled reservoirs and delivered 200 percent of normal snowpack.
What the Wet Season Means for Daily Life
The wet season is when the Bay Area's landscape transforms. Hills that are brown and dry by August green up dramatically after the first autumn rains, typically in October or November. The green season runs from the first significant rainfall through May or June, when the hills brown again as the summer drought sets in. This two-color landscape is a defining feature of the Bay Area aesthetic: golden in summer, bright green in winter and spring.
Outdoor recreation planning in winter revolves around the rain. Hiking is excellent in the days after a storm, when air quality is at its best, wildflowers are emerging, and waterfalls are flowing. But trails in the coastal range, particularly in Marin and the Santa Cruz Mountains, can become dangerously muddy and eroded during active storms. The San Francisco Bay Trail and most Bay Area ridge trails are best avoided for at least a day after significant rain.
For visitors, the wet season is not the nightmare it might sound. Storms typically last one to three days, followed by dry, clear periods that can be spectacular. Many longtime Bay Area residents consider February their favorite outdoor month: wildflowers are starting, hills are green, and a clear February day after a storm can feel like the best weather the region offers. The key is flexibility. Plan outdoor activities around the clear windows between storms rather than assuming rain or avoiding the season entirely.
The First Rain and the Last Rain
Bay Area residents track two annual milestones: the first significant rain of autumn and the last significant rain of spring. The first rain is a genuine cultural event. It breaks the summer drought, washes months of accumulated dust and smoke off surfaces, and triggers the greening of the hills. It typically falls sometime between mid-October and mid-November, though in drought years it can be delayed into December.
The last significant rain of spring, usually sometime in April, marks the beginning of the dry season. After this point, the Bay Area will typically go without measurable rain for five to six months. This extended dry season is why water storage, conservation, and fire management are such persistent concerns in the region. Unlike most American cities where a dry month is a weather anomaly, a dry summer in the Bay Area is simply what summer is.