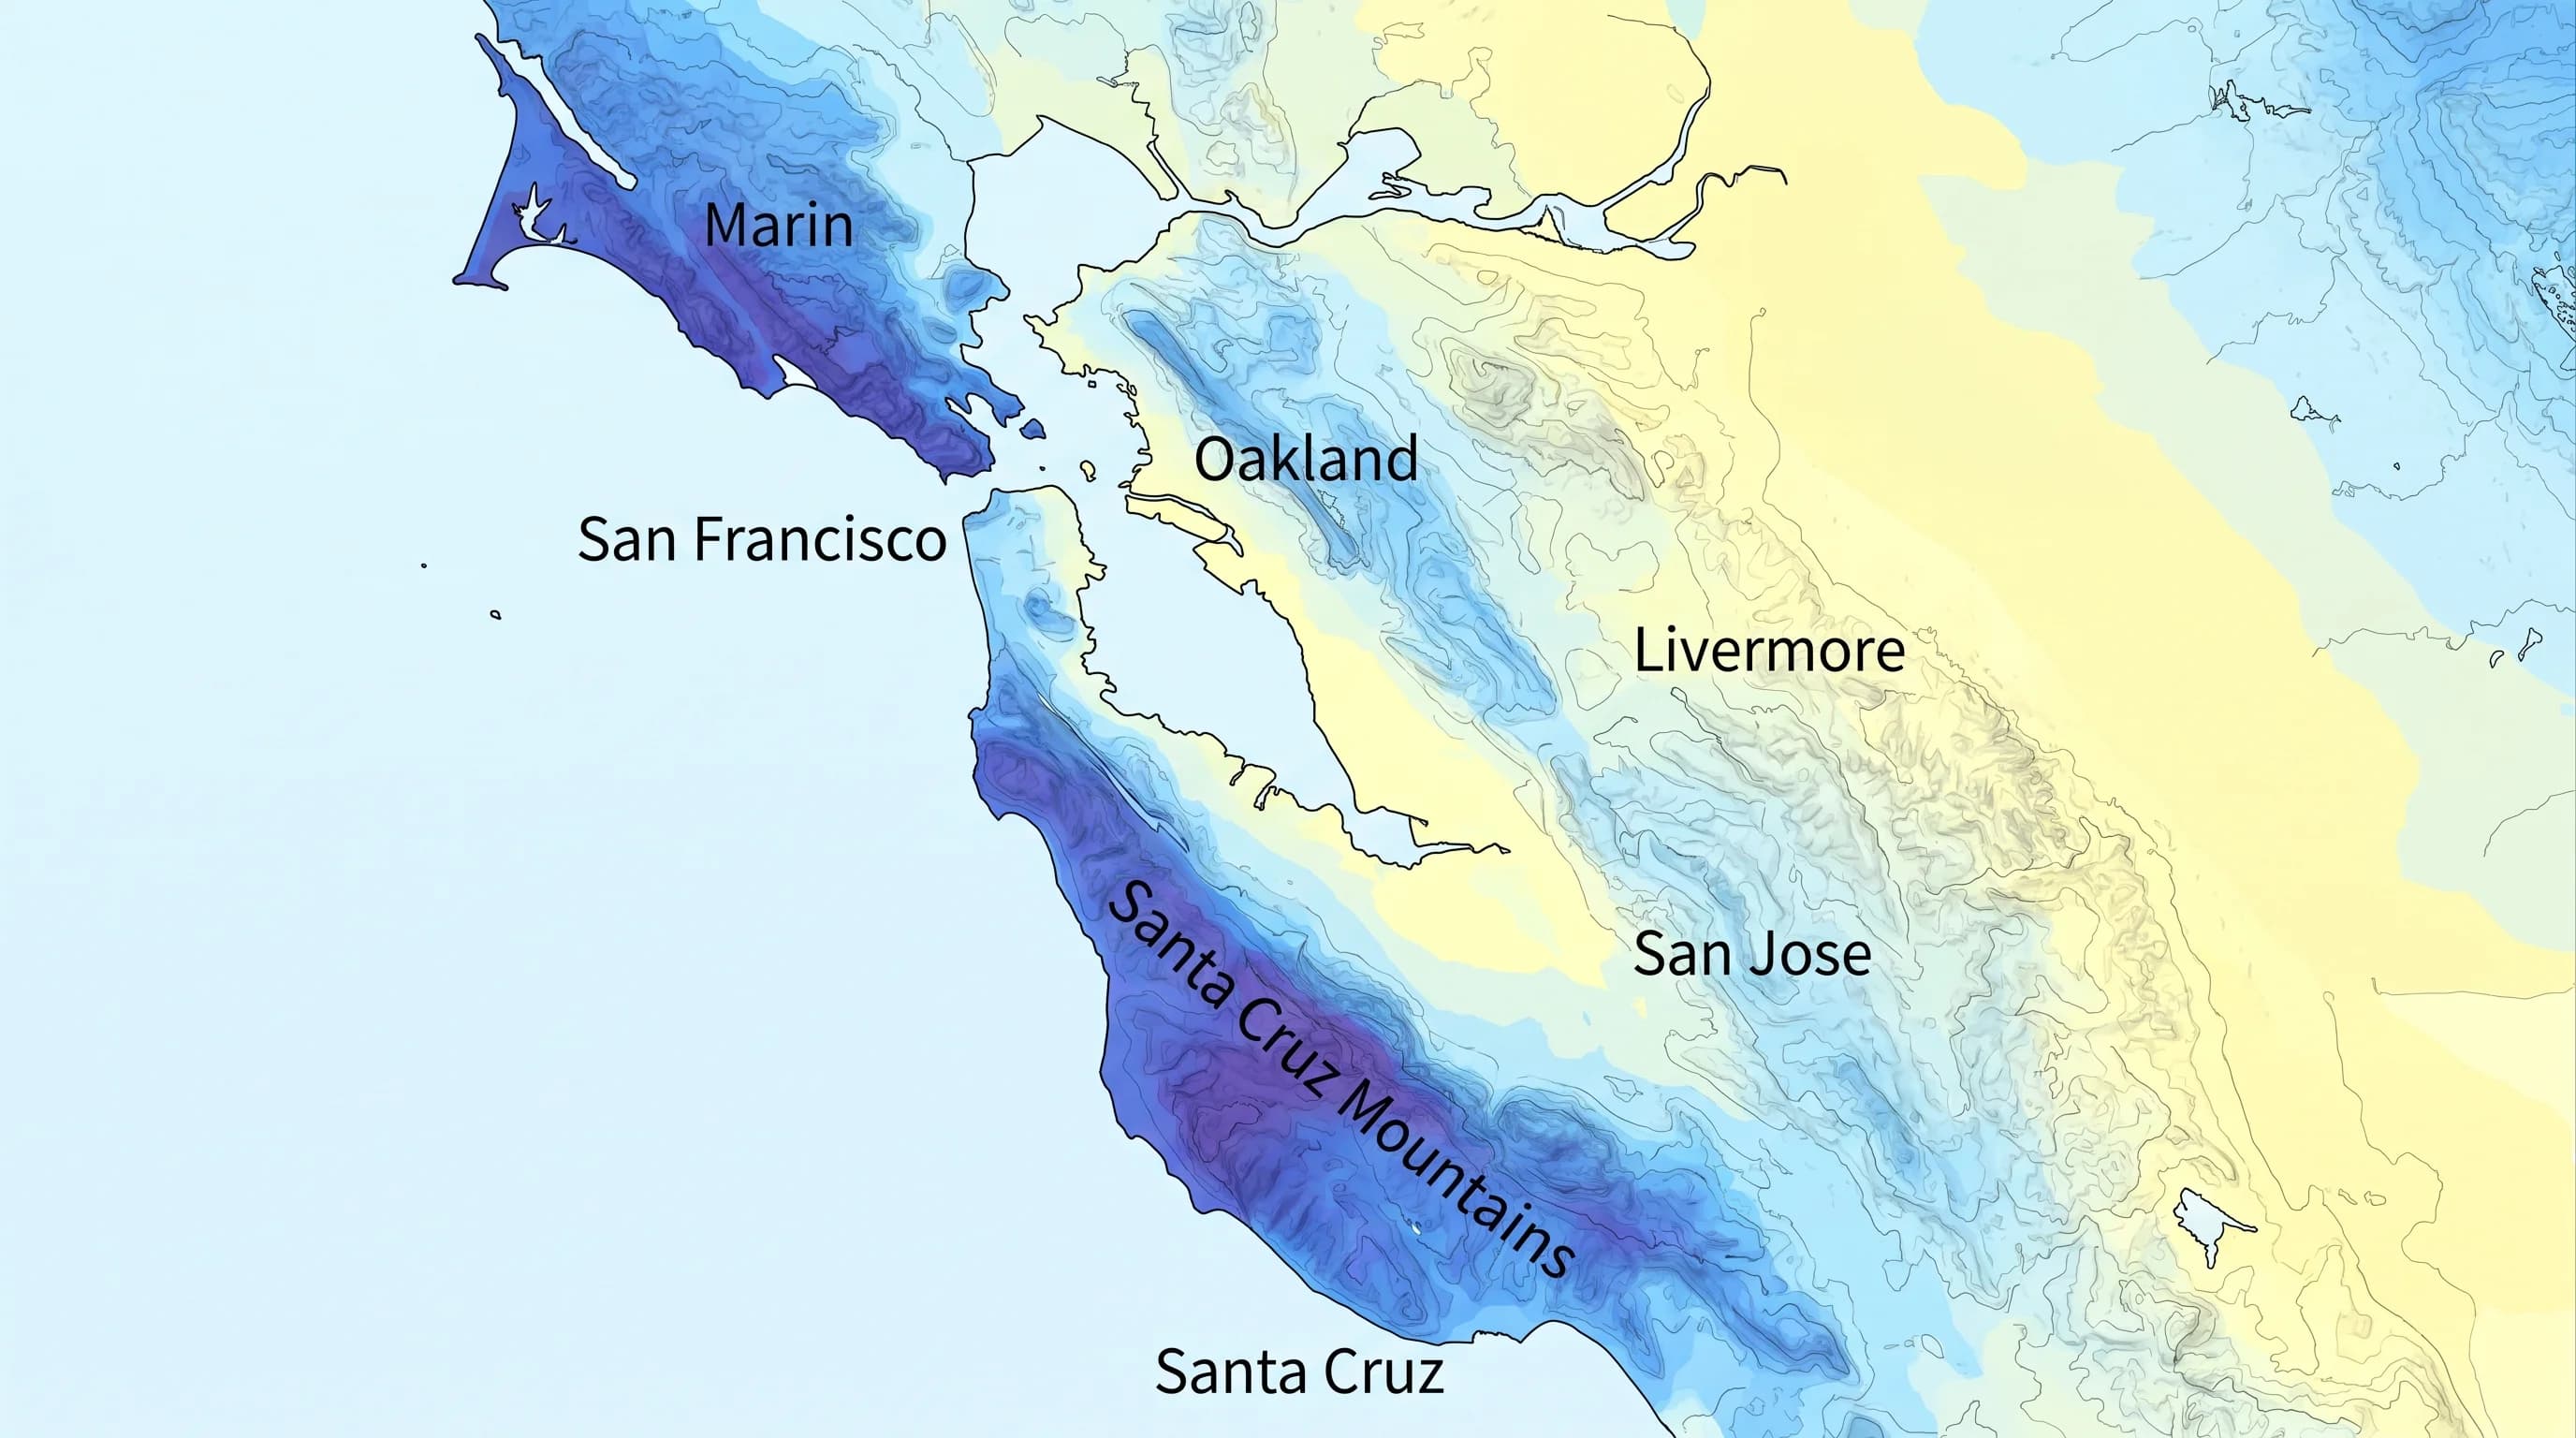
Annual rainfall in the Bay Area varies from 15 inches in the driest inland valleys to over 50 inches on the wettest coastal ridges, a threefold difference within a region you can drive across in an hour. San Francisco averages about 23 inches per year. Oakland gets 24 inches. Santa Rosa averages 32 inches. San Jose sits at just 15 inches. The variation is not random: it is driven by orographic lift, distance from the coast, and the orientation of mountain ridges relative to incoming storm tracks. Knowing which cities get the most and least rain is practical information for anyone choosing where to live, planning outdoor events, or trying to understand why their neighborhood floods while a city 20 miles away stays dry.
Which Bay Area Cities Get the Most Rain?
The wettest urban areas in the Bay Area are in the North Bay hills and the Santa Cruz Mountains. Santa Rosa averages 32 inches per year. The hills above Berkeley and Oakland receive 28-35 inches depending on elevation, with Tilden Regional Park averaging about 30 inches. Ben Lomond in the Santa Cruz Mountains receives over 50 inches per year, making it one of the wettest locations in the entire San Francisco Bay watershed.
The mechanism is orographic enhancement. Pacific storms approach from the west and southwest, carrying moisture-laden air at low altitudes. When that air encounters the coastal ranges, it is forced upward, cools, and wrings out additional moisture. West-facing slopes receive the most rain, while locations immediately east of ridgelines sit in a " rain shadow " and receive significantly less. This is why Berkeley's hills get 30+ inches while Walnut Creek, just over the ridge, gets about 20 inches.
Which Bay Area Cities Get the Least Rain?
The driest major Bay Area city is San Jose at about 15 inches per year. The South Bay sits in a partial rain shadow created by the Santa Cruz Mountains, which wring out much of the moisture from Pacific storms before it reaches the valley floor. Gilroy (14 inches) and Morgan Hill (16 inches) are even drier.
Livermoreand the Tri-Valley area average 14-16 inches, sitting behind both the coastal ranges and the East Bay hills in a double rain shadow. These are the Bay Area's driest inhabited areas, with annual rainfall comparable to Los Angeles. Concord (14 inches) and Antioch (12 inches) in the far East Bay are similarly dry, their locations deep inland and shielded by multiple ridgelines.
Rainfall by Subregion
The North Bay (Marin, Sonoma, Napa counties) is the wettest subregion, averaging 25-40 inches depending on location. This is because the North Bay hills are the first major terrain that winter storms encounter after crossing the Pacific, and the ridges are oriented perpendicular to the prevailing storm direction, maximizing orographic lift. Mount Tamalpais receives about 48 inches per year at its summit.
The Peninsula ( San Mateo County) is moderate at 20-25 inches along the bay side and 30-40 inches in the Santa Cruz Mountains. Half Moon Bay on the coast averages 28 inches. The East Bay is split: the hills get 28-35 inches while the flat bayside cities ( Fremont, Hayward, Union City) average 15-18 inches. San Francisco itself averages 23 inches, lower than many people expect, but the city's reputation for rain comes from the frequency (60+ rainy days per year) rather than the total volume.
Why Rainfall Totals Matter for Bay Area Life
Rainfall variation drives real consequences. Flood zones are concentrated in the wetter subregions and along creeks that drain steep terrain. Wildfire risk is paradoxically highest in the drier areas that accumulate less rain and dry out faster during summer. The wettest monthsconcentrate nearly all the annual total into a November-through-March window, meaning the difference between 15 inches and 40 inches is the difference between a dry winter landscape and one that is saturated, green, and actively draining. Knowing where you sit in the Bay Area's rainfall gradient is useful for everything from choosing a neighborhood to planning a garden to understanding why your commute floods in January.