safetytipsclimate science

AQI Explained: What Bay Area Air Quality Numbers Mean

By SFBayWeather||Updated |6 min read
AQI Explained: What Bay Area Air Quality Numbers Mean

Key Takeaways

  • AQI is a 0-500 scale with six color categories from Green (Good, 0-50) through Maroon (Hazardous, 301-500), standardized across pollutants for easy communication.
  • In the Bay Area, PM2.5 (fine particulate matter) from wildfire smoke and wood burning most commonly drives elevated AQI. Ground-level ozone drives summer AQI in the inland valleys.
  • Orange (101-150) means sensitive groups, including those with heart or lung disease, older adults, and children, may experience health effects. Red (151-200) means everyone may be affected.
  • AQI can vary dramatically across the Bay Area simultaneously: a coastal station may read 30 while an inland station reads 120+ on the same winter inversion day.
  • During wildfire smoke events, N95/KN95 masks provide meaningful protection; surgical and cloth masks do not filter fine particles effectively.

AQI stands for Air Quality Index, and it is the number Bay Area residents increasingly rely on to decide whether to open windows, exercise outdoors, or pick up masks before a wildfire smoke event. But the number itself is often misunderstood. An AQI of 100 is not twice as bad as 50. An AQI of 200 does not mean the air is four times worse than 50. And an AQI of 50 does not mean the air is safe for everyone. How AQI is calculated, what the color categories actually mean, and how Bay Area air quality relates to both weather and health are the foundation for making good decisions during the wildfire smoke events and winter inversion days that are increasingly part of life in the region.

How AQI Is Calculated

The AQI is a standardized scale from 0 to 500, developed by the EPA to communicate air pollution levels in a consistent way across different pollutants. The scale covers six major pollutants: ground-level ozone, fine particulate matter (PM2.5), coarse particulate matter (PM10), carbon monoxide, sulfur dioxide, and nitrogen dioxide. For any given measurement period, each pollutant is converted to its own AQI value, and the overall AQI is the highest of these individual values.

In the Bay Area, the pollutants that most frequently drive elevated AQI readings are PM2.5 and ground-level ozone. During wildfire smoke events, PM2.5 is almost always the controlling pollutant, sometimes to extremes. During summer, ozone can drive AQI in the inland valleys on hot afternoons when sunlight converts vehicle emissions to smog. Winter inversion days typically feature elevated PM2.5 from wood burning and vehicle emissions trapped under the inversion layer.

AQI scale diagram showing the six color categories from green (Good, 0-50) through maroon (Hazardous, 301-500), with health guidance for each category
The AQI scale converts multiple pollutant measurements into a single number, with six color categories that translate scientific measurements into health guidance. In the Bay Area, PM2.5 from wildfire smoke and wood burning, and ozone from vehicle emissions, most frequently drive elevated AQI readings.

AQI Categories and What They Mean

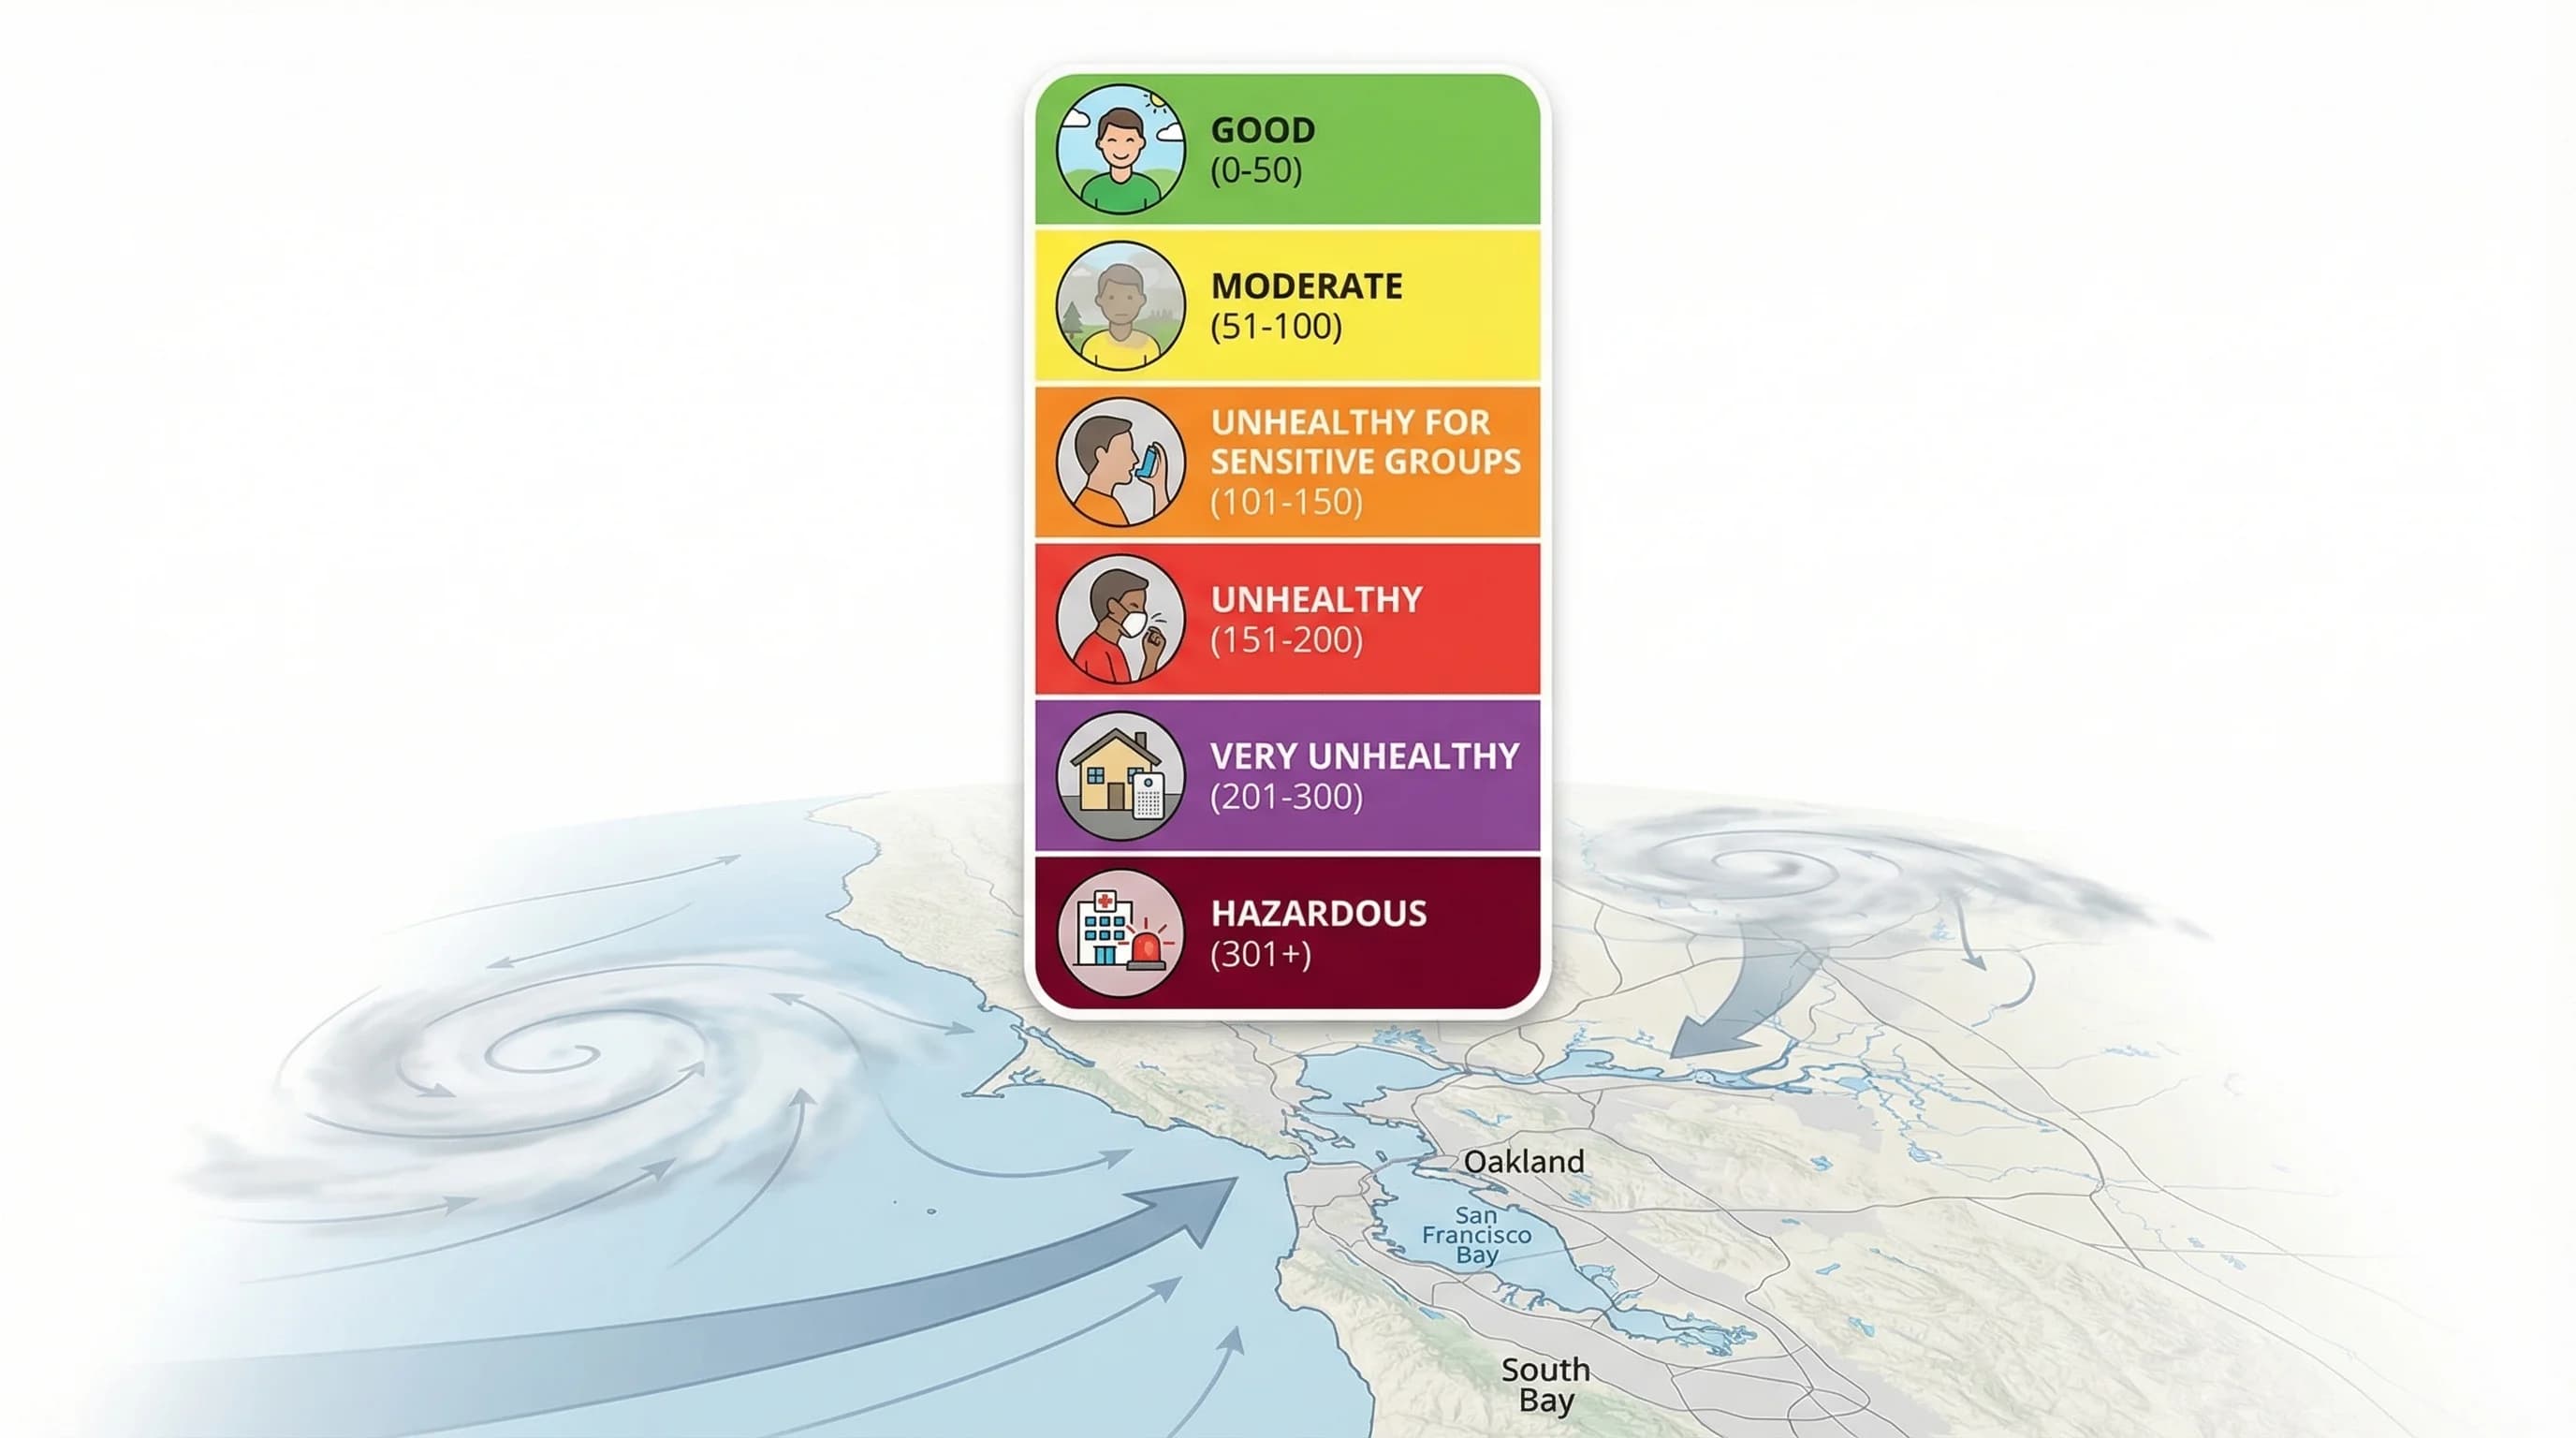
The AQI scale uses six color-coded categories that communicate both the pollution level and the health implications. Green (0-50, Good) means air quality poses little or no risk. Yellow (51-100, Moderate) is acceptable for most people, though some unusually sensitive individuals may experience symptoms from ozone. Orange (101-150, Unhealthy for Sensitive Groups) means people with heart disease, lung disease, older adults, and children may experience health effects. Red (151-200, Unhealthy) means everyone may begin to experience health effects. Purple (201-300, Very Unhealthy) means health warnings for everyone, with serious effects for sensitive groups. Maroon (301-500, Hazardous) means health emergency conditions, with everyone likely to be seriously affected.

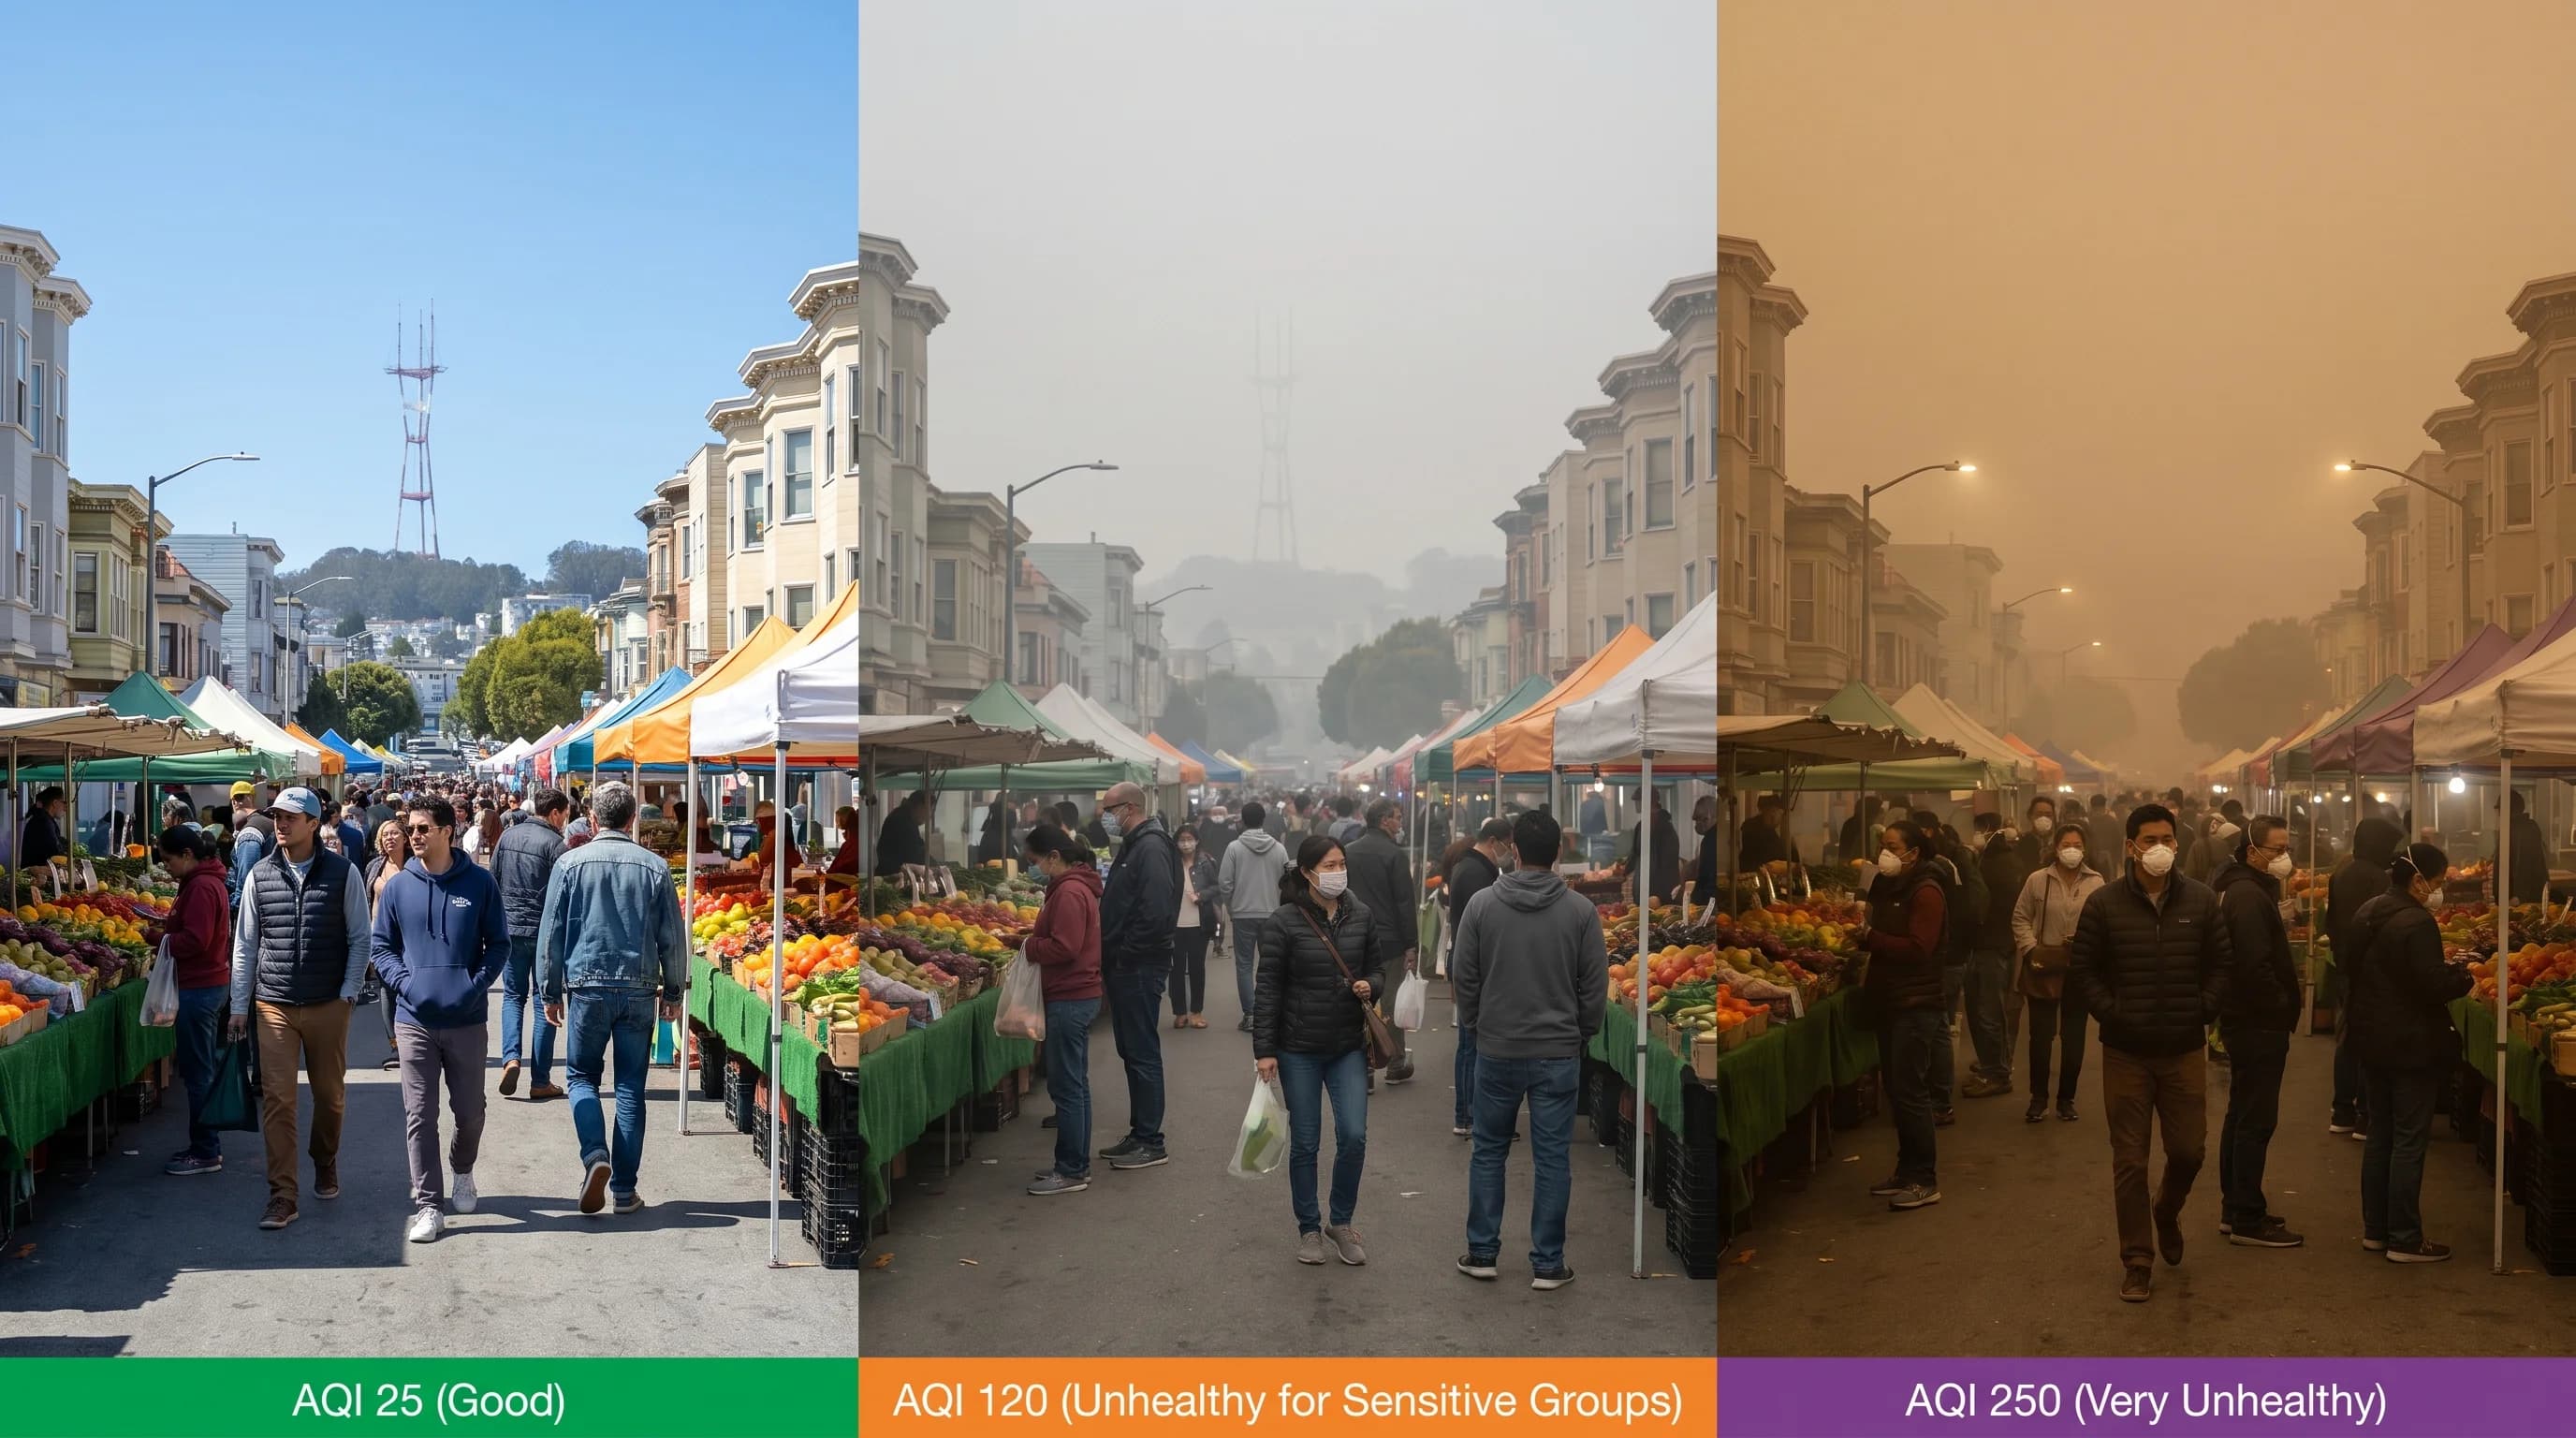
For most Bay Area days outside of wildfire events, AQI readings fall in the Good to Moderate range (0-100). Wildfire smoke events can push AQI to Very Unhealthy or Hazardous levels within hours; the Camp Fire in November 2018 pushed Bay Area AQI above 200 for multiple consecutive days, with some inland stations recording above 300. Winter inversion days with heavy wood burning typically reach the Unhealthy for Sensitive Groups range (101-150).

PM2.5: The Most Important Bay Area Pollutant

Fine particulate matter with a diameter of 2.5 micrometers or less, PM2.5, is the most health-relevant pollutant for Bay Area residents in most real-world situations. Particles at this size penetrate deep into the lungs and can enter the bloodstream. The health effects of PM2.5 exposure include aggravated asthma, decreased lung function, increased respiratory and cardiovascular hospitalization, and in severe long-term exposure, premature death. Children, older adults, and people with existing cardiopulmonary conditions are most vulnerable.

The Bay Area's two main PM2.5 sources are wood burning (in winter, during inversion events) and wildfire smoke (in summer and fall). Vehicle emissions also contribute to PM2.5 but are a smaller fraction than in many other urban areas. The Bay Area Air Quality Management District's real-time AQI monitoring network covers dozens of locations throughout the region, and AQI readings can vary significantly between monitoring stations; a coastal station may read 30 while an inland station on the same day reads 120.

Frequently Asked Questions

What is AQI and how is it calculated?

AQI stands for Air Quality Index. It is a standardized scale from 0 to 500 developed by the EPA to communicate air pollution levels. The scale covers six major pollutants: PM2.5, PM10, ground-level ozone, carbon monoxide, sulfur dioxide, and nitrogen dioxide. Each pollutant is converted to its own AQI value based on its concentration relative to health standards. The overall AQI for a location is the highest value among all pollutants measured; whichever pollutant is worst at a given time sets the AQI.

What do the AQI colors mean?

Six color categories: Green (0-50, Good) poses little risk. Yellow (51-100, Moderate) is acceptable but some unusually sensitive people may be affected by ozone. Orange (101-150, Unhealthy for Sensitive Groups) means people with heart or lung disease, older adults, and children may experience effects. Red (151-200, Unhealthy) means everyone may experience effects. Purple (201-300, Very Unhealthy) means health warnings for all. Maroon (301-500, Hazardous) means health emergency conditions.

Why does AQI vary so much across different Bay Area locations?

Air quality is highly localized based on weather patterns and pollution sources. Coastal areas benefit from the marine layer's scrubbing of particulates and the sea breeze's mixing. Inland valleys under strong temperature inversions accumulate pollutants from local vehicle emissions, wood burning, and industrial sources. During wildfire smoke events, the smoke plume may be thicker over some areas than others depending on wind direction. Always check the AQI monitoring station nearest your location rather than a regional average.

At what AQI level should I wear a mask outdoors?

N95 or KN95 masks provide meaningful protection at Orange (101-150) and above, particularly during wildfire smoke events. At Red (151-200) and higher, masks are strongly recommended for anyone spending time outdoors. At Purple (201-300) or Maroon (301-500), even healthy adults should minimize outdoor time and wear a properly fitted N95 if going outside is unavoidable. Surgical masks and cloth masks do not filter fine particles (PM2.5) effectively; they are primarily designed to reduce respiratory droplets, not smoke or smog particulates.

Where can I check Bay Area air quality in real time?

The Bay Area Air Quality Management District (baaqmd.gov) publishes real-time AQI readings from monitoring stations throughout the region. AirNow (airnow.gov) aggregates readings from all federal monitoring stations with color-coded maps. PurpleAir shows a dense network of low-cost sensor readings in near-real time, which is particularly useful during rapidly changing wildfire smoke events. For official health advisories and Spare the Air alert status, the BAAQMD website is the authoritative source.

Live Bay Area Conditions

Compare fog, temperature, wind, and comfort across the map.

See which microclimates are clear, cool, windy, or warming up right now.

Open the Weather Map
🔒Privacy Policy📄Terms of Service