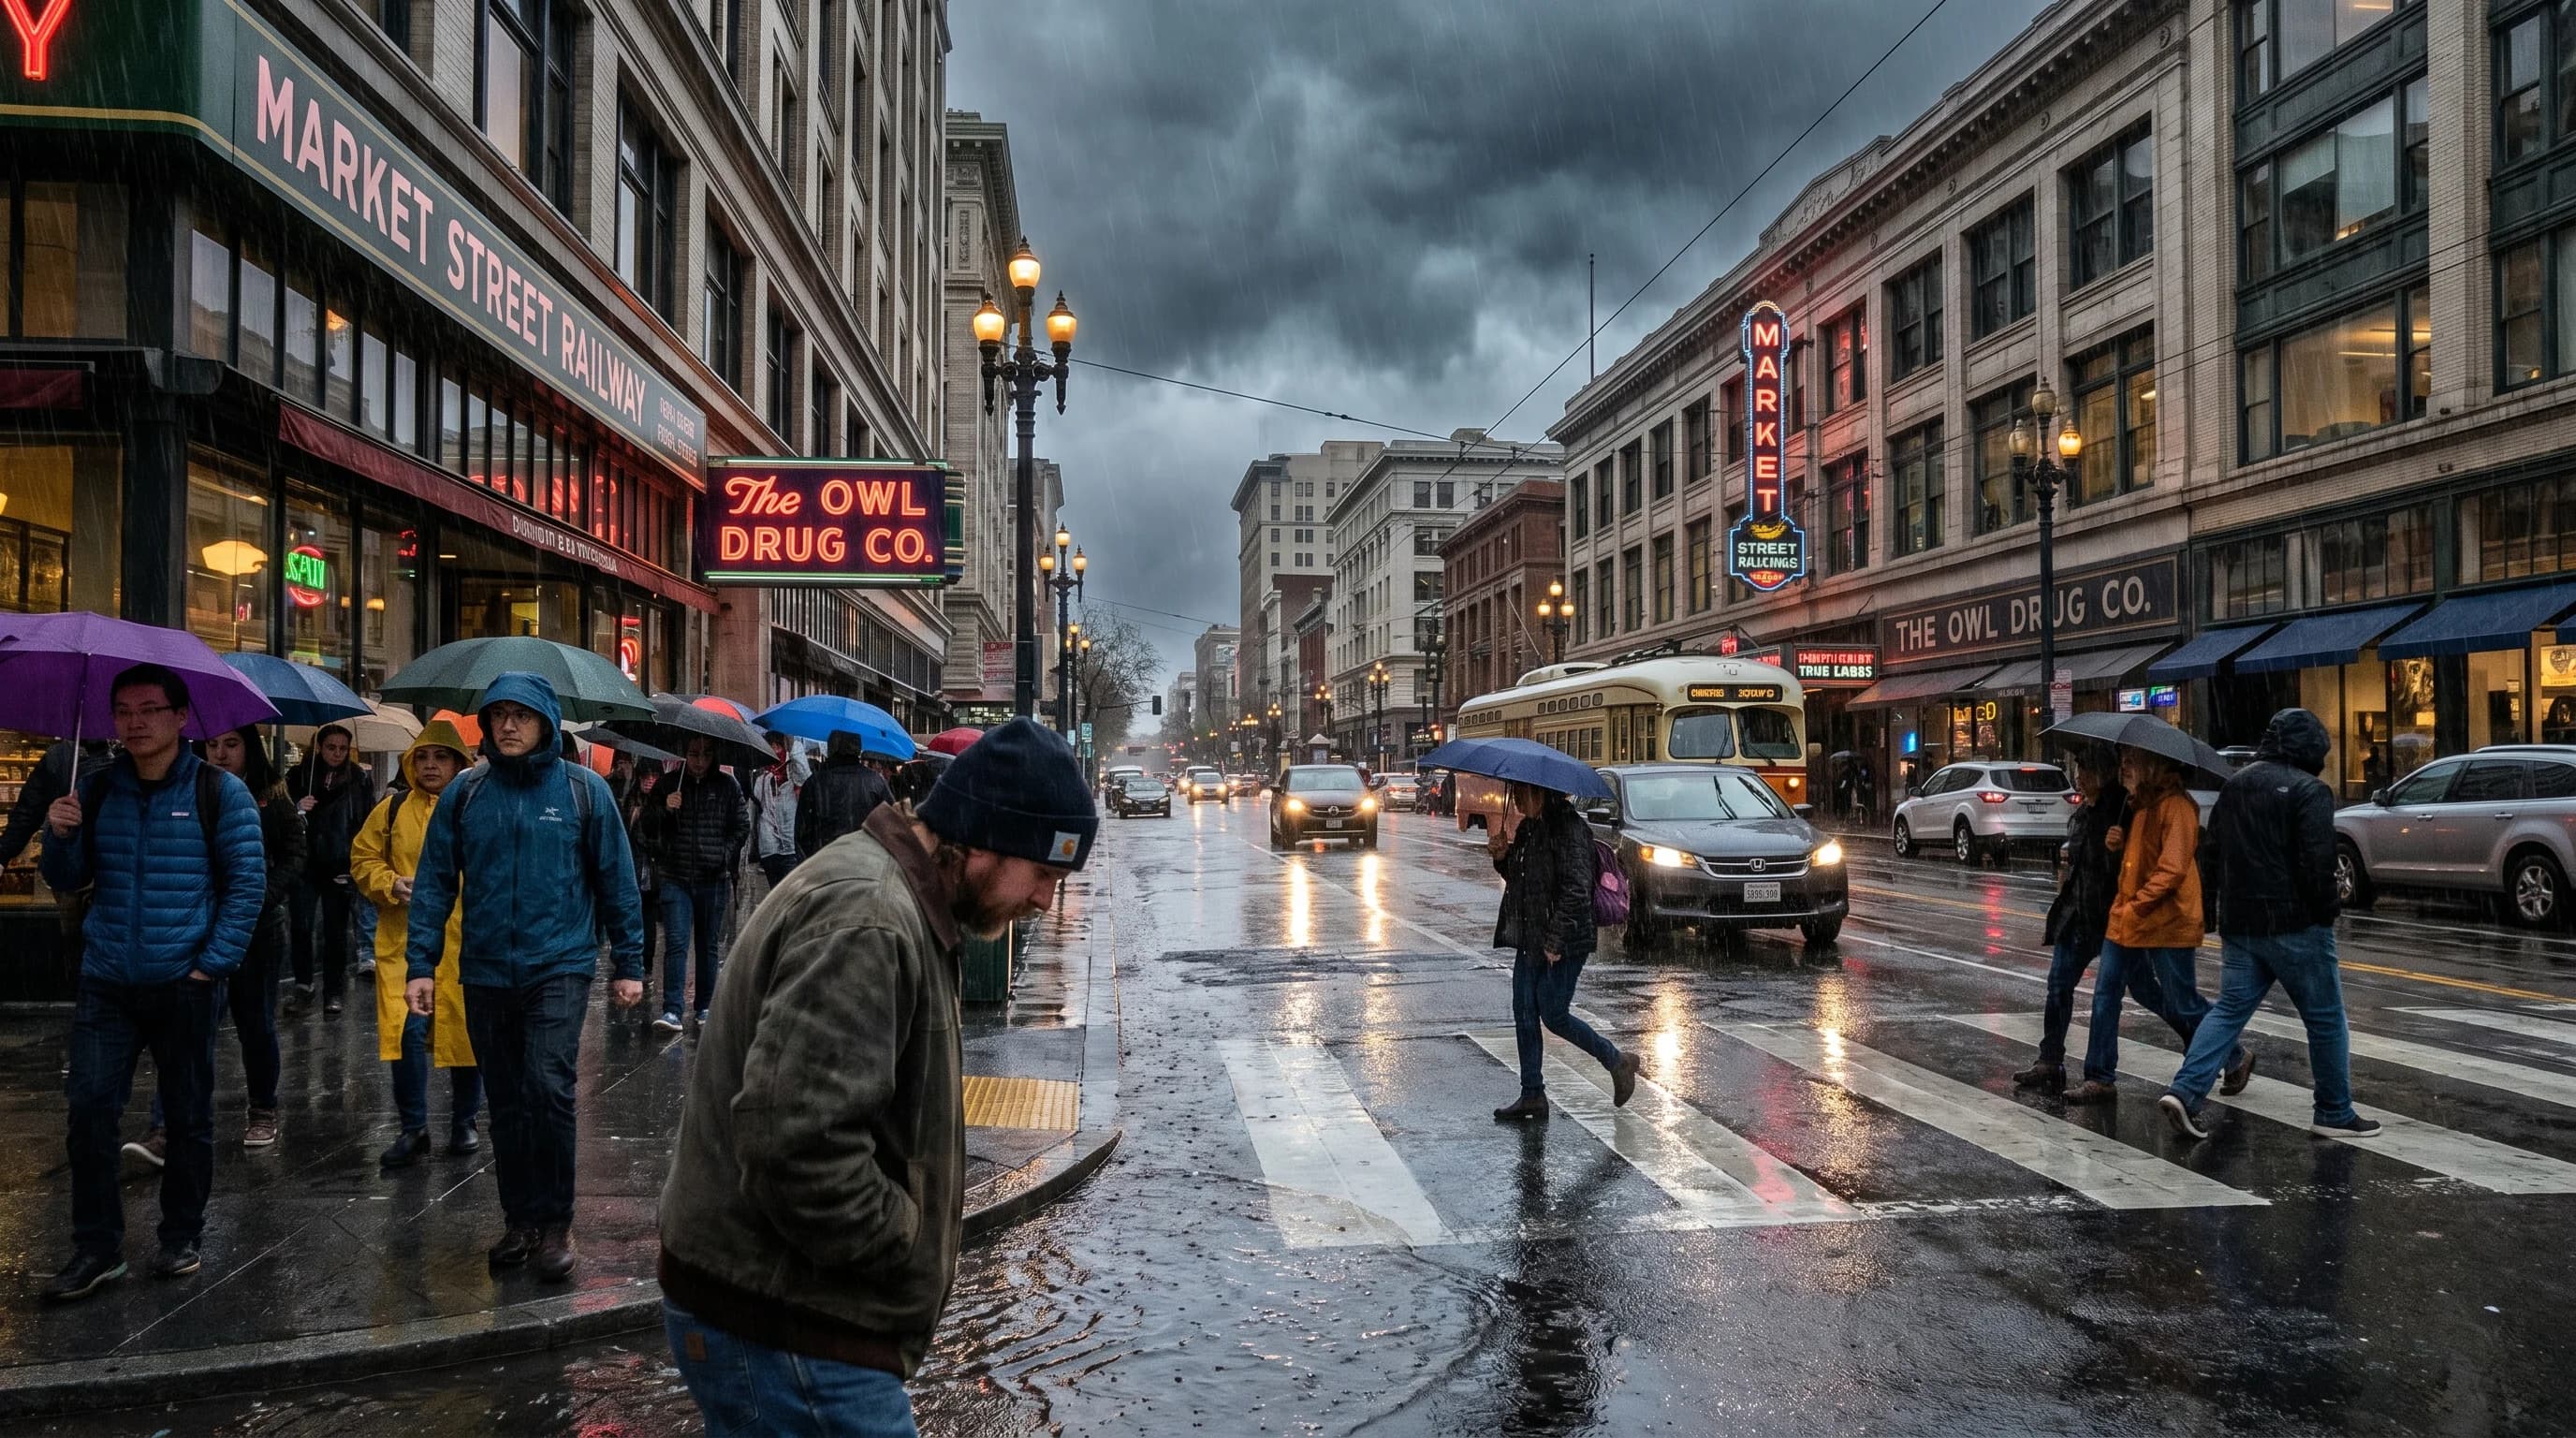
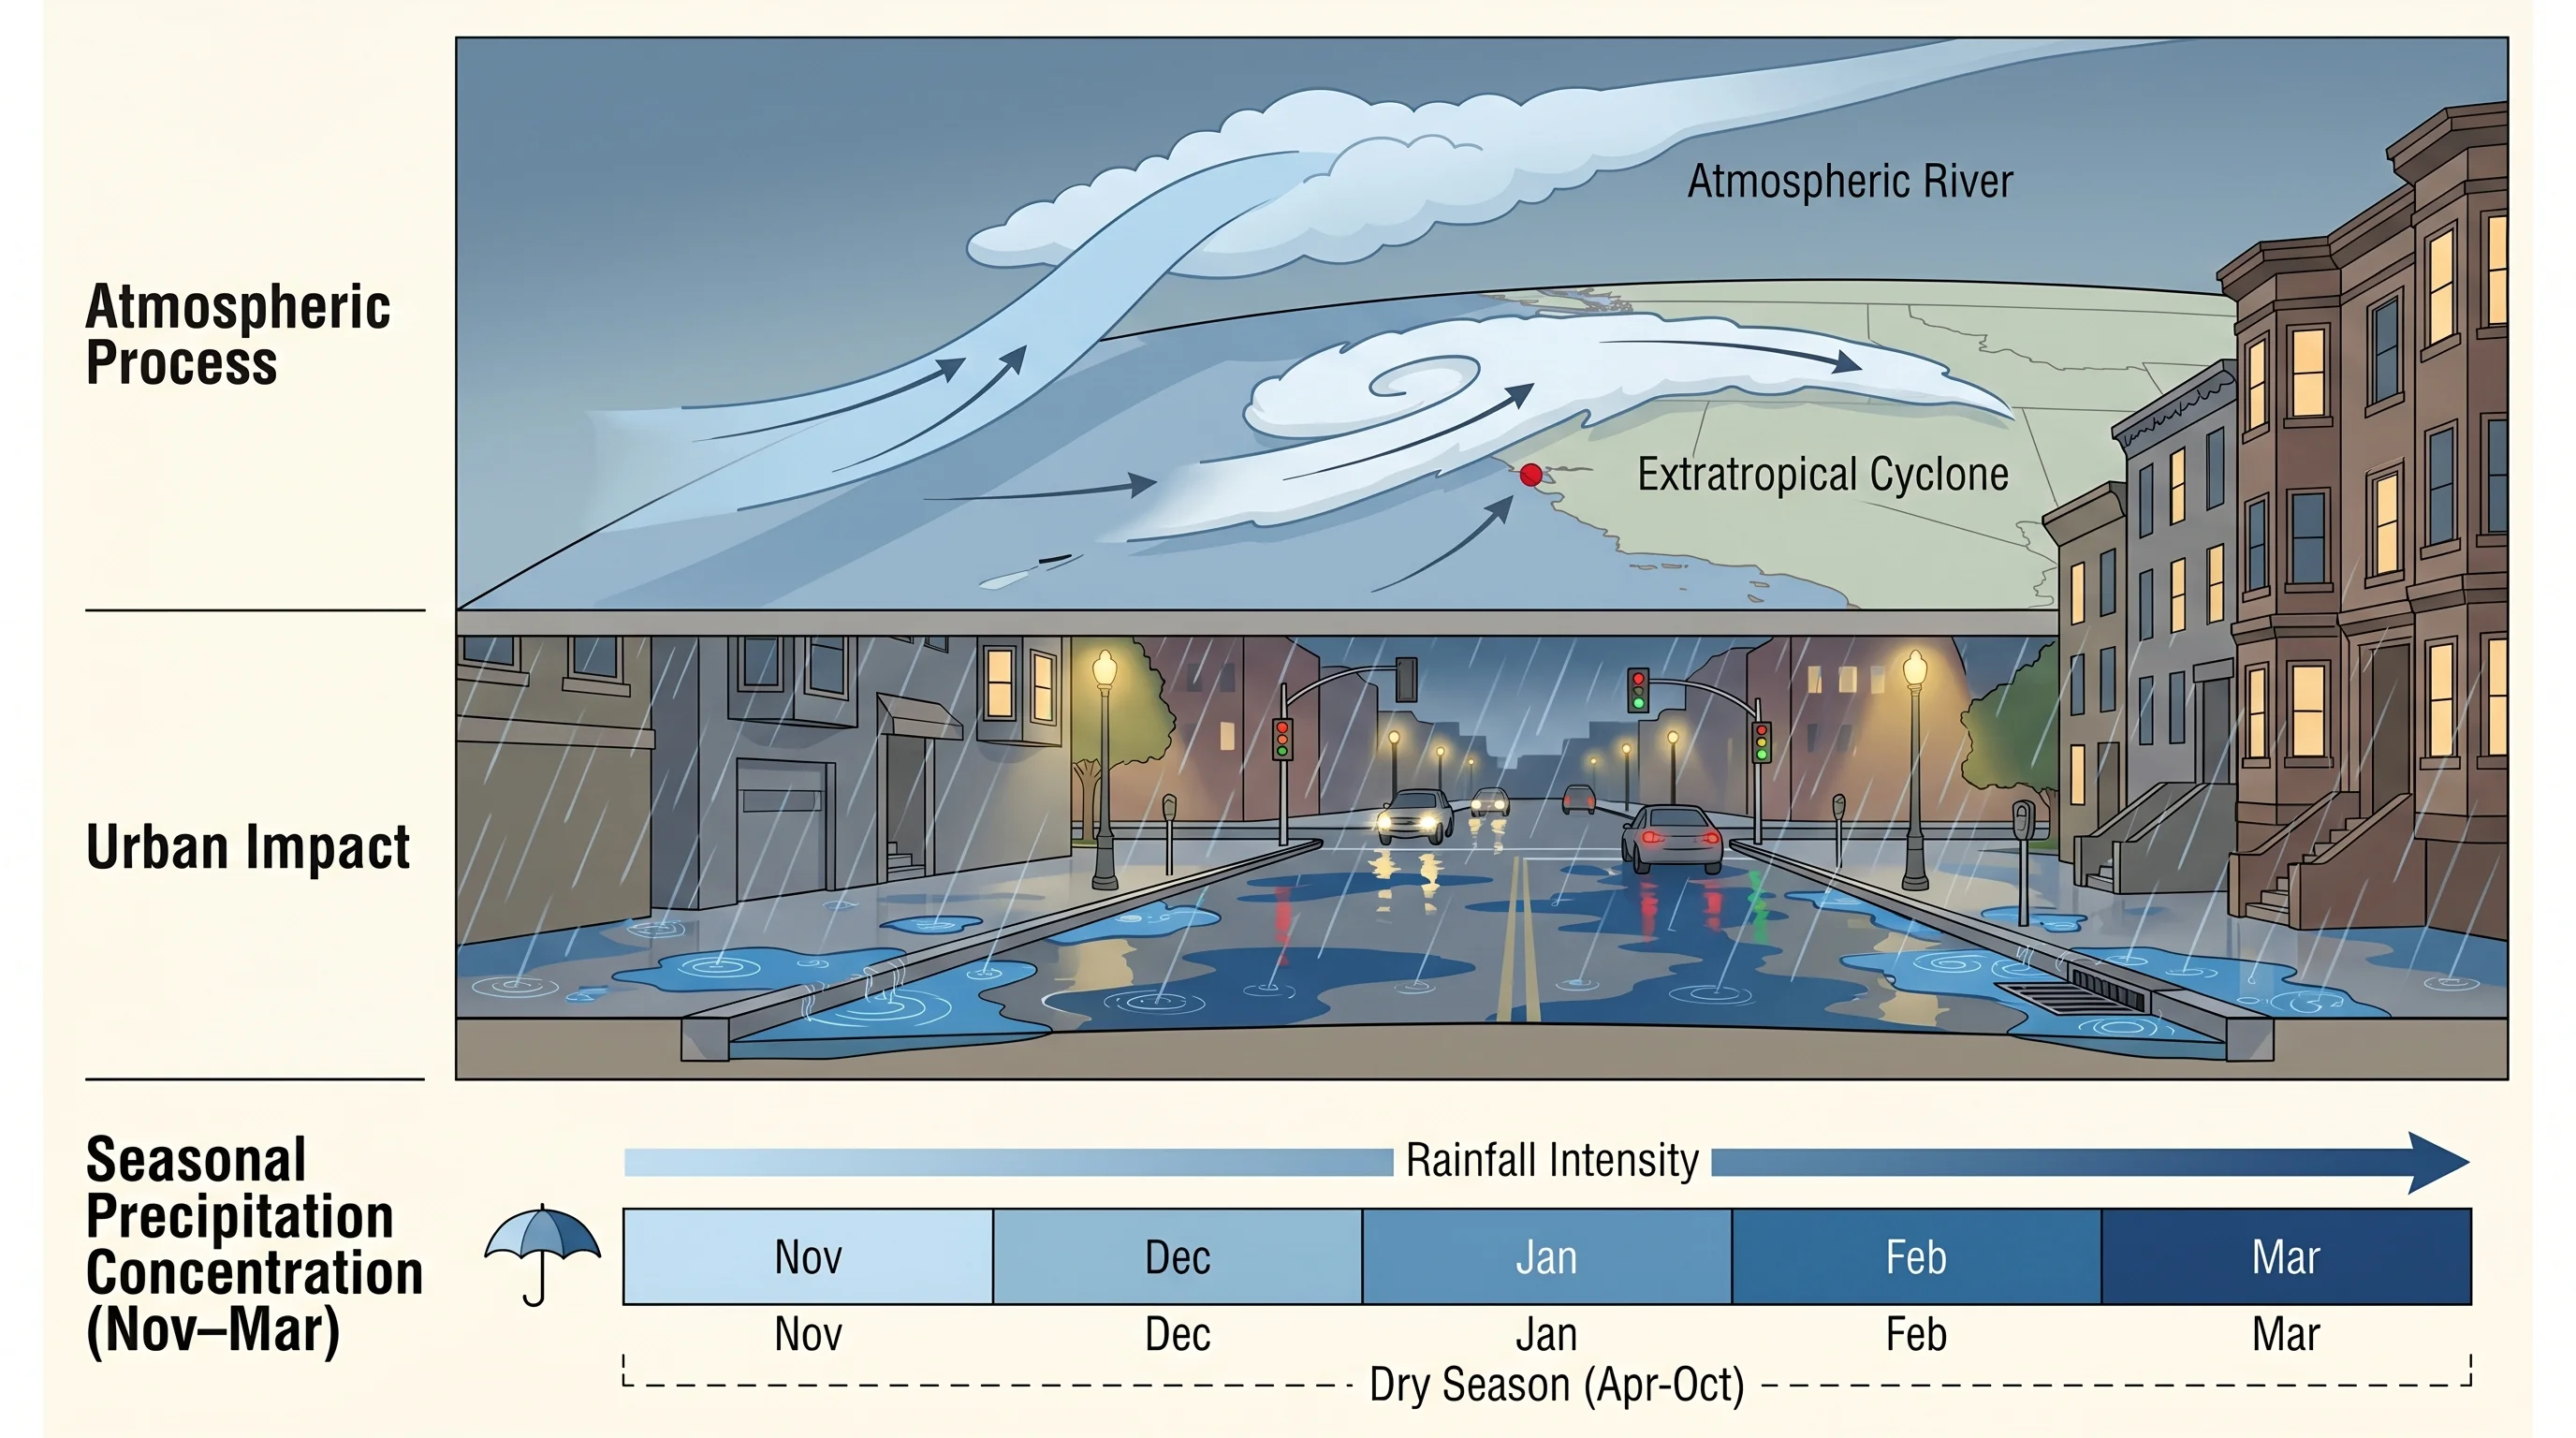
San Francisco averages about 23.6 inches of rain per year, measured at the downtown weather station. That is less than New York (46 inches), less than Seattle (37 inches), and roughly the same as Los Angeles (14 inches at LAX, 20 inches downtown). The city's reputation as a rainy place comes not from volume but from concentration and frequency: nearly all 23 inches fall in a five-month window from November through March, and the city sees about 67 rainy days per year. When it rains in San Francisco, it rains for days at a stretch, driven by atmospheric rivers that funnel tropical moisture directly into the Bay Area coast.
How Much Rain Does San Francisco Get Each Year?
The 30-year average (1991-2020) for San Francisco downtown is 23.6 inches. But annual totals vary enormously: the wettest year on record was 1982-83 with over 38 inches, driven by a powerful El Nino. The driest was 2012-13 with just 5.6 inches, during the multi-year California drought. That sixfold difference between wettest and driest years illustrates how dependent the Bay Area is on the ENSO cycle and the year-to-year variability of Pacific storm tracks.
Monthly Rainfall Breakdown
January is the wettest month at 4.4 inches. February averages 4.0 inches, December 3.8 inches, March 3.1 inches, and November 2.5 inches. These five months account for about 75% of the annual total. April averages 1.4 inches, October about 1.0 inch, and the summer months (June through September) average a combined 0.2 inches. The dry season is genuinely dry: many years see zero measurable rainfall from May through September.
The wettest single daysin San Francisco history have produced 3 to 5 inches in 24 hours, usually during atmospheric river events. These are the storms that cause urban flooding in low-lying neighborhoods, overwhelm the combined sewer system, and produce the dramatic images of waterfalls cascading down San Francisco's steepest streets.
Does Rainfall Vary Across San Francisco?
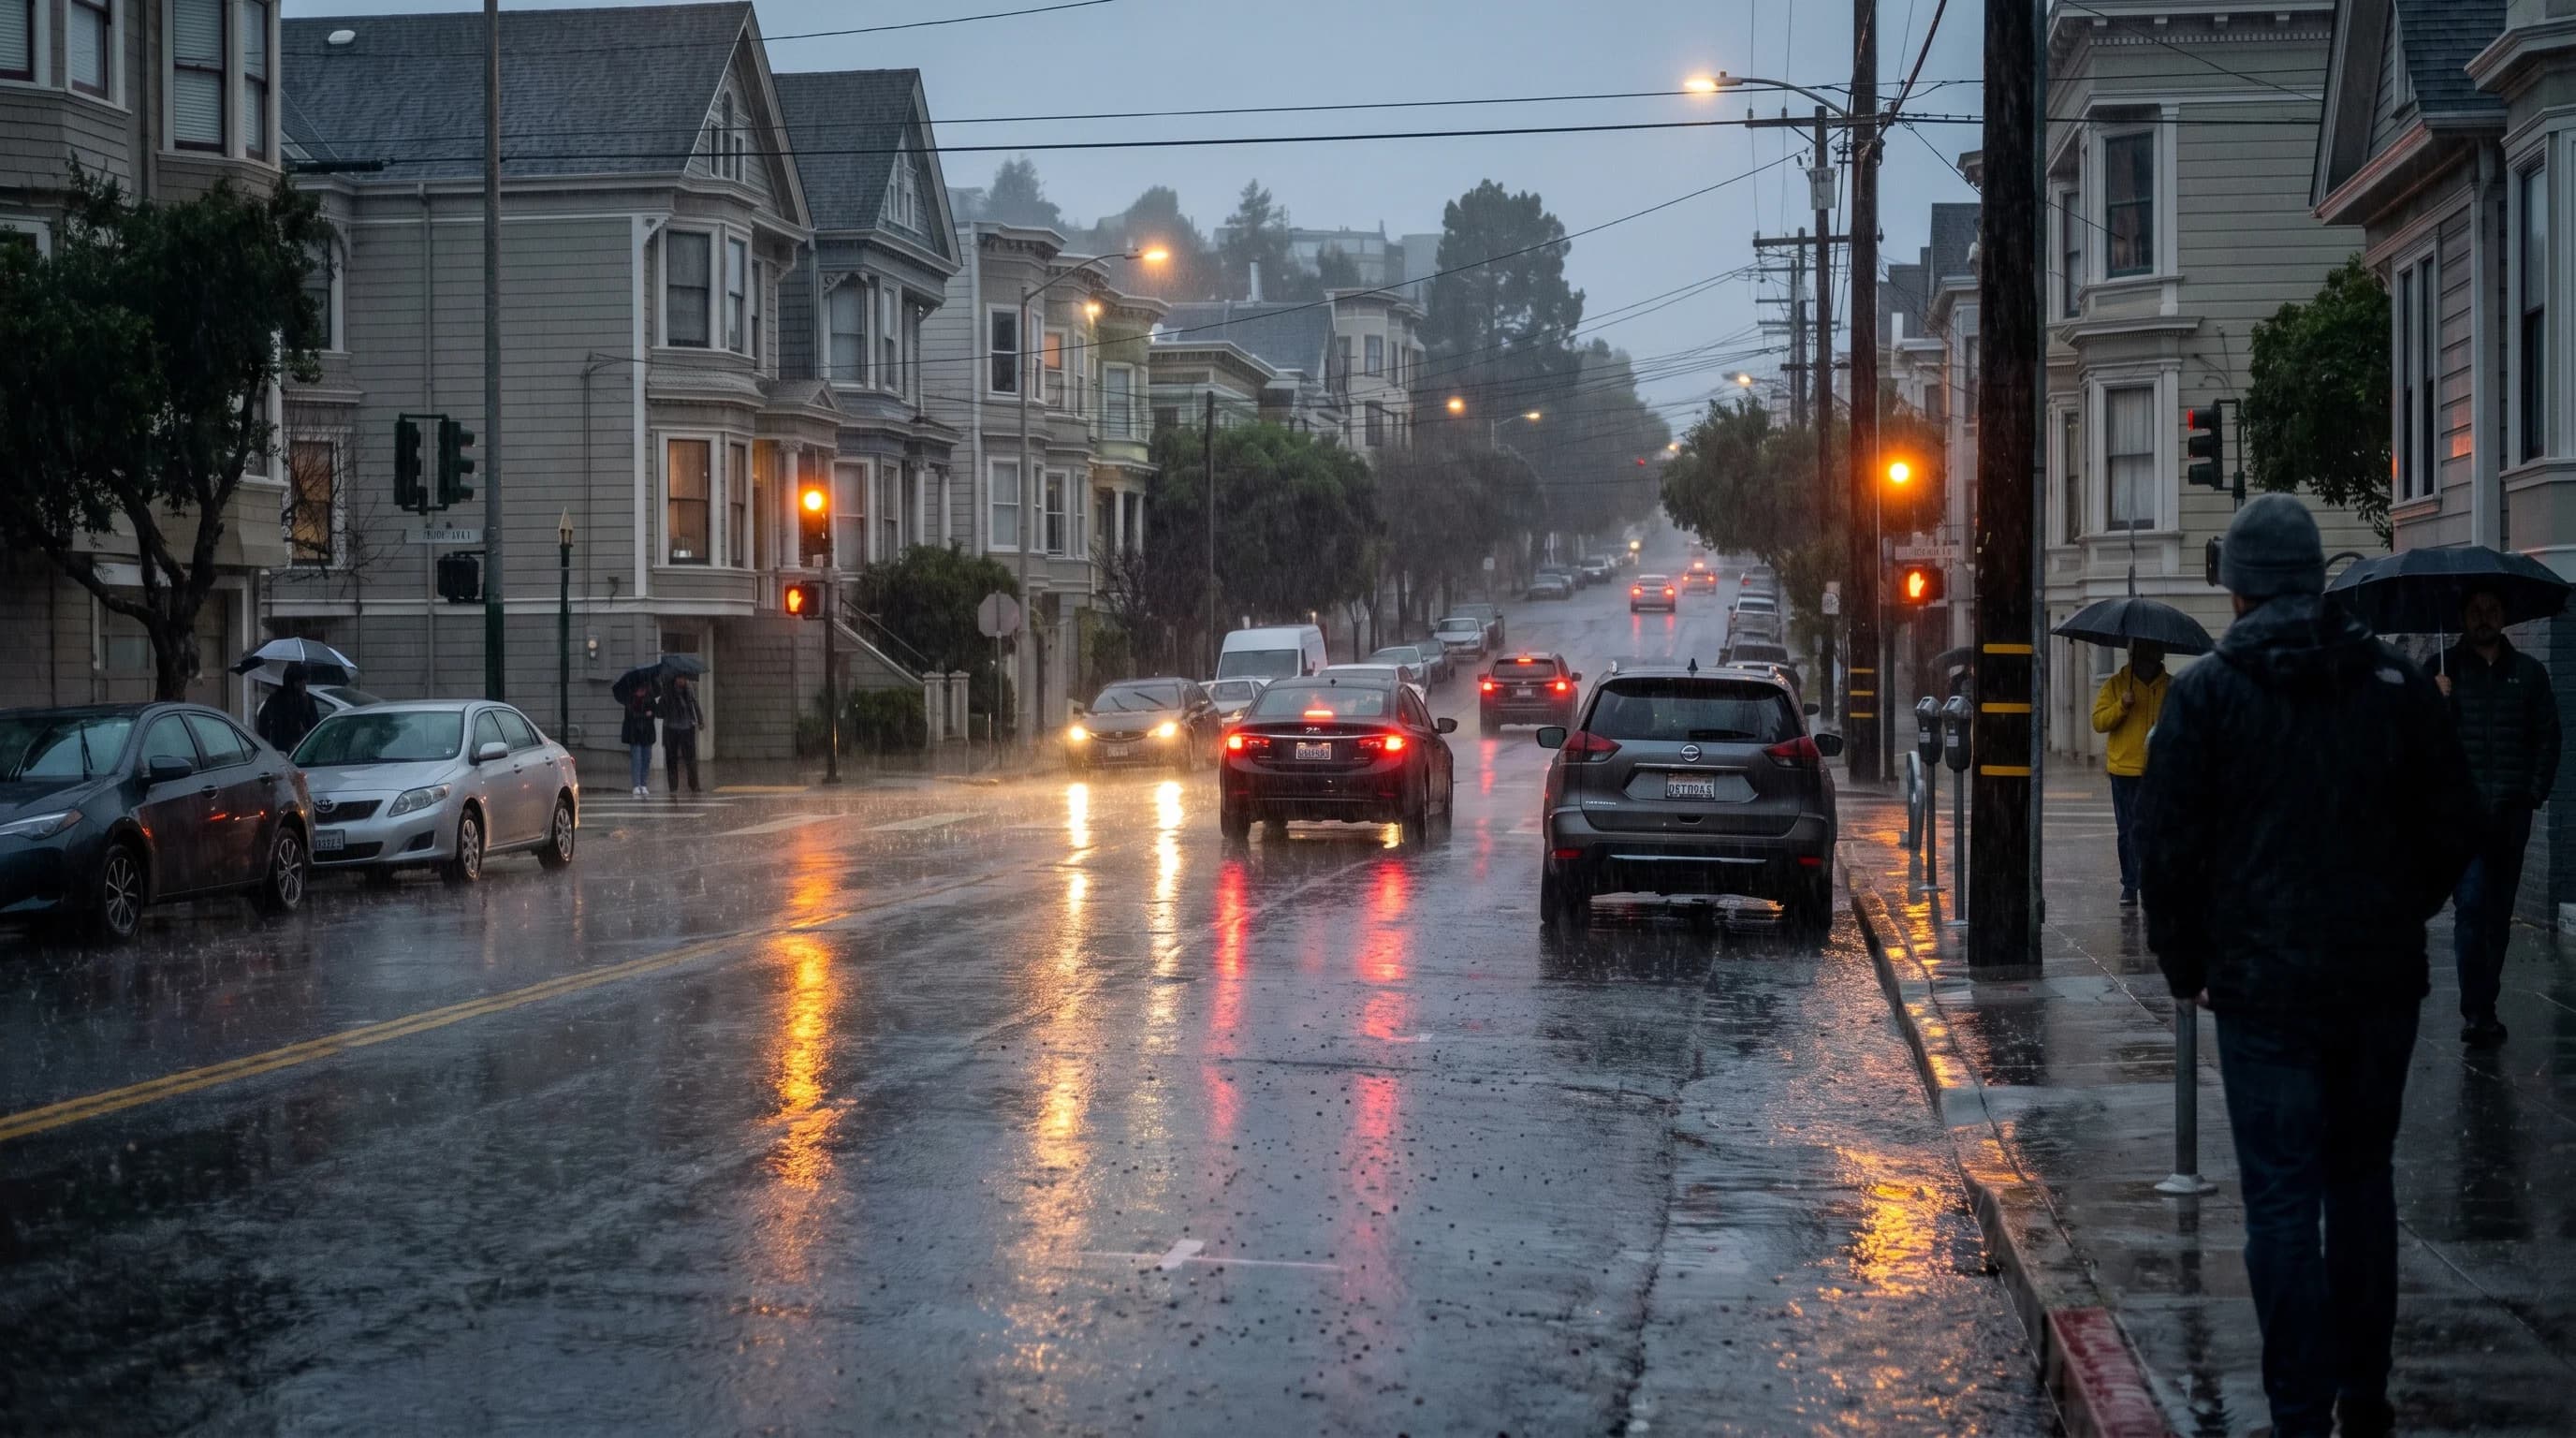
Yes, modestly. The western hills and elevated neighborhoods ( Twin Peaks, Mount Davidson, Sunset Heights) receive slightly more rain than the bay-facing east side of the city, because storms approach from the west and the terrain produces minor orographic enhancement. The difference is about 2-4 inches per year across the city, less dramatic than the microclimate temperature variation but measurable. The Mission District, sheltered by Twin Peaks, receives slightly less rain than the Outer Sunset.
Drought Years and Wet Years
San Francisco's rainfall record shows dramatic swings between drought and deluge. The 2012-2016 drought was the worst in state history, with multiple years of well-below-average rainfall. The 2022-23 winter swung the other direction, with atmospheric rivers delivering above-average rainfall that ended drought conditions and filled reservoirs. These swings are a defining feature of California\'s Mediterranean climate: wet seasons that deliver feast or famine, with little middle ground.
San Francisco's 23 inches per year is a number that conceals as much as it reveals. The annual total is modest, but the concentration into winter months means the city can feel very rainy for five months and bone-dry for seven. The variability from year to year means any single season can be far wetter or drier than the average suggests. For planning purposes, expect rain from November through March, assume summer is dry, and check the seasonal forecast to know which kind of winter you are walking into.