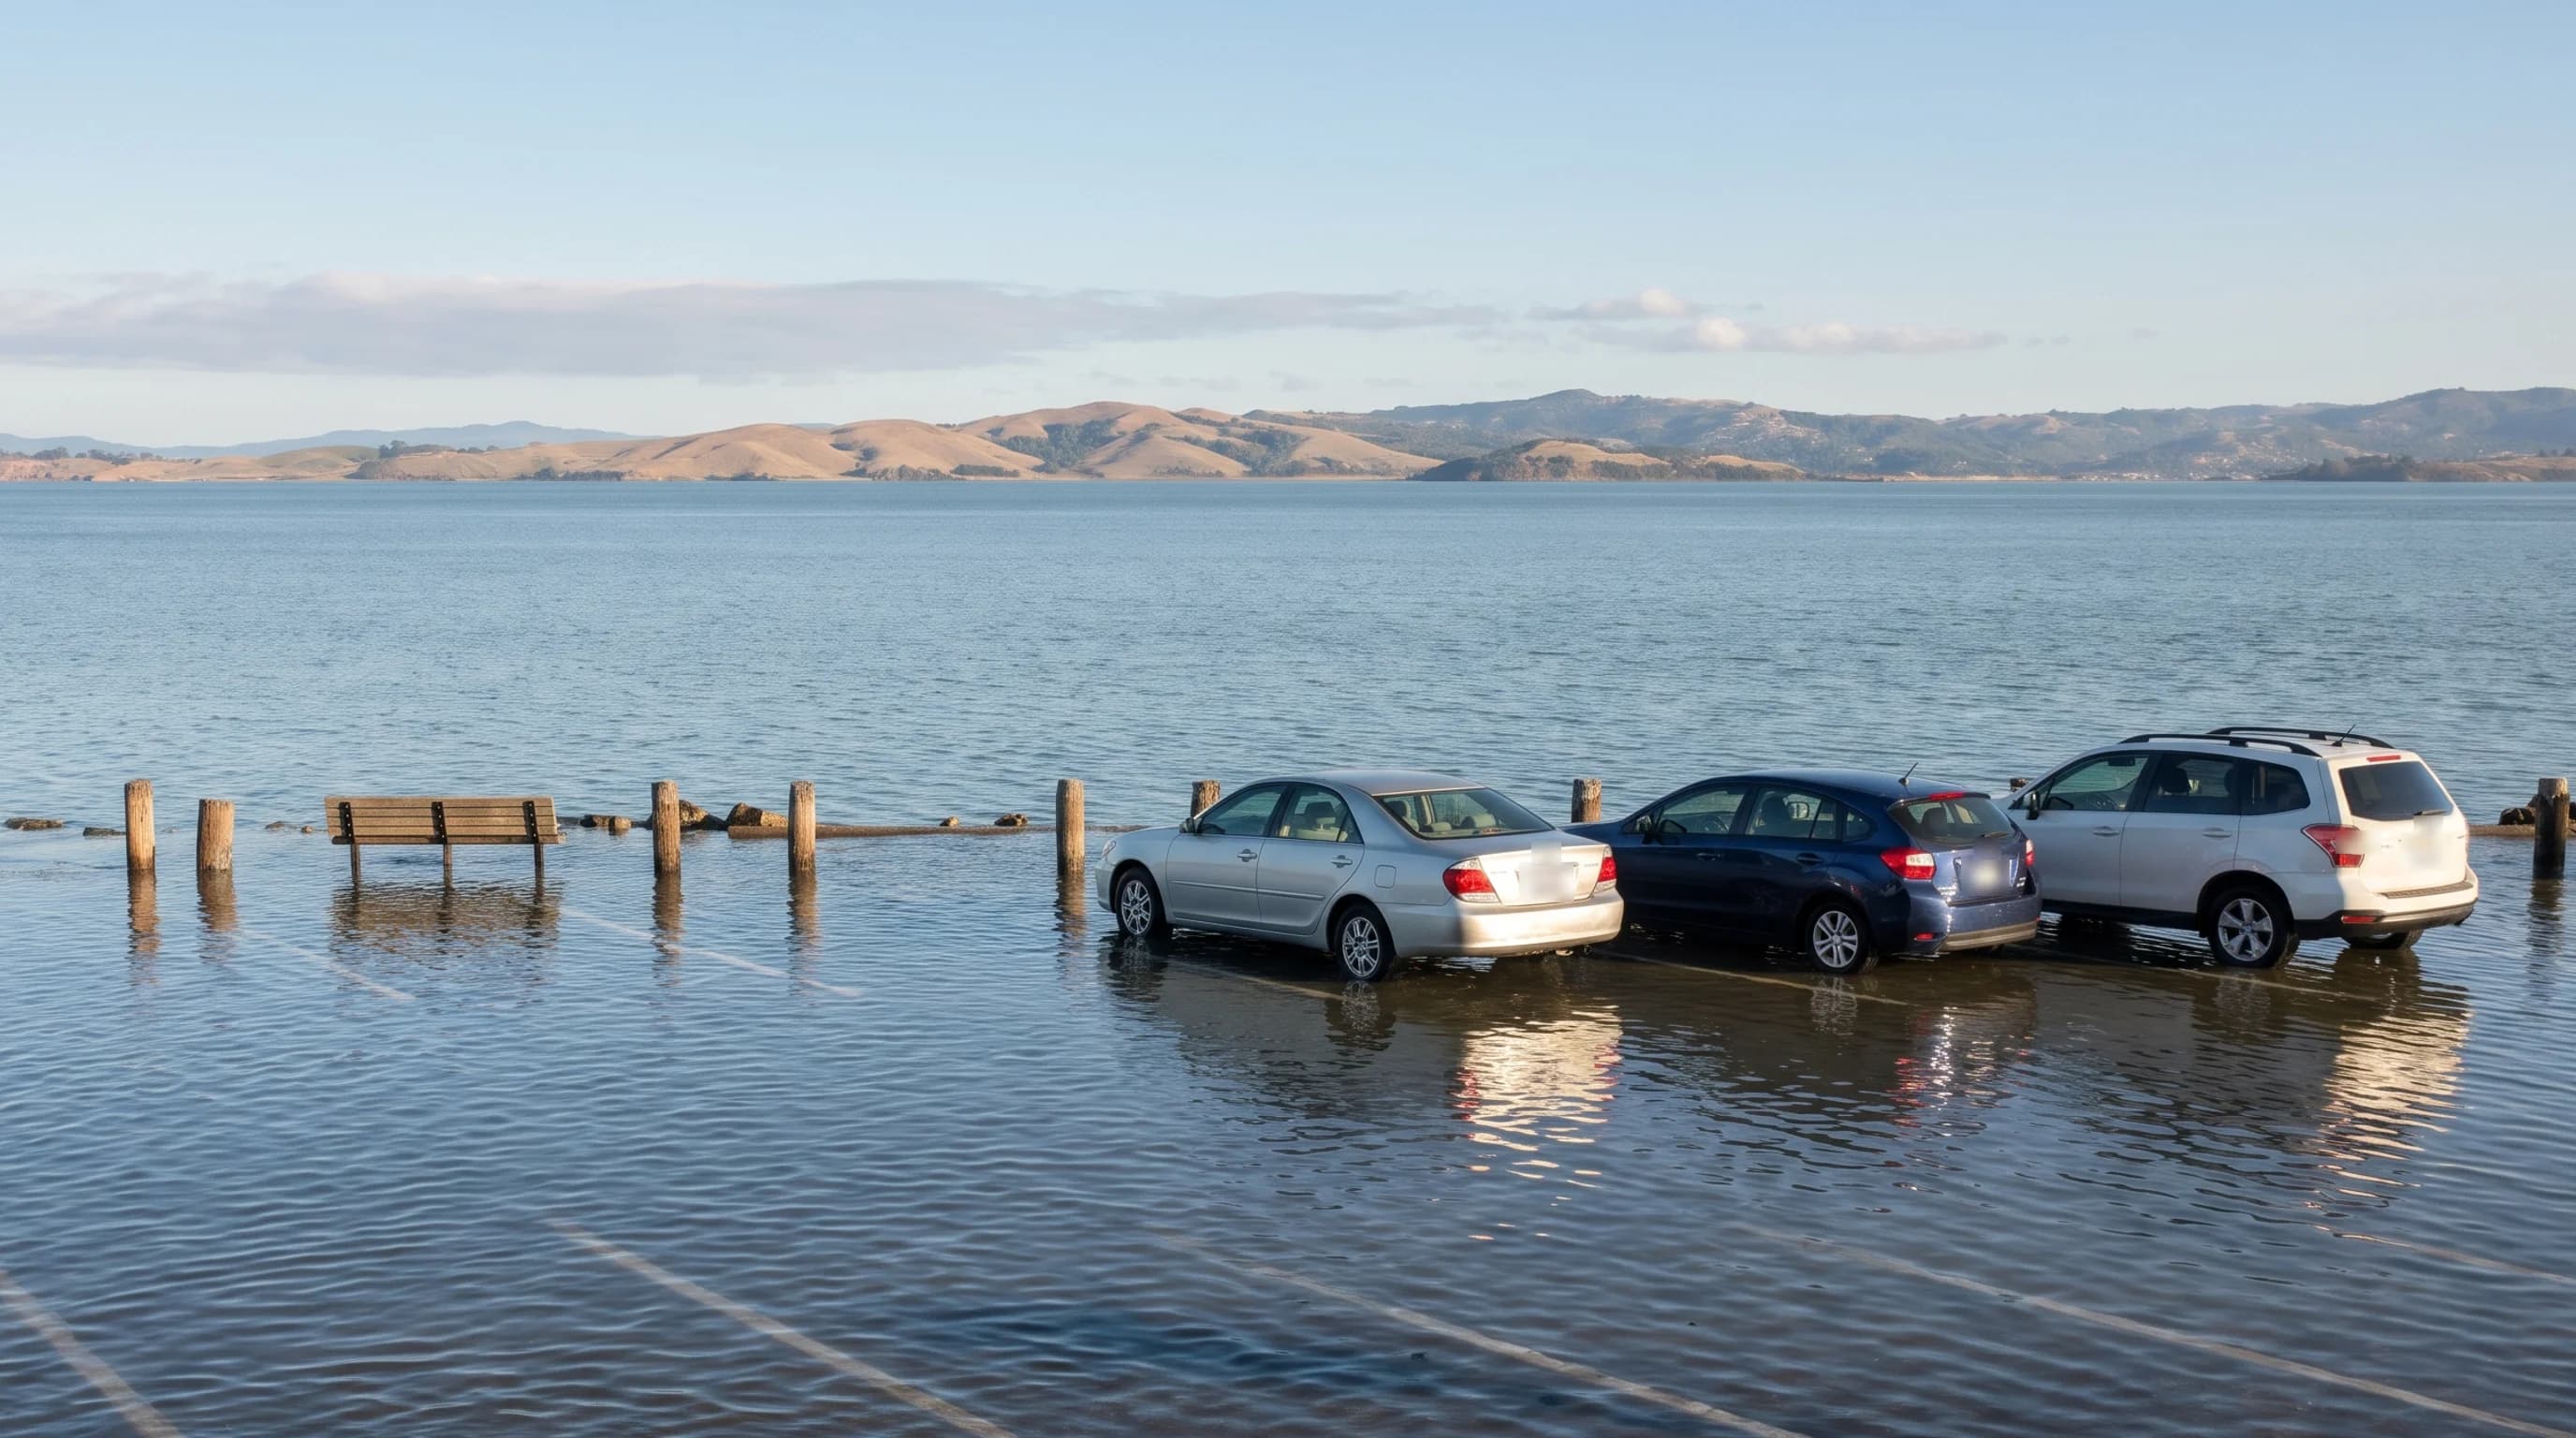
A Kelvin wave is a slow, very wide wave of warm water that El Niño pushes across the Pacific and up the coast of the Americas. Kelvin waves are the main reason water in San Francisco Bay has been about a foot higher than the tide tables predict this fall. They are also why high tides flooded roads around the bay on dry, sunny days in late October.
You can't see a Kelvin wave, and it won't knock anyone over on the beach. Instead, it slowly raises the level of the ocean by a few inches to a foot and keeps it there for weeks. On most days, nobody notices the difference. During the highest tides of the month, though, that extra water can reach parking lots, shoreline paths and low streets that normally stay dry. That matters this winter, because the king tides, the highest tides of the year, arrive in late November and late December.
What Is a Kelvin Wave?
Think of the tropical Pacific as a very long bathtub, with Indonesia at one end and South America at the other. The steady winds near the equator, called trade winds, normally blow from east to west. They push warm surface water toward Indonesia, so the ocean there is actually higher than it is off South America.
Every few years, the tropical Pacific warms up in a natural pattern called El Niño, and those winds weaken. Sometimes they even reverse for a while. When that happens, the piled-up warm water flows back east, like water sloshing back across a tub. The front of that returning water is a Kelvin wave. It is named for William Thomson, the physicist later known as Lord Kelvin, who described this kind of wave in 1879.
If you were out on the ocean, you would hardly notice one passing. NOAA describes Kelvin waves as slow, very wide waves that stretch for thousands of miles but raise the ocean's surface only about 6 to 12 inches. Most of the change happens below the surface. The top layer of warm water gets thicker, and it pushes the cold water underneath hundreds of feet deeper. That is why scientists track Kelvin waves with ocean buoys, satellites and computer models rather than by looking at the water.
Its slow pace also makes a Kelvin wave very different from a tsunami. A tsunami crosses an ocean within hours of an earthquake and comes ashore as a series of fast surges. By contrast, a Kelvin wave moves about 150 miles a day and raises the water gradually over days and weeks. For the Bay Area's actual tsunami risk, see can a tsunami hit San Francisco.
Why Is San Francisco Bay So High Right Now?
The bay is high because the ocean just outside the Golden Gate is higher than normal. Tide tables, and the tide apps that use them, are based on the pull of the moon and sun. They assume the ocean itself is at its normal level.
NOAA measures the water level in San Francisco every few minutes with an instrument called a tide gauge. Throughout October, the gauge showed the water about a foot higher than the tide tables predicted. The water stayed that high on calm days as well as stormy ones. Storms can raise the water too, but their effect fades within a day or two. When the water stays high for weeks, it means the ocean itself has risen.
For people who live or work near the water, each high tide has come in roughly a foot higher than expected. Most of the time, that extra foot causes no problems. But the highest tides of each month, which come around the new moon and full moon, now spill into places that are normally dry.
That is what happened on Monday, October 26, when high water flooded Miller Avenue in Mill Valley and closed the road. TV station KION reported that a driver stranded in the water had to be helped out by a tow truck crew. That morning, the water at the San Francisco gauge reached the level NOAA counts as minor flooding, even though the tide had been forecast to stay well below it.
The table below shows how far above normal the bay has been this fall. It also shows the highest levels reached during the strongest El Niños of recent decades.
| Period | Above normal (inches) | Note |
|---|---|---|
| September 2026 | +4.8 | NOAA monthly mean |
| October 2026 (Oct 1-28) | about +10 | Preliminary estimate |
| Peak of the 1982-83 El Niño (March 1983) | +10.6 | |
| Peak of the 1997-98 El Niño (February 1998) | +10.9 | Highest month since 1980 |
| Peak of the 2015-16 El Niño (October 2015) | +5.2 |
Monthly mean sea level at San Francisco (NOAA station 9414290). Normal is the 1991-2020 average for each month, with the long-term rise since 1980 removed. October 2026 is estimated from preliminary NOAA data through October 28.
How Does a Kelvin Wave Travel From the Equator to San Francisco?
The journey to San Francisco takes months, and most of it happens along the equator. NOAA says the trip across the Pacific alone takes two to three months. Earth's spin keeps the wave close to the equator, so it moves east in a narrow band instead of spreading out across the ocean.
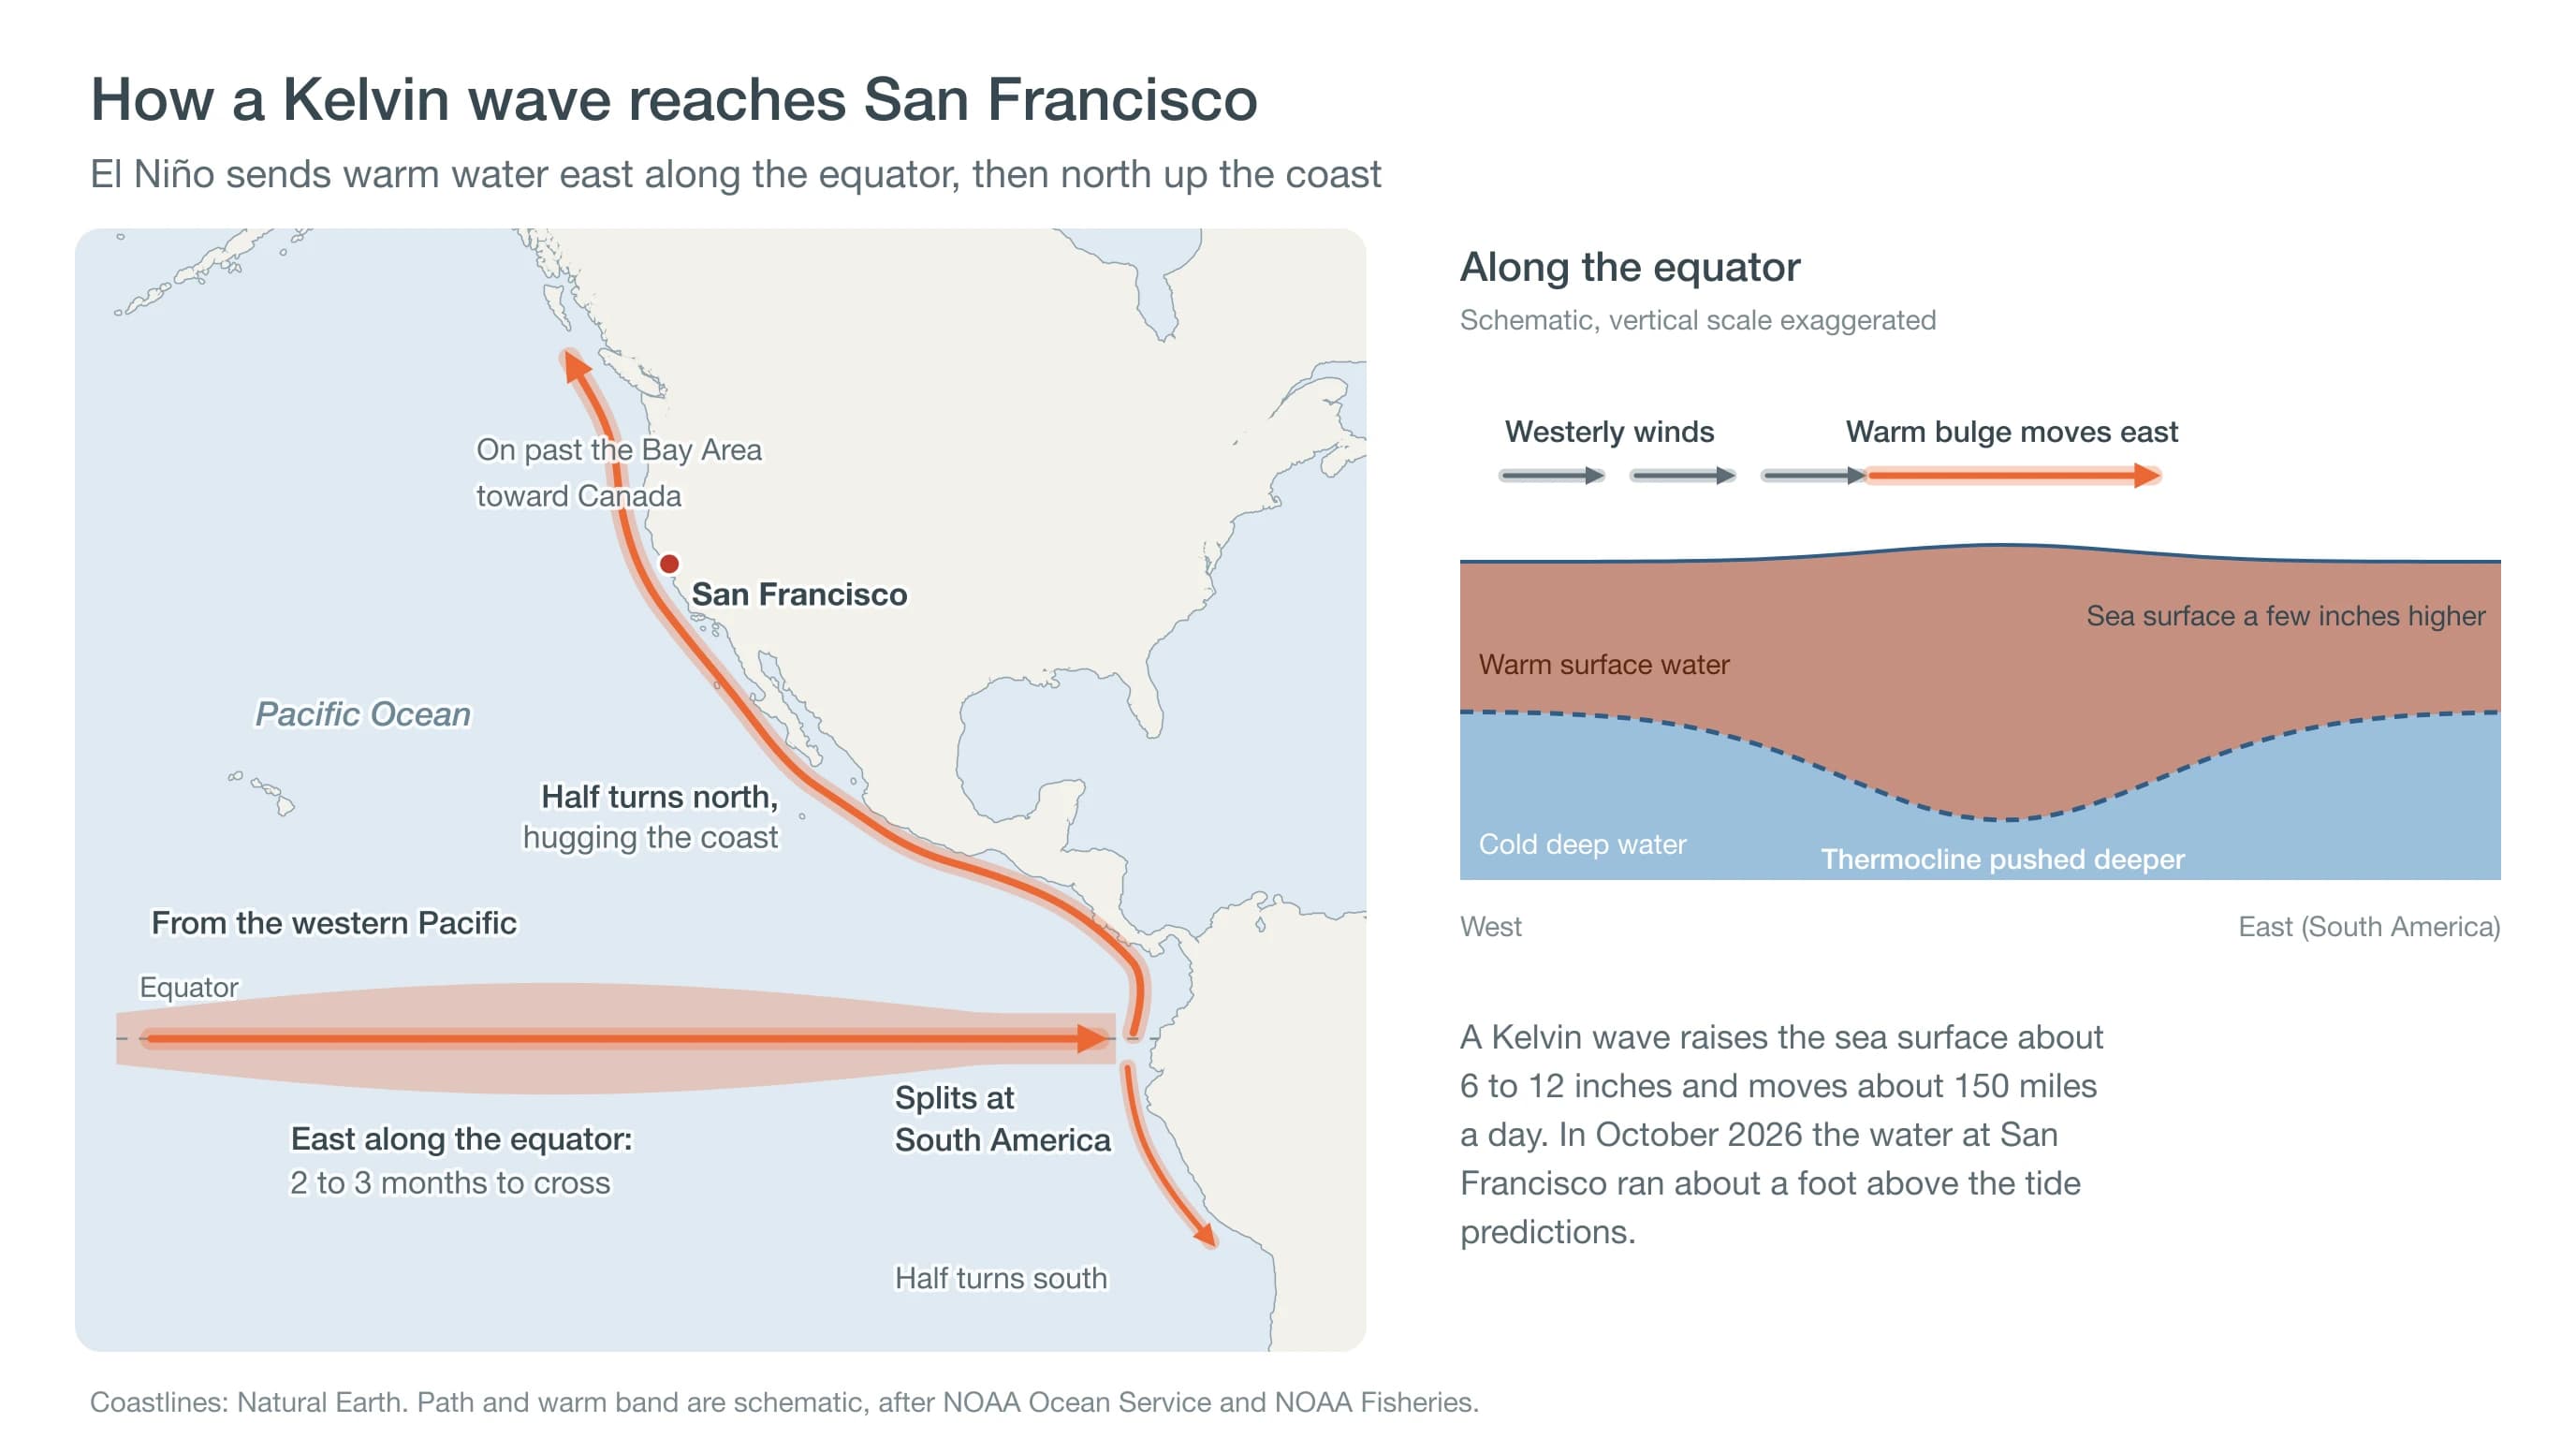
When the wave reaches South America, it splits in two, with one part heading south and the other heading north. The northern part stays close to the coastline, again held there by Earth's spin. It travels past Central America and Mexico, along California and on toward Canada. In early October, NOAA scientists reported one of these waves moving up the West Coast, with one or two more still crossing the Pacific.
Warm water also raises the sea level on its own, because water expands as it warms. The layer of warm El Niño water now sitting off the California coast keeps the ocean higher, even between waves. To learn what El Niño means for rain and storms this winter, see what El Niño 2026-27 could mean for Bay Area weather.
Has the Bay Been This High Before?
The bay has been this high before, during the strongest El Niños of the past 50 years. The San Francisco gauge has recorded the tides since 1854, one of the longest records on the West Coast. In the winters of 1982-83 and 1997-98, the bay rose 8 to 11 inches above normal at its peak, sometime between November and March.
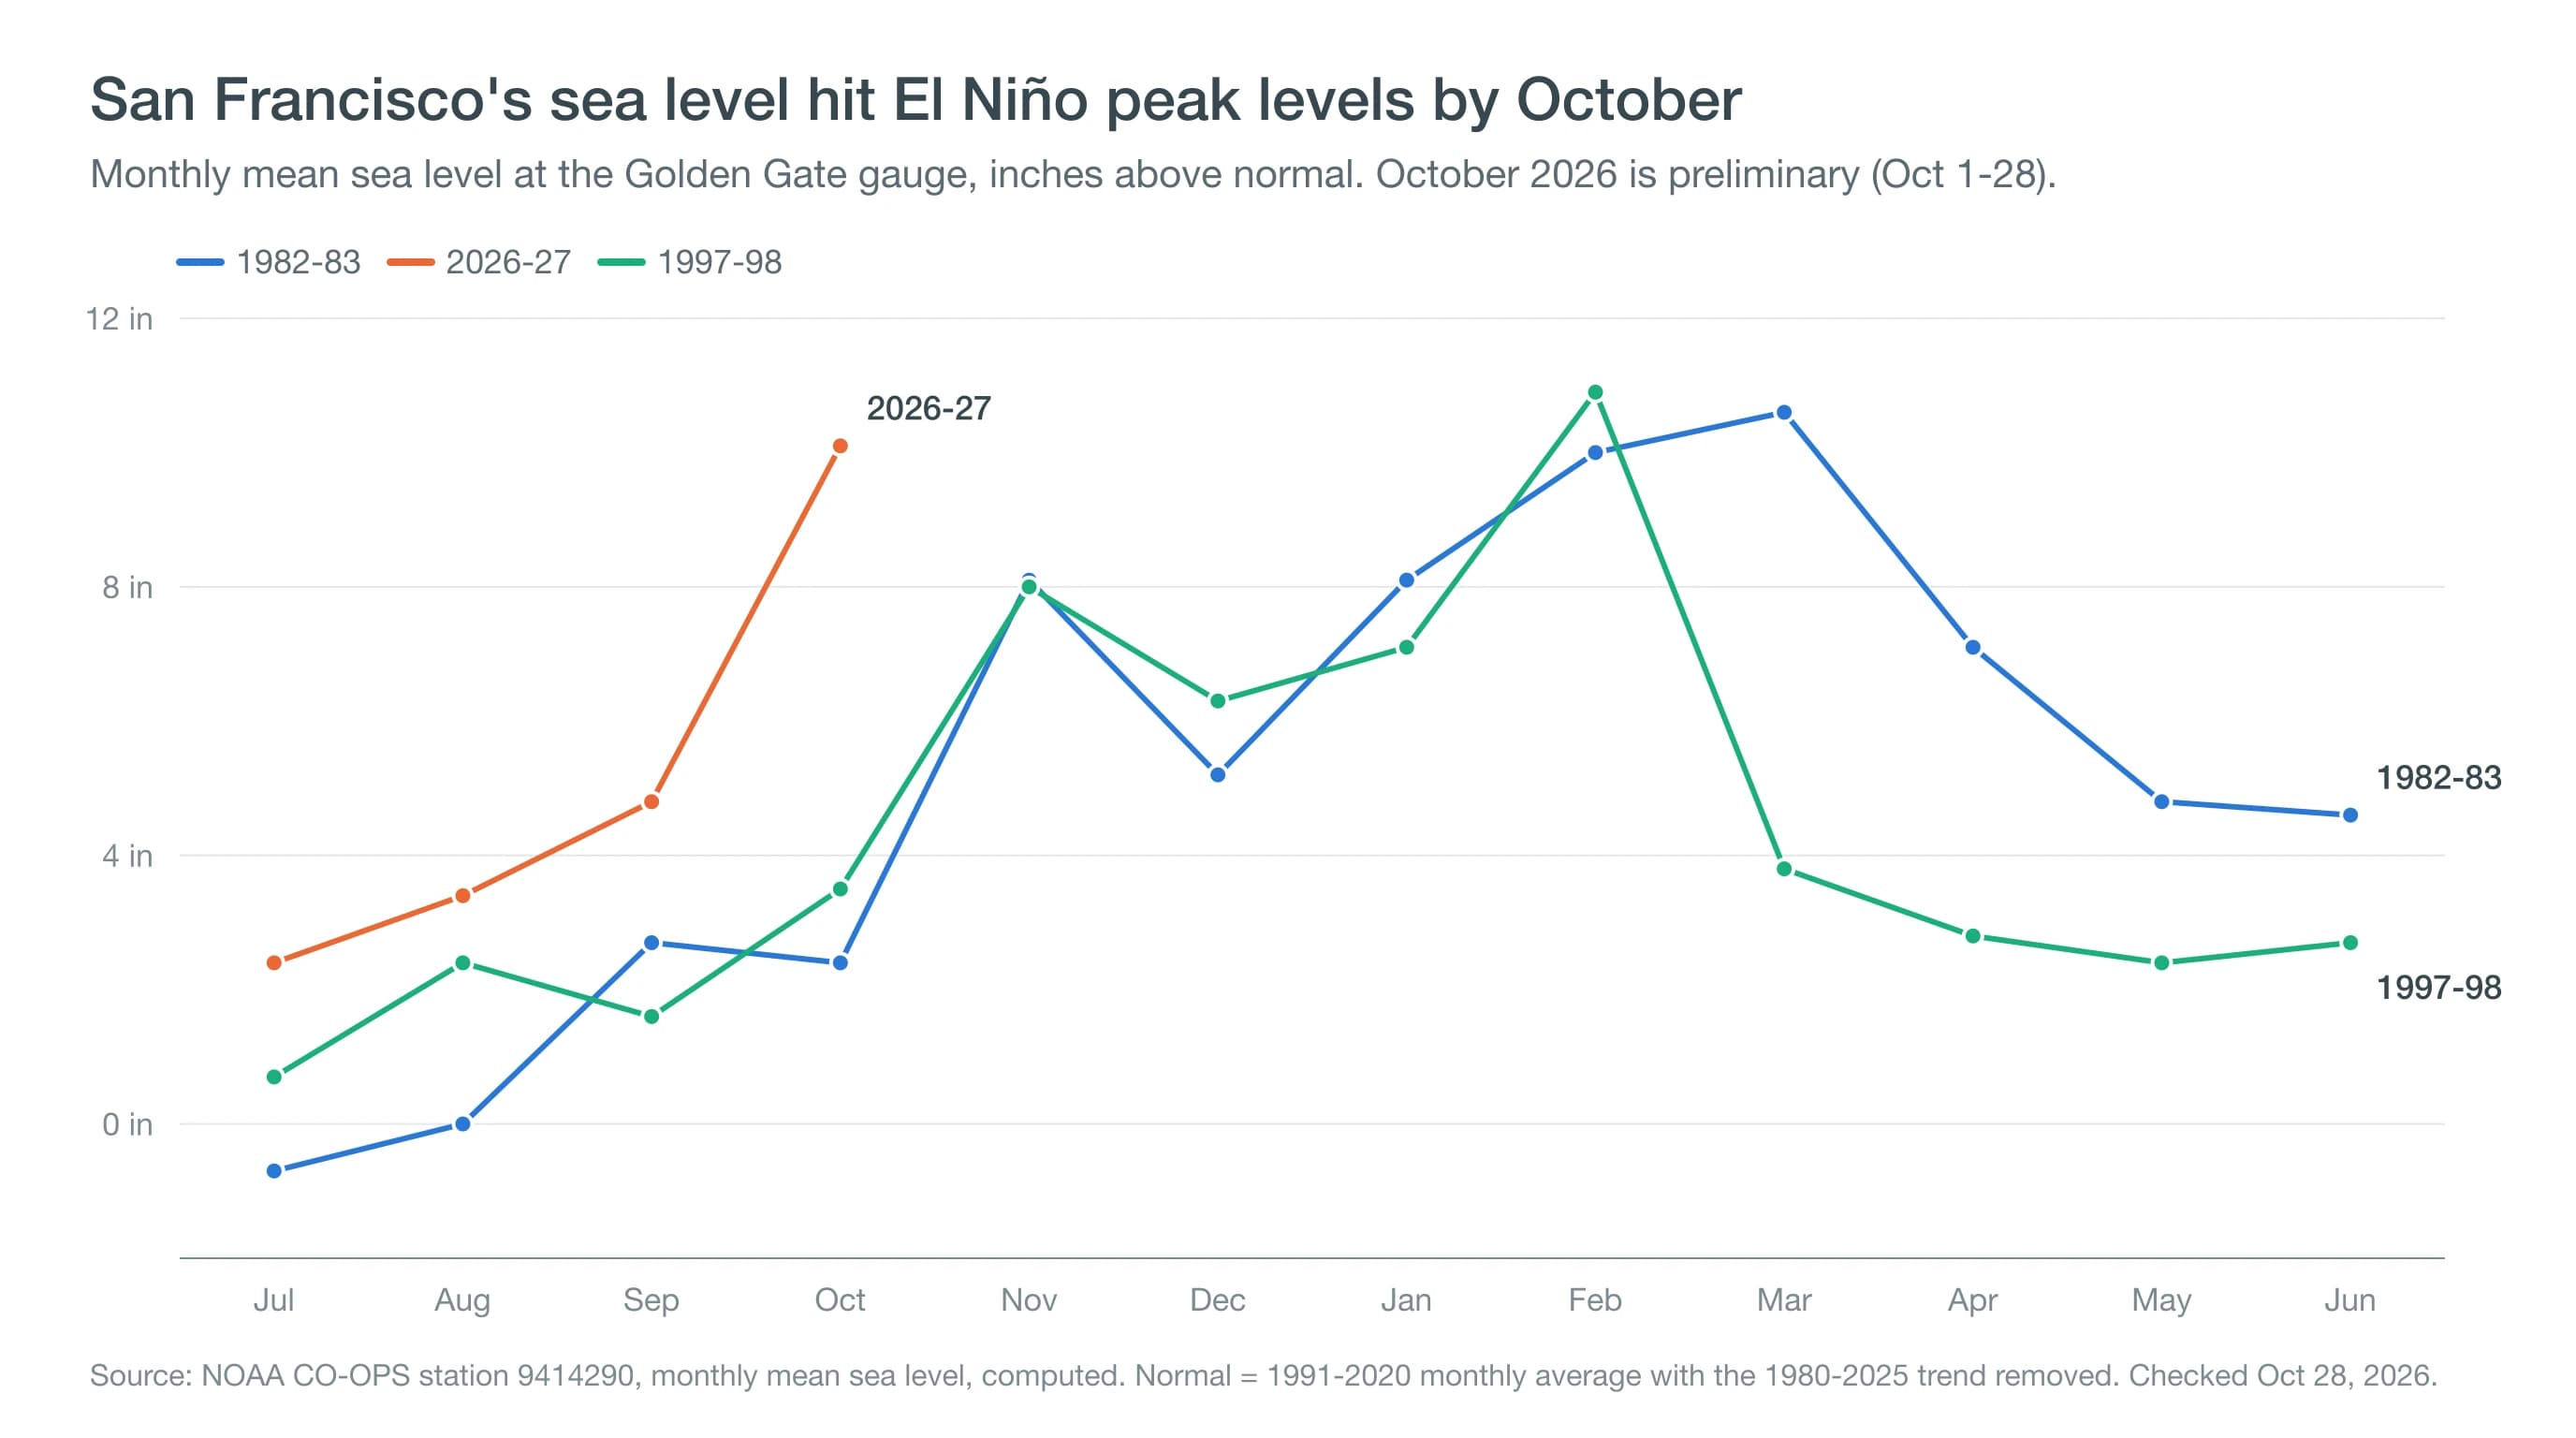
What is unusual this year is how early the water rose. In October of those earlier El Niños, the bay was only a few inches above normal. This October, it had already reached the highest levels of those winters. The king tides and the stormiest months are still to come.
Those winters also show how long the high water can last. In 1982-83, the bay stayed more than 4 inches above normal for 14 straight months. On January 27, 1983, a winter storm hit while the sea was already high. The water reached 8.66 feet, the highest ever recorded at the gauge. In 1997-98, the high water peaked in February 1998 and was back to normal by the following fall. The 2015-16 El Niño, also a strong one, raised the bay only about 5 inches.
NOAA's Climate Prediction Center expects a strong to very strong El Niño to last at least through the end of this winter. Even so, no one can say how high the water will get, so past El Niños are a guide rather than a forecast. For what the 1997-98 winter did on land, from mudslides to closed highways, see El Niño in 1997-98 vs. 2026-27.
What Does This Mean for King Tides and Storms This Winter?
The extra foot matters most on king tide mornings. Even in a normal year, these tides push water onto the Embarcadero and into low parking lots in Marin. This winter's king tides arrive November 24-26 and December 23-25, with the water peaking in the morning.
NOAA predicts the highest of them will reach about 7 feet at the San Francisco gauge, more than a foot above an average high tide. If the ocean is still a foot higher than normal, the water would instead reach about 8 feet. That would be within half a foot of the all-time record, even on a calm day with no storm.
| Date | Predicted high (feet) | If the ocean stays a foot high (feet) |
|---|---|---|
| Tue, Nov 24, 2026 | 6.94 | 7.9 |
| Wed, Nov 25, 2026 | 7.03 | 8.0 |
| Thu, Nov 26, 2026 | 6.95 | 7.9 |
| Wed, Dec 23, 2026 | 7.19 | 8.2 |
| Thu, Dec 24, 2026 | 7.23 | 8.2 |
| Fri, Dec 25, 2026 | 7.08 | 8.1 |
NOAA predictions for San Francisco (station 9414290), in feet above mean lower low water, the average height of each day's lowest tide. The last column adds 1 foot, about how far the water ran above the predictions in October. It is a scenario, not a forecast. NOAA's minor and moderate flood levels for the station are 7.71 and 8.64 feet, and the record is 8.66 feet.
The bigger worry is a storm arriving on one of those mornings. Strong winds blowing toward shore and the low air pressure of a storm both push extra water into the bay. That combination set the 1983 record, when the water rose more than a foot and a half above the predicted tide.
If you live, park or commute near the shoreline, watch the places that already flood during king tides. They include the Embarcadero near the Ferry Building, Manzanita and Miller Avenue in Mill Valley, and low streets in Sausalito. Low areas along the levees in Foster City, Alviso at the south end of the bay and Highway 37 across the San Pablo Bay marshes are also at risk.
On king tide mornings, move cars out of shoreline parking lots before high tide and allow extra time on roads near the bay. Never drive into flooded roads, since the National Weather Service warns that 12 inches of moving water can carry away most cars. Our king tide guide has the full schedule and more flood spots. The explainer on coastal flood advisories, watches and warnings covers what each alert level means.
Does a Kelvin Wave Change the Ocean Off the Bay Area?
A Kelvin wave also makes the ocean off the Bay Area warmer. Normally, winds along the coast in spring and summer pull cold water up from deep below the surface. This process, called upwelling, is why the Pacific off San Francisco is so cold. The cold water also carries nutrients that feed plankton, the tiny drifting plants and animals at the base of the ocean food chain.
NOAA scientists say Kelvin waves push that cold water deeper, so less of it reaches the surface. With fewer nutrients coming up, plankton can grow more slowly. A NOAA buoy about 20 miles west of San Francisco measured an average water temperature of about 61°F in October, roughly 4 degrees warmer than usual. Even so, the water is still too cold for most people to swim without a wetsuit.
Our guide to San Francisco Bay water temperatures has month-by-month readings, and why the Pacific is so cold in California explains upwelling in more depth.
Deep Dive: What Physics Drives a Kelvin Wave?
Kelvin waves belong to the same family as tsunamis. Both are gravity waves, in which gravity pulls a raised hump of water back down and the hump travels along as it does. A tsunami lifts the whole ocean from top to bottom, however, while a Kelvin wave mostly moves the boundary between two layers of water. That one difference explains why a Kelvin wave is so slow and why it clings to the equator and the coast.
Why Is a Kelvin Wave So Much Slower Than a Tsunami?
The speed of a gravity wave depends on how strongly gravity pulls it back and how deep the moving water is. For a tsunami, full gravity acts on the entire depth of the ocean. Over about 4,000 meters (13,000 feet) of open Pacific, that works out to roughly 200 meters per second, or about 440 miles per hour.
A Kelvin wave travels along the thermocline, the boundary between warm surface water and the colder water below. In the tropical Pacific, the warm layer is only about 0.3 percent lighter than the cold water beneath it. As a result, the force pulling a bulge in that boundary back into place is only about 0.3 percent of normal gravity, which oceanographers call reduced gravity. With a warm layer 150 to 200 meters thick, the same math gives a speed of about 2 to 2.5 meters per second. That is close to the 2.4 meters per second that NOAA's Pacific Marine Environmental Laboratory uses for these waves.
At that speed, about 5 miles per hour, crossing roughly 15,000 kilometers (9,300 miles) of equatorial Pacific takes two to three months. The same small density difference explains why the sea surface barely moves. The surface rises only about one three-hundredth as much as the thermocline sinks. By our rough calculation, pushing the thermocline down 50 meters lifts the surface by about 15 centimeters, or 6 inches. That is in line with NOAA's figure of 6 to 12 inches.
Why Does It Stay on the Equator and Then the Coast?
Earth's spin turns moving water to the right in the Northern Hemisphere and to the left in the Southern Hemisphere. This is called the Coriolis effect, and it fades to zero right at the equator. When the warm water in a Kelvin wave flows east, the Coriolis effect nudges it back toward the equator from both sides, which keeps the bulge centered there. The physics only balances this way for waves moving east, which is why Kelvin waves never travel west along the equator.
How tightly the wave is held depends on a distance called the Rossby radius. A global study by Dudley Chelton and colleagues at Oregon State University put it at about 240 kilometers (150 miles) near the equator. That makes the wave there a band a few hundred miles wide. The radius shrinks quickly farther from the equator, to less than 10 kilometers beyond 60 degrees latitude. Along California it is only a few tens of kilometers, so the coastal wave travels as a narrow strip pressed against the shore, with the coast on its right.
Tide gauges along the coast recorded this journey during the 1997-98 El Niño. In a 2002 study, U.S. Geological Survey scientists found that sea level swings of more than 10 centimeters (4 inches) at San Francisco had traveled up the coast. They appeared first at Tumaco, Colombia, then at Los Angeles, then at San Francisco. The researchers traced most of the signal to waves that started along the equator. Local winds added to the rise but could not explain it on their own.
How Long Will the High Water Last?
Each Kelvin wave raises sea level along the coast for a few weeks. A strong El Niño can keep sending new ones, which is how the bay stayed high for more than a year in 1982-83. NOAA expects this El Niño to last through at least early spring. It would not be surprising if the bay stays higher than the tide tables predict well into winter. The amount will go up and down as new waves arrive and fade.
The simplest way to keep track is NOAA's Tides & Currents page for the San Francisco station. It shows the predicted tide and the actual water level on the same graph. If the actual level has been well above the prediction for days, add that difference to any tide height you look up.
To see what is still on the way, check the Climate Prediction Center's El Niño updates, which follow warm water crossing the Pacific. The National Weather Service's Bay Area office issues coastal flood advisories and warnings when water is expected to reach flood level.
For something called a wave, a Kelvin wave is remarkably easy to miss. What people do notice is the result: a bay about a foot higher than the tide tables say, and water showing up in places it usually doesn't reach. Before the king tides in late November and late December, check how far the actual water level is above the prediction, and add that to the forecast tide. Then check the Crissy Field forecast for wind and rain that morning, because a storm during a king tide is what set the 1983 record.